Free Statistics

of Irreproducible Research!

Author's title

Author*Unverified author*
R Software Modulerwasp_smp.wasp
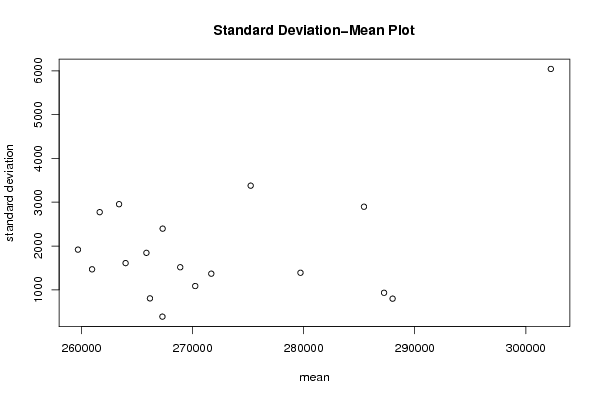
Title produced by softwareStandard Deviation-Mean Plot
Date of computationThu, 04 Jun 2009 03:31:09 -0600
Cite this page as followsStatistical Computations at FreeStatistics.org, Office for Research Development and Education, URL https://freestatistics.org/blog/index.php?v=date/2009/Jun/04/t12441079090mrjaal6tiq3y1z.htm/, Retrieved Tue, 14 May 2024 10:08:16 +0000
Statistical Computations at FreeStatistics.org, Office for Research Development and Education, URL https://freestatistics.org/blog/index.php?pk=41560, Retrieved Tue, 14 May 2024 10:08:16 +0000
QR Codes:

Original text written by user:
IsPrivate?No (this computation is public)
User-defined keywords
Estimated Impact137
Family? (F = Feedback message, R = changed R code, M = changed R Module, P = changed Parameters, D = changed Data)
-       [Standard Deviation-Mean Plot] [deviation Mean pl...] [2009-06-04 09:31:09] [1f24ecf252e89ff3a946a11432983a6a] [Current]
Feedback Forum

Post a new message
Dataseries X:
260288
261544
259886
257006
259670
258873
264416
263596
262586
260237
261690
259295
264170
264451
265538
261723
266189
265073
267007
266376
267406
262742
260300
263074
265940
264771
268403
264264
264118
266817
269296
269001
266707
267507
267510
267420
270845
270671
273653
271567
268372
268160
267879
271142
271323
269478
271008
269145
271684
273582
279475
276188
278422
281084
278618
280738
288897
282129
286406
284288
286139
288275
287670
286864
288798
288316
286915
288006
293338
303730
306248
305700
314849


Summary of computational transaction
Raw Inputview raw input (R code)
Raw Outputview raw output of R engine
Computing time1 seconds
R Server'Gwilym Jenkins' @ 72.249.127.135

\begin{tabular}{lllllllll}
\hline
Summary of computational transaction \tabularnewline
Raw Input & view raw input (R code)  \tabularnewline
Raw Output & view raw output of R engine  \tabularnewline
Computing time & 1 seconds \tabularnewline
R Server & 'Gwilym Jenkins' @ 72.249.127.135 \tabularnewline
\hline
\end{tabular}
%Source: https://freestatistics.org/blog/index.php?pk=41560&T=0

[TABLE]
[ROW][C]Summary of computational transaction[/C][/ROW]
[ROW][C]Raw Input[/C][C]view raw input (R code) [/C][/ROW]
[ROW][C]Raw Output[/C][C]view raw output of R engine [/C][/ROW]
[ROW][C]Computing time[/C][C]1 seconds[/C][/ROW]
[ROW][C]R Server[/C][C]'Gwilym Jenkins' @ 72.249.127.135[/C][/ROW]
[/TABLE]
Source: https://freestatistics.org/blog/index.php?pk=41560&T=0

Globally Unique Identifier (entire table): ba.freestatistics.org/blog/index.php?pk=41560&T=0

As an alternative you can also use a QR Code:  

The GUIDs for individual cells are displayed in the table below:

Summary of computational transaction
Raw Inputview raw input (R code)
Raw Outputview raw output of R engine
Computing time1 seconds
R Server'Gwilym Jenkins' @ 72.249.127.135


Standard Deviation-Mean Plot
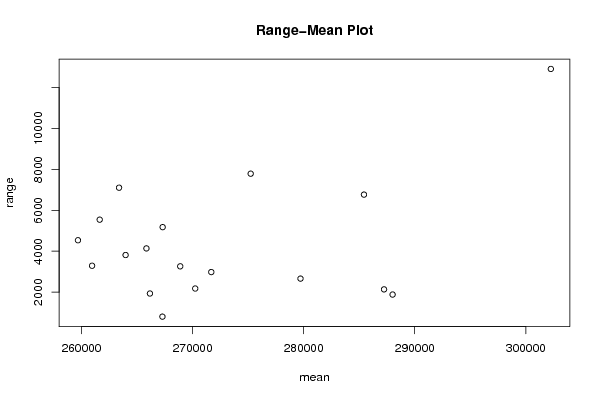
SectionMeanStandard DeviationRange
12596811918.060478712814538
2261638.752773.042537839385543
32609521468.726659389013291
4263970.51610.278754336243815
5266161.25805.4954479490661934
6263380.52954.981951439527106
7265844.51844.399179498124139
82673082396.912875624255178
9267286388.249919510616803
102716841368.787784866602982
11268888.251516.007558248533263
12270238.51086.642075386372178
13275232.253377.760044269977791
14279715.51389.957673216472662
152854302896.74702611976768
16287237932.6782224683212136
17288008.75798.668631744941883
183022546041.5390975037712910

\begin{tabular}{lllllllll}
\hline
Standard Deviation-Mean Plot \tabularnewline
Section & Mean & Standard Deviation & Range \tabularnewline
1 & 259681 & 1918.06047871281 & 4538 \tabularnewline
2 & 261638.75 & 2773.04253783938 & 5543 \tabularnewline
3 & 260952 & 1468.72665938901 & 3291 \tabularnewline
4 & 263970.5 & 1610.27875433624 & 3815 \tabularnewline
5 & 266161.25 & 805.495447949066 & 1934 \tabularnewline
6 & 263380.5 & 2954.98195143952 & 7106 \tabularnewline
7 & 265844.5 & 1844.39917949812 & 4139 \tabularnewline
8 & 267308 & 2396.91287562425 & 5178 \tabularnewline
9 & 267286 & 388.249919510616 & 803 \tabularnewline
10 & 271684 & 1368.78778486660 & 2982 \tabularnewline
11 & 268888.25 & 1516.00755824853 & 3263 \tabularnewline
12 & 270238.5 & 1086.64207538637 & 2178 \tabularnewline
13 & 275232.25 & 3377.76004426997 & 7791 \tabularnewline
14 & 279715.5 & 1389.95767321647 & 2662 \tabularnewline
15 & 285430 & 2896.7470261197 & 6768 \tabularnewline
16 & 287237 & 932.678222468321 & 2136 \tabularnewline
17 & 288008.75 & 798.66863174494 & 1883 \tabularnewline
18 & 302254 & 6041.53909750377 & 12910 \tabularnewline
\hline
\end{tabular}
%Source: https://freestatistics.org/blog/index.php?pk=41560&T=1

[TABLE]
[ROW][C]Standard Deviation-Mean Plot[/C][/ROW]
[ROW][C]Section[/C][C]Mean[/C][C]Standard Deviation[/C][C]Range[/C][/ROW]
[ROW][C]1[/C][C]259681[/C][C]1918.06047871281[/C][C]4538[/C][/ROW]
[ROW][C]2[/C][C]261638.75[/C][C]2773.04253783938[/C][C]5543[/C][/ROW]
[ROW][C]3[/C][C]260952[/C][C]1468.72665938901[/C][C]3291[/C][/ROW]
[ROW][C]4[/C][C]263970.5[/C][C]1610.27875433624[/C][C]3815[/C][/ROW]
[ROW][C]5[/C][C]266161.25[/C][C]805.495447949066[/C][C]1934[/C][/ROW]
[ROW][C]6[/C][C]263380.5[/C][C]2954.98195143952[/C][C]7106[/C][/ROW]
[ROW][C]7[/C][C]265844.5[/C][C]1844.39917949812[/C][C]4139[/C][/ROW]
[ROW][C]8[/C][C]267308[/C][C]2396.91287562425[/C][C]5178[/C][/ROW]
[ROW][C]9[/C][C]267286[/C][C]388.249919510616[/C][C]803[/C][/ROW]
[ROW][C]10[/C][C]271684[/C][C]1368.78778486660[/C][C]2982[/C][/ROW]
[ROW][C]11[/C][C]268888.25[/C][C]1516.00755824853[/C][C]3263[/C][/ROW]
[ROW][C]12[/C][C]270238.5[/C][C]1086.64207538637[/C][C]2178[/C][/ROW]
[ROW][C]13[/C][C]275232.25[/C][C]3377.76004426997[/C][C]7791[/C][/ROW]
[ROW][C]14[/C][C]279715.5[/C][C]1389.95767321647[/C][C]2662[/C][/ROW]
[ROW][C]15[/C][C]285430[/C][C]2896.7470261197[/C][C]6768[/C][/ROW]
[ROW][C]16[/C][C]287237[/C][C]932.678222468321[/C][C]2136[/C][/ROW]
[ROW][C]17[/C][C]288008.75[/C][C]798.66863174494[/C][C]1883[/C][/ROW]
[ROW][C]18[/C][C]302254[/C][C]6041.53909750377[/C][C]12910[/C][/ROW]
[/TABLE]
Source: https://freestatistics.org/blog/index.php?pk=41560&T=1

Globally Unique Identifier (entire table): ba.freestatistics.org/blog/index.php?pk=41560&T=1

As an alternative you can also use a QR Code:  

The GUIDs for individual cells are displayed in the table below:

Standard Deviation-Mean Plot
SectionMeanStandard DeviationRange
12596811918.060478712814538
2261638.752773.042537839385543
32609521468.726659389013291
4263970.51610.278754336243815
5266161.25805.4954479490661934
6263380.52954.981951439527106
7265844.51844.399179498124139
82673082396.912875624255178
9267286388.249919510616803
102716841368.787784866602982
11268888.251516.007558248533263
12270238.51086.642075386372178
13275232.253377.760044269977791
14279715.51389.957673216472662
152854302896.74702611976768
16287237932.6782224683212136
17288008.75798.668631744941883
183022546041.5390975037712910


Regression: S.E.(k) = alpha + beta * Mean(k)
alpha-11007.8885652506
beta0.0476483552922209
S.D.0.0257490321410035
T-STAT1.85049111870673
p-value0.082795846626763

\begin{tabular}{lllllllll}
\hline
Regression: S.E.(k) = alpha + beta * Mean(k) \tabularnewline
alpha & -11007.8885652506 \tabularnewline
beta & 0.0476483552922209 \tabularnewline
S.D. & 0.0257490321410035 \tabularnewline
T-STAT & 1.85049111870673 \tabularnewline
p-value & 0.082795846626763 \tabularnewline
\hline
\end{tabular}
%Source: https://freestatistics.org/blog/index.php?pk=41560&T=2

[TABLE]
[ROW][C]Regression: S.E.(k) = alpha + beta * Mean(k)[/C][/ROW]
[ROW][C]alpha[/C][C]-11007.8885652506[/C][/ROW]
[ROW][C]beta[/C][C]0.0476483552922209[/C][/ROW]
[ROW][C]S.D.[/C][C]0.0257490321410035[/C][/ROW]
[ROW][C]T-STAT[/C][C]1.85049111870673[/C][/ROW]
[ROW][C]p-value[/C][C]0.082795846626763[/C][/ROW]
[/TABLE]
Source: https://freestatistics.org/blog/index.php?pk=41560&T=2

Globally Unique Identifier (entire table): ba.freestatistics.org/blog/index.php?pk=41560&T=2

As an alternative you can also use a QR Code:  

The GUIDs for individual cells are displayed in the table below:

Regression: S.E.(k) = alpha + beta * Mean(k)
alpha-11007.8885652506
beta0.0476483552922209
S.D.0.0257490321410035
T-STAT1.85049111870673
p-value0.082795846626763


Regression: ln S.E.(k) = alpha + beta * ln Mean(k)
alpha-30.7961499913621
beta3.05217028374576
S.D.3.76728559352645
T-STAT0.810177568961186
p-value0.429724024880117
Lambda-2.05217028374576

\begin{tabular}{lllllllll}
\hline
Regression: ln S.E.(k) = alpha + beta * ln Mean(k) \tabularnewline
alpha & -30.7961499913621 \tabularnewline
beta & 3.05217028374576 \tabularnewline
S.D. & 3.76728559352645 \tabularnewline
T-STAT & 0.810177568961186 \tabularnewline
p-value & 0.429724024880117 \tabularnewline
Lambda & -2.05217028374576 \tabularnewline
\hline
\end{tabular}
%Source: https://freestatistics.org/blog/index.php?pk=41560&T=3

[TABLE]
[ROW][C]Regression: ln S.E.(k) = alpha + beta * ln Mean(k)[/C][/ROW]
[ROW][C]alpha[/C][C]-30.7961499913621[/C][/ROW]
[ROW][C]beta[/C][C]3.05217028374576[/C][/ROW]
[ROW][C]S.D.[/C][C]3.76728559352645[/C][/ROW]
[ROW][C]T-STAT[/C][C]0.810177568961186[/C][/ROW]
[ROW][C]p-value[/C][C]0.429724024880117[/C][/ROW]
[ROW][C]Lambda[/C][C]-2.05217028374576[/C][/ROW]
[/TABLE]
Source: https://freestatistics.org/blog/index.php?pk=41560&T=3

Globally Unique Identifier (entire table): ba.freestatistics.org/blog/index.php?pk=41560&T=3

As an alternative you can also use a QR Code:  

The GUIDs for individual cells are displayed in the table below:

Regression: ln S.E.(k) = alpha + beta * ln Mean(k)
alpha-30.7961499913621
beta3.05217028374576
S.D.3.76728559352645
T-STAT0.810177568961186
p-value0.429724024880117
Lambda-2.05217028374576


Parameters (Session):
par1 = 4 ;
Parameters (R input):
par1 = 4 ;
R code (references can be found in the software module):
par1 <- as.numeric(par1)
(n <- length(x))
(np <- floor(n / par1))
arr <- array(NA,dim=c(par1,np))
j <- 0
k <- 1
for (i in 1:(np*par1))
{
j = j + 1
arr[j,k] <- x[i]
if (j == par1) {
j = 0
k=k+1
}
}
arr
arr.mean <- array(NA,dim=np)
arr.sd <- array(NA,dim=np)
arr.range <- array(NA,dim=np)
for (j in 1:np)
{
arr.mean[j] <- mean(arr[,j],na.rm=TRUE)
arr.sd[j] <- sd(arr[,j],na.rm=TRUE)
arr.range[j] <- max(arr[,j],na.rm=TRUE) - min(arr[,j],na.rm=TRUE)
}
arr.mean
arr.sd
arr.range
(lm1 <- lm(arr.sd~arr.mean))
(lnlm1 <- lm(log(arr.sd)~log(arr.mean)))
(lm2 <- lm(arr.range~arr.mean))
bitmap(file='test1.png')
plot(arr.mean,arr.sd,main='Standard Deviation-Mean Plot',xlab='mean',ylab='standard deviation')
dev.off()
bitmap(file='test2.png')
plot(arr.mean,arr.range,main='Range-Mean Plot',xlab='mean',ylab='range')
dev.off()
load(file='createtable')
a<-table.start()
a<-table.row.start(a)
a<-table.element(a,'Standard Deviation-Mean Plot',4,TRUE)
a<-table.row.end(a)
a<-table.row.start(a)
a<-table.element(a,'Section',header=TRUE)
a<-table.element(a,'Mean',header=TRUE)
a<-table.element(a,'Standard Deviation',header=TRUE)
a<-table.element(a,'Range',header=TRUE)
a<-table.row.end(a)
for (j in 1:np) {
a<-table.row.start(a)
a<-table.element(a,j,header=TRUE)
a<-table.element(a,arr.mean[j])
a<-table.element(a,arr.sd[j] )
a<-table.element(a,arr.range[j] )
a<-table.row.end(a)
}
a<-table.end(a)
table.save(a,file='mytable.tab')
a<-table.start()
a<-table.row.start(a)
a<-table.element(a,'Regression: S.E.(k) = alpha + beta * Mean(k)',2,TRUE)
a<-table.row.end(a)
a<-table.row.start(a)
a<-table.element(a,'alpha',header=TRUE)
a<-table.element(a,lm1$coefficients[[1]])
a<-table.row.end(a)
a<-table.row.start(a)
a<-table.element(a,'beta',header=TRUE)
a<-table.element(a,lm1$coefficients[[2]])
a<-table.row.end(a)
a<-table.row.start(a)
a<-table.element(a,'S.D.',header=TRUE)
a<-table.element(a,summary(lm1)$coefficients[2,2])
a<-table.row.end(a)
a<-table.row.start(a)
a<-table.element(a,'T-STAT',header=TRUE)
a<-table.element(a,summary(lm1)$coefficients[2,3])
a<-table.row.end(a)
a<-table.row.start(a)
a<-table.element(a,'p-value',header=TRUE)
a<-table.element(a,summary(lm1)$coefficients[2,4])
a<-table.row.end(a)
a<-table.end(a)
table.save(a,file='mytable1.tab')
a<-table.start()
a<-table.row.start(a)
a<-table.element(a,'Regression: ln S.E.(k) = alpha + beta * ln Mean(k)',2,TRUE)
a<-table.row.end(a)
a<-table.row.start(a)
a<-table.element(a,'alpha',header=TRUE)
a<-table.element(a,lnlm1$coefficients[[1]])
a<-table.row.end(a)
a<-table.row.start(a)
a<-table.element(a,'beta',header=TRUE)
a<-table.element(a,lnlm1$coefficients[[2]])
a<-table.row.end(a)
a<-table.row.start(a)
a<-table.element(a,'S.D.',header=TRUE)
a<-table.element(a,summary(lnlm1)$coefficients[2,2])
a<-table.row.end(a)
a<-table.row.start(a)
a<-table.element(a,'T-STAT',header=TRUE)
a<-table.element(a,summary(lnlm1)$coefficients[2,3])
a<-table.row.end(a)
a<-table.row.start(a)
a<-table.element(a,'p-value',header=TRUE)
a<-table.element(a,summary(lnlm1)$coefficients[2,4])
a<-table.row.end(a)
a<-table.row.start(a)
a<-table.element(a,'Lambda',header=TRUE)
a<-table.element(a,1-lnlm1$coefficients[[2]])
a<-table.row.end(a)
a<-table.end(a)
table.save(a,file='mytable2.tab')