Free Statistics

of Irreproducible Research!

Author's title

Author*Unverified author*
R Software Modulerwasp_exponentialsmoothing.wasp
Title produced by softwareExponential Smoothing
Date of computationThu, 04 Jun 2009 03:28:15 -0600
Cite this page as followsStatistical Computations at FreeStatistics.org, Office for Research Development and Education, URL https://freestatistics.org/blog/index.php?v=date/2009/Jun/04/t1244107742d6bwi13p4diyz13.htm/, Retrieved Tue, 14 May 2024 03:40:52 +0000
Statistical Computations at FreeStatistics.org, Office for Research Development and Education, URL https://freestatistics.org/blog/index.php?pk=41558, Retrieved Tue, 14 May 2024 03:40:52 +0000
QR Codes:

Original text written by user:
IsPrivate?No (this computation is public)
User-defined keywords
Estimated Impact155
Family? (F = Feedback message, R = changed R code, M = changed R Module, P = changed Parameters, D = changed Data)
-       [Exponential Smoothing] [TRIPLE MULTIPLICA...] [2009-06-04 09:28:15] [cec0b6ecf0cab4e1552eba4b21b592a6] [Current]
Feedback Forum

Post a new message
Dataseries X:
509
501
507
569
580
578
565
547
555
562
561
555
544
537
543
594
611
613
611
594
595
591
589
584
573
567
569
621
629
628
612
595
597
593
590
580
574
573
573
620
626
620
588
566
557
561
549
532
526
511
499
555
565
542
527
510
514
517
508
493
490
469
478
528
534
518
506
502
516
528
533
536


Summary of computational transaction
Raw Inputview raw input (R code)
Raw Outputview raw output of R engine
Computing time2 seconds
R Server'George Udny Yule' @ 72.249.76.132

\begin{tabular}{lllllllll}
\hline
Summary of computational transaction \tabularnewline
Raw Input & view raw input (R code)  \tabularnewline
Raw Output & view raw output of R engine  \tabularnewline
Computing time & 2 seconds \tabularnewline
R Server & 'George Udny Yule' @ 72.249.76.132 \tabularnewline
\hline
\end{tabular}
%Source: https://freestatistics.org/blog/index.php?pk=41558&T=0

[TABLE]
[ROW][C]Summary of computational transaction[/C][/ROW]
[ROW][C]Raw Input[/C][C]view raw input (R code) [/C][/ROW]
[ROW][C]Raw Output[/C][C]view raw output of R engine [/C][/ROW]
[ROW][C]Computing time[/C][C]2 seconds[/C][/ROW]
[ROW][C]R Server[/C][C]'George Udny Yule' @ 72.249.76.132[/C][/ROW]
[/TABLE]
Source: https://freestatistics.org/blog/index.php?pk=41558&T=0

Globally Unique Identifier (entire table): ba.freestatistics.org/blog/index.php?pk=41558&T=0

As an alternative you can also use a QR Code:  

The GUIDs for individual cells are displayed in the table below:

Summary of computational transaction
Raw Inputview raw input (R code)
Raw Outputview raw output of R engine
Computing time2 seconds
R Server'George Udny Yule' @ 72.249.76.132


Estimated Parameters of Exponential Smoothing
ParameterValue
alpha0.925280347580736
beta0.165816466300062
gamma1

\begin{tabular}{lllllllll}
\hline
Estimated Parameters of Exponential Smoothing \tabularnewline
Parameter & Value \tabularnewline
alpha & 0.925280347580736 \tabularnewline
beta & 0.165816466300062 \tabularnewline
gamma & 1 \tabularnewline
\hline
\end{tabular}
%Source: https://freestatistics.org/blog/index.php?pk=41558&T=1

[TABLE]
[ROW][C]Estimated Parameters of Exponential Smoothing[/C][/ROW]
[ROW][C]Parameter[/C][C]Value[/C][/ROW]
[ROW][C]alpha[/C][C]0.925280347580736[/C][/ROW]
[ROW][C]beta[/C][C]0.165816466300062[/C][/ROW]
[ROW][C]gamma[/C][C]1[/C][/ROW]
[/TABLE]
Source: https://freestatistics.org/blog/index.php?pk=41558&T=1

Globally Unique Identifier (entire table): ba.freestatistics.org/blog/index.php?pk=41558&T=1

As an alternative you can also use a QR Code:  

The GUIDs for individual cells are displayed in the table below:

Estimated Parameters of Exponential Smoothing
ParameterValue
alpha0.925280347580736
beta0.165816466300062
gamma1


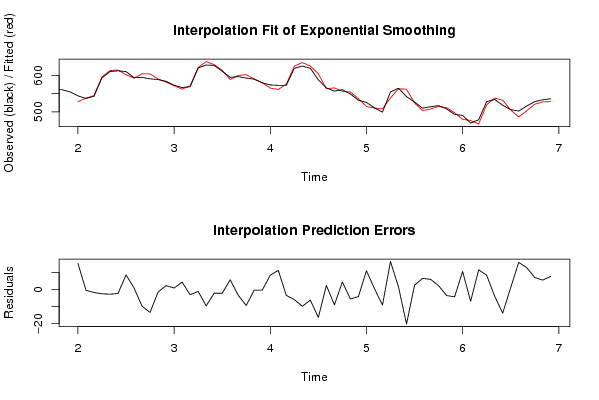
Interpolation Forecasts of Exponential Smoothing
tObservedFittedResiduals
13544528.44288374403715.5571162559626
14537537.378698514021-0.378698514021266
15543544.731804700173-1.73180470017314
16594596.476649925471-2.47664992547072
17611613.719625312852-2.71962531285180
18613615.31410933032-2.31410933032021
19611602.2447739099278.75522609007328
20594593.0329886217610.967011378239022
21595604.853693582238-9.8536935822376
22591604.515635463498-13.5156354634979
23589590.423307994928-1.42330799492834
24584581.6429644666032.35703553339715
25573572.0593075403460.940692459653974
26567562.5818867117234.41811328827657
27569572.063750596237-3.06375059623747
28621622.06367893834-1.06367893834022
29629638.634970946013-9.63497094601337
30628630.167367714709-2.16736771470903
31612614.128093997443-2.12809399744322
32595589.1765565509215.82344344907892
33597600.343446850948-3.34344685094777
34593602.391054742139-9.3910547421391
35590590.287693049705-0.287693049705467
36580580.31821521348-0.318215213480357
37574565.3999881887648.6000118112363
38573561.62245729932511.3775427006746
39573576.430545340811-3.43054534081125
40620625.934080279697-5.93408027969667
41626635.870713426092-9.87071342609158
42620626.23959092589-6.23959092588962
43588604.532171809272-16.5321718092722
44566563.5557709183192.44422908168121
45557566.036993300667-9.0369933006674
46561556.4976854148454.50231458515543
47549554.58604374114-5.58604374113975
48532536.124309648753-4.12430964875284
49526514.74577078804311.2542292119573
50511510.4578287163420.542171283657808
51499508.173718923415-9.17371892341492
52555538.35983866017816.6401613398219
53565563.4073668996151.59263310038455
54542562.416032968823-20.4160329688227
55527524.401729274112.5982707258903
56510503.3718088903596.6281911096413
57514507.9150413426896.084958657311
58517514.6822871206472.31771287935328
59508511.532567059128-3.53256705912838
60493497.31029623578-4.3102962357799
61490479.24892908231510.7510709176845
62469475.970869776737-6.97086977673683
63478466.2870533842711.71294661573
64528519.4985219977468.50147800225363
65534537.940389677992-3.94038967799202
66518531.978838335852-13.9788383358521
67506504.823312851591.17668714841028
68502485.87999747213316.1200025278666
69516502.9769898036113.0230101963904
70528520.8559117890697.14408821093105
71533527.3509739827465.64902601725419
72536528.1721381243127.82786187568786

\begin{tabular}{lllllllll}
\hline
Interpolation Forecasts of Exponential Smoothing \tabularnewline
t & Observed & Fitted & Residuals \tabularnewline
13 & 544 & 528.442883744037 & 15.5571162559626 \tabularnewline
14 & 537 & 537.378698514021 & -0.378698514021266 \tabularnewline
15 & 543 & 544.731804700173 & -1.73180470017314 \tabularnewline
16 & 594 & 596.476649925471 & -2.47664992547072 \tabularnewline
17 & 611 & 613.719625312852 & -2.71962531285180 \tabularnewline
18 & 613 & 615.31410933032 & -2.31410933032021 \tabularnewline
19 & 611 & 602.244773909927 & 8.75522609007328 \tabularnewline
20 & 594 & 593.032988621761 & 0.967011378239022 \tabularnewline
21 & 595 & 604.853693582238 & -9.8536935822376 \tabularnewline
22 & 591 & 604.515635463498 & -13.5156354634979 \tabularnewline
23 & 589 & 590.423307994928 & -1.42330799492834 \tabularnewline
24 & 584 & 581.642964466603 & 2.35703553339715 \tabularnewline
25 & 573 & 572.059307540346 & 0.940692459653974 \tabularnewline
26 & 567 & 562.581886711723 & 4.41811328827657 \tabularnewline
27 & 569 & 572.063750596237 & -3.06375059623747 \tabularnewline
28 & 621 & 622.06367893834 & -1.06367893834022 \tabularnewline
29 & 629 & 638.634970946013 & -9.63497094601337 \tabularnewline
30 & 628 & 630.167367714709 & -2.16736771470903 \tabularnewline
31 & 612 & 614.128093997443 & -2.12809399744322 \tabularnewline
32 & 595 & 589.176556550921 & 5.82344344907892 \tabularnewline
33 & 597 & 600.343446850948 & -3.34344685094777 \tabularnewline
34 & 593 & 602.391054742139 & -9.3910547421391 \tabularnewline
35 & 590 & 590.287693049705 & -0.287693049705467 \tabularnewline
36 & 580 & 580.31821521348 & -0.318215213480357 \tabularnewline
37 & 574 & 565.399988188764 & 8.6000118112363 \tabularnewline
38 & 573 & 561.622457299325 & 11.3775427006746 \tabularnewline
39 & 573 & 576.430545340811 & -3.43054534081125 \tabularnewline
40 & 620 & 625.934080279697 & -5.93408027969667 \tabularnewline
41 & 626 & 635.870713426092 & -9.87071342609158 \tabularnewline
42 & 620 & 626.23959092589 & -6.23959092588962 \tabularnewline
43 & 588 & 604.532171809272 & -16.5321718092722 \tabularnewline
44 & 566 & 563.555770918319 & 2.44422908168121 \tabularnewline
45 & 557 & 566.036993300667 & -9.0369933006674 \tabularnewline
46 & 561 & 556.497685414845 & 4.50231458515543 \tabularnewline
47 & 549 & 554.58604374114 & -5.58604374113975 \tabularnewline
48 & 532 & 536.124309648753 & -4.12430964875284 \tabularnewline
49 & 526 & 514.745770788043 & 11.2542292119573 \tabularnewline
50 & 511 & 510.457828716342 & 0.542171283657808 \tabularnewline
51 & 499 & 508.173718923415 & -9.17371892341492 \tabularnewline
52 & 555 & 538.359838660178 & 16.6401613398219 \tabularnewline
53 & 565 & 563.407366899615 & 1.59263310038455 \tabularnewline
54 & 542 & 562.416032968823 & -20.4160329688227 \tabularnewline
55 & 527 & 524.40172927411 & 2.5982707258903 \tabularnewline
56 & 510 & 503.371808890359 & 6.6281911096413 \tabularnewline
57 & 514 & 507.915041342689 & 6.084958657311 \tabularnewline
58 & 517 & 514.682287120647 & 2.31771287935328 \tabularnewline
59 & 508 & 511.532567059128 & -3.53256705912838 \tabularnewline
60 & 493 & 497.31029623578 & -4.3102962357799 \tabularnewline
61 & 490 & 479.248929082315 & 10.7510709176845 \tabularnewline
62 & 469 & 475.970869776737 & -6.97086977673683 \tabularnewline
63 & 478 & 466.28705338427 & 11.71294661573 \tabularnewline
64 & 528 & 519.498521997746 & 8.50147800225363 \tabularnewline
65 & 534 & 537.940389677992 & -3.94038967799202 \tabularnewline
66 & 518 & 531.978838335852 & -13.9788383358521 \tabularnewline
67 & 506 & 504.82331285159 & 1.17668714841028 \tabularnewline
68 & 502 & 485.879997472133 & 16.1200025278666 \tabularnewline
69 & 516 & 502.97698980361 & 13.0230101963904 \tabularnewline
70 & 528 & 520.855911789069 & 7.14408821093105 \tabularnewline
71 & 533 & 527.350973982746 & 5.64902601725419 \tabularnewline
72 & 536 & 528.172138124312 & 7.82786187568786 \tabularnewline
\hline
\end{tabular}
%Source: https://freestatistics.org/blog/index.php?pk=41558&T=2

[TABLE]
[ROW][C]Interpolation Forecasts of Exponential Smoothing[/C][/ROW]
[ROW][C]t[/C][C]Observed[/C][C]Fitted[/C][C]Residuals[/C][/ROW]
[ROW][C]13[/C][C]544[/C][C]528.442883744037[/C][C]15.5571162559626[/C][/ROW]
[ROW][C]14[/C][C]537[/C][C]537.378698514021[/C][C]-0.378698514021266[/C][/ROW]
[ROW][C]15[/C][C]543[/C][C]544.731804700173[/C][C]-1.73180470017314[/C][/ROW]
[ROW][C]16[/C][C]594[/C][C]596.476649925471[/C][C]-2.47664992547072[/C][/ROW]
[ROW][C]17[/C][C]611[/C][C]613.719625312852[/C][C]-2.71962531285180[/C][/ROW]
[ROW][C]18[/C][C]613[/C][C]615.31410933032[/C][C]-2.31410933032021[/C][/ROW]
[ROW][C]19[/C][C]611[/C][C]602.244773909927[/C][C]8.75522609007328[/C][/ROW]
[ROW][C]20[/C][C]594[/C][C]593.032988621761[/C][C]0.967011378239022[/C][/ROW]
[ROW][C]21[/C][C]595[/C][C]604.853693582238[/C][C]-9.8536935822376[/C][/ROW]
[ROW][C]22[/C][C]591[/C][C]604.515635463498[/C][C]-13.5156354634979[/C][/ROW]
[ROW][C]23[/C][C]589[/C][C]590.423307994928[/C][C]-1.42330799492834[/C][/ROW]
[ROW][C]24[/C][C]584[/C][C]581.642964466603[/C][C]2.35703553339715[/C][/ROW]
[ROW][C]25[/C][C]573[/C][C]572.059307540346[/C][C]0.940692459653974[/C][/ROW]
[ROW][C]26[/C][C]567[/C][C]562.581886711723[/C][C]4.41811328827657[/C][/ROW]
[ROW][C]27[/C][C]569[/C][C]572.063750596237[/C][C]-3.06375059623747[/C][/ROW]
[ROW][C]28[/C][C]621[/C][C]622.06367893834[/C][C]-1.06367893834022[/C][/ROW]
[ROW][C]29[/C][C]629[/C][C]638.634970946013[/C][C]-9.63497094601337[/C][/ROW]
[ROW][C]30[/C][C]628[/C][C]630.167367714709[/C][C]-2.16736771470903[/C][/ROW]
[ROW][C]31[/C][C]612[/C][C]614.128093997443[/C][C]-2.12809399744322[/C][/ROW]
[ROW][C]32[/C][C]595[/C][C]589.176556550921[/C][C]5.82344344907892[/C][/ROW]
[ROW][C]33[/C][C]597[/C][C]600.343446850948[/C][C]-3.34344685094777[/C][/ROW]
[ROW][C]34[/C][C]593[/C][C]602.391054742139[/C][C]-9.3910547421391[/C][/ROW]
[ROW][C]35[/C][C]590[/C][C]590.287693049705[/C][C]-0.287693049705467[/C][/ROW]
[ROW][C]36[/C][C]580[/C][C]580.31821521348[/C][C]-0.318215213480357[/C][/ROW]
[ROW][C]37[/C][C]574[/C][C]565.399988188764[/C][C]8.6000118112363[/C][/ROW]
[ROW][C]38[/C][C]573[/C][C]561.622457299325[/C][C]11.3775427006746[/C][/ROW]
[ROW][C]39[/C][C]573[/C][C]576.430545340811[/C][C]-3.43054534081125[/C][/ROW]
[ROW][C]40[/C][C]620[/C][C]625.934080279697[/C][C]-5.93408027969667[/C][/ROW]
[ROW][C]41[/C][C]626[/C][C]635.870713426092[/C][C]-9.87071342609158[/C][/ROW]
[ROW][C]42[/C][C]620[/C][C]626.23959092589[/C][C]-6.23959092588962[/C][/ROW]
[ROW][C]43[/C][C]588[/C][C]604.532171809272[/C][C]-16.5321718092722[/C][/ROW]
[ROW][C]44[/C][C]566[/C][C]563.555770918319[/C][C]2.44422908168121[/C][/ROW]
[ROW][C]45[/C][C]557[/C][C]566.036993300667[/C][C]-9.0369933006674[/C][/ROW]
[ROW][C]46[/C][C]561[/C][C]556.497685414845[/C][C]4.50231458515543[/C][/ROW]
[ROW][C]47[/C][C]549[/C][C]554.58604374114[/C][C]-5.58604374113975[/C][/ROW]
[ROW][C]48[/C][C]532[/C][C]536.124309648753[/C][C]-4.12430964875284[/C][/ROW]
[ROW][C]49[/C][C]526[/C][C]514.745770788043[/C][C]11.2542292119573[/C][/ROW]
[ROW][C]50[/C][C]511[/C][C]510.457828716342[/C][C]0.542171283657808[/C][/ROW]
[ROW][C]51[/C][C]499[/C][C]508.173718923415[/C][C]-9.17371892341492[/C][/ROW]
[ROW][C]52[/C][C]555[/C][C]538.359838660178[/C][C]16.6401613398219[/C][/ROW]
[ROW][C]53[/C][C]565[/C][C]563.407366899615[/C][C]1.59263310038455[/C][/ROW]
[ROW][C]54[/C][C]542[/C][C]562.416032968823[/C][C]-20.4160329688227[/C][/ROW]
[ROW][C]55[/C][C]527[/C][C]524.40172927411[/C][C]2.5982707258903[/C][/ROW]
[ROW][C]56[/C][C]510[/C][C]503.371808890359[/C][C]6.6281911096413[/C][/ROW]
[ROW][C]57[/C][C]514[/C][C]507.915041342689[/C][C]6.084958657311[/C][/ROW]
[ROW][C]58[/C][C]517[/C][C]514.682287120647[/C][C]2.31771287935328[/C][/ROW]
[ROW][C]59[/C][C]508[/C][C]511.532567059128[/C][C]-3.53256705912838[/C][/ROW]
[ROW][C]60[/C][C]493[/C][C]497.31029623578[/C][C]-4.3102962357799[/C][/ROW]
[ROW][C]61[/C][C]490[/C][C]479.248929082315[/C][C]10.7510709176845[/C][/ROW]
[ROW][C]62[/C][C]469[/C][C]475.970869776737[/C][C]-6.97086977673683[/C][/ROW]
[ROW][C]63[/C][C]478[/C][C]466.28705338427[/C][C]11.71294661573[/C][/ROW]
[ROW][C]64[/C][C]528[/C][C]519.498521997746[/C][C]8.50147800225363[/C][/ROW]
[ROW][C]65[/C][C]534[/C][C]537.940389677992[/C][C]-3.94038967799202[/C][/ROW]
[ROW][C]66[/C][C]518[/C][C]531.978838335852[/C][C]-13.9788383358521[/C][/ROW]
[ROW][C]67[/C][C]506[/C][C]504.82331285159[/C][C]1.17668714841028[/C][/ROW]
[ROW][C]68[/C][C]502[/C][C]485.879997472133[/C][C]16.1200025278666[/C][/ROW]
[ROW][C]69[/C][C]516[/C][C]502.97698980361[/C][C]13.0230101963904[/C][/ROW]
[ROW][C]70[/C][C]528[/C][C]520.855911789069[/C][C]7.14408821093105[/C][/ROW]
[ROW][C]71[/C][C]533[/C][C]527.350973982746[/C][C]5.64902601725419[/C][/ROW]
[ROW][C]72[/C][C]536[/C][C]528.172138124312[/C][C]7.82786187568786[/C][/ROW]
[/TABLE]
Source: https://freestatistics.org/blog/index.php?pk=41558&T=2

Globally Unique Identifier (entire table): ba.freestatistics.org/blog/index.php?pk=41558&T=2

As an alternative you can also use a QR Code:  

The GUIDs for individual cells are displayed in the table below:

Interpolation Forecasts of Exponential Smoothing
tObservedFittedResiduals
13544528.44288374403715.5571162559626
14537537.378698514021-0.378698514021266
15543544.731804700173-1.73180470017314
16594596.476649925471-2.47664992547072
17611613.719625312852-2.71962531285180
18613615.31410933032-2.31410933032021
19611602.2447739099278.75522609007328
20594593.0329886217610.967011378239022
21595604.853693582238-9.8536935822376
22591604.515635463498-13.5156354634979
23589590.423307994928-1.42330799492834
24584581.6429644666032.35703553339715
25573572.0593075403460.940692459653974
26567562.5818867117234.41811328827657
27569572.063750596237-3.06375059623747
28621622.06367893834-1.06367893834022
29629638.634970946013-9.63497094601337
30628630.167367714709-2.16736771470903
31612614.128093997443-2.12809399744322
32595589.1765565509215.82344344907892
33597600.343446850948-3.34344685094777
34593602.391054742139-9.3910547421391
35590590.287693049705-0.287693049705467
36580580.31821521348-0.318215213480357
37574565.3999881887648.6000118112363
38573561.62245729932511.3775427006746
39573576.430545340811-3.43054534081125
40620625.934080279697-5.93408027969667
41626635.870713426092-9.87071342609158
42620626.23959092589-6.23959092588962
43588604.532171809272-16.5321718092722
44566563.5557709183192.44422908168121
45557566.036993300667-9.0369933006674
46561556.4976854148454.50231458515543
47549554.58604374114-5.58604374113975
48532536.124309648753-4.12430964875284
49526514.74577078804311.2542292119573
50511510.4578287163420.542171283657808
51499508.173718923415-9.17371892341492
52555538.35983866017816.6401613398219
53565563.4073668996151.59263310038455
54542562.416032968823-20.4160329688227
55527524.401729274112.5982707258903
56510503.3718088903596.6281911096413
57514507.9150413426896.084958657311
58517514.6822871206472.31771287935328
59508511.532567059128-3.53256705912838
60493497.31029623578-4.3102962357799
61490479.24892908231510.7510709176845
62469475.970869776737-6.97086977673683
63478466.2870533842711.71294661573
64528519.4985219977468.50147800225363
65534537.940389677992-3.94038967799202
66518531.978838335852-13.9788383358521
67506504.823312851591.17668714841028
68502485.87999747213316.1200025278666
69516502.9769898036113.0230101963904
70528520.8559117890697.14408821093105
71533527.3509739827465.64902601725419
72536528.1721381243127.82786187568786


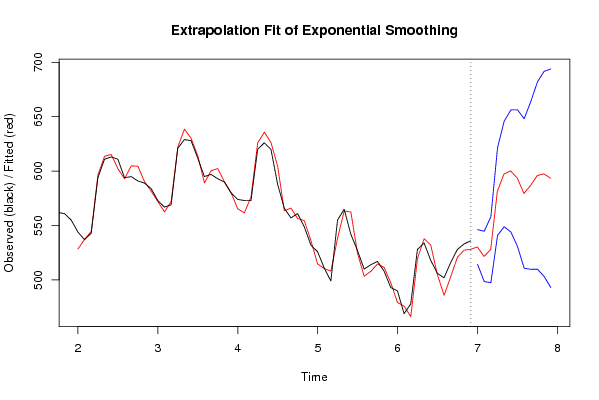
Extrapolation Forecasts of Exponential Smoothing
tForecast95% Lower Bound95% Upper Bound
73530.356264275624514.416922606288546.29560594496
74521.636905178924498.505713150667544.768097207181
75527.889913899619497.549901767127558.22992603211
76581.293210889454540.982524363375621.603897415533
77597.45282110578548.89343870434646.012203507222
78600.194587239946544.143972408241656.24520207165
79593.58051043906530.791429856036656.369591022085
80579.465535528515510.779989602941648.151081454088
81586.91584592234509.778690078375664.053001766305
82596.002932010828509.887647349099682.118216672558
83597.472547730085503.212183858289691.732911601881
84593.475860075264493.03054314667693.921177003858

\begin{tabular}{lllllllll}
\hline
Extrapolation Forecasts of Exponential Smoothing \tabularnewline
t & Forecast & 95% Lower Bound & 95% Upper Bound \tabularnewline
73 & 530.356264275624 & 514.416922606288 & 546.29560594496 \tabularnewline
74 & 521.636905178924 & 498.505713150667 & 544.768097207181 \tabularnewline
75 & 527.889913899619 & 497.549901767127 & 558.22992603211 \tabularnewline
76 & 581.293210889454 & 540.982524363375 & 621.603897415533 \tabularnewline
77 & 597.45282110578 & 548.89343870434 & 646.012203507222 \tabularnewline
78 & 600.194587239946 & 544.143972408241 & 656.24520207165 \tabularnewline
79 & 593.58051043906 & 530.791429856036 & 656.369591022085 \tabularnewline
80 & 579.465535528515 & 510.779989602941 & 648.151081454088 \tabularnewline
81 & 586.91584592234 & 509.778690078375 & 664.053001766305 \tabularnewline
82 & 596.002932010828 & 509.887647349099 & 682.118216672558 \tabularnewline
83 & 597.472547730085 & 503.212183858289 & 691.732911601881 \tabularnewline
84 & 593.475860075264 & 493.03054314667 & 693.921177003858 \tabularnewline
\hline
\end{tabular}
%Source: https://freestatistics.org/blog/index.php?pk=41558&T=3

[TABLE]
[ROW][C]Extrapolation Forecasts of Exponential Smoothing[/C][/ROW]
[ROW][C]t[/C][C]Forecast[/C][C]95% Lower Bound[/C][C]95% Upper Bound[/C][/ROW]
[ROW][C]73[/C][C]530.356264275624[/C][C]514.416922606288[/C][C]546.29560594496[/C][/ROW]
[ROW][C]74[/C][C]521.636905178924[/C][C]498.505713150667[/C][C]544.768097207181[/C][/ROW]
[ROW][C]75[/C][C]527.889913899619[/C][C]497.549901767127[/C][C]558.22992603211[/C][/ROW]
[ROW][C]76[/C][C]581.293210889454[/C][C]540.982524363375[/C][C]621.603897415533[/C][/ROW]
[ROW][C]77[/C][C]597.45282110578[/C][C]548.89343870434[/C][C]646.012203507222[/C][/ROW]
[ROW][C]78[/C][C]600.194587239946[/C][C]544.143972408241[/C][C]656.24520207165[/C][/ROW]
[ROW][C]79[/C][C]593.58051043906[/C][C]530.791429856036[/C][C]656.369591022085[/C][/ROW]
[ROW][C]80[/C][C]579.465535528515[/C][C]510.779989602941[/C][C]648.151081454088[/C][/ROW]
[ROW][C]81[/C][C]586.91584592234[/C][C]509.778690078375[/C][C]664.053001766305[/C][/ROW]
[ROW][C]82[/C][C]596.002932010828[/C][C]509.887647349099[/C][C]682.118216672558[/C][/ROW]
[ROW][C]83[/C][C]597.472547730085[/C][C]503.212183858289[/C][C]691.732911601881[/C][/ROW]
[ROW][C]84[/C][C]593.475860075264[/C][C]493.03054314667[/C][C]693.921177003858[/C][/ROW]
[/TABLE]
Source: https://freestatistics.org/blog/index.php?pk=41558&T=3

Globally Unique Identifier (entire table): ba.freestatistics.org/blog/index.php?pk=41558&T=3

As an alternative you can also use a QR Code:  

The GUIDs for individual cells are displayed in the table below:

Extrapolation Forecasts of Exponential Smoothing
tForecast95% Lower Bound95% Upper Bound
73530.356264275624514.416922606288546.29560594496
74521.636905178924498.505713150667544.768097207181
75527.889913899619497.549901767127558.22992603211
76581.293210889454540.982524363375621.603897415533
77597.45282110578548.89343870434646.012203507222
78600.194587239946544.143972408241656.24520207165
79593.58051043906530.791429856036656.369591022085
80579.465535528515510.779989602941648.151081454088
81586.91584592234509.778690078375664.053001766305
82596.002932010828509.887647349099682.118216672558
83597.472547730085503.212183858289691.732911601881
84593.475860075264493.03054314667693.921177003858


Parameters (Session):
par1 = 12 ; par2 = Triple ; par3 = multiplicative ;
Parameters (R input):
par1 = 12 ; par2 = Triple ; par3 = multiplicative ;
R code (references can be found in the software module):
par1 <- as.numeric(par1)
if (par2 == 'Single') K <- 1
if (par2 == 'Double') K <- 2
if (par2 == 'Triple') K <- par1
nx <- length(x)
nxmK <- nx - K
x <- ts(x, frequency = par1)
if (par2 == 'Single') fit <- HoltWinters(x, gamma=0, beta=0)
if (par2 == 'Double') fit <- HoltWinters(x, gamma=0)
if (par2 == 'Triple') fit <- HoltWinters(x, seasonal=par3)
fit
myresid <- x - fit$fitted[,'xhat']
bitmap(file='test1.png')
op <- par(mfrow=c(2,1))
plot(fit,ylab='Observed (black) / Fitted (red)',main='Interpolation Fit of Exponential Smoothing')
plot(myresid,ylab='Residuals',main='Interpolation Prediction Errors')
par(op)
dev.off()
bitmap(file='test2.png')
p <- predict(fit, par1, prediction.interval=TRUE)
np <- length(p[,1])
plot(fit,p,ylab='Observed (black) / Fitted (red)',main='Extrapolation Fit of Exponential Smoothing')
dev.off()
bitmap(file='test3.png')
op <- par(mfrow = c(2,2))
acf(as.numeric(myresid),lag.max = nx/2,main='Residual ACF')
spectrum(myresid,main='Residals Periodogram')
cpgram(myresid,main='Residal Cumulative Periodogram')
qqnorm(myresid,main='Residual Normal QQ Plot')
qqline(myresid)
par(op)
dev.off()
load(file='createtable')
a<-table.start()
a<-table.row.start(a)
a<-table.element(a,'Estimated Parameters of Exponential Smoothing',2,TRUE)
a<-table.row.end(a)
a<-table.row.start(a)
a<-table.element(a,'Parameter',header=TRUE)
a<-table.element(a,'Value',header=TRUE)
a<-table.row.end(a)
a<-table.row.start(a)
a<-table.element(a,'alpha',header=TRUE)
a<-table.element(a,fit$alpha)
a<-table.row.end(a)
a<-table.row.start(a)
a<-table.element(a,'beta',header=TRUE)
a<-table.element(a,fit$beta)
a<-table.row.end(a)
a<-table.row.start(a)
a<-table.element(a,'gamma',header=TRUE)
a<-table.element(a,fit$gamma)
a<-table.row.end(a)
a<-table.end(a)
table.save(a,file='mytable.tab')
a<-table.start()
a<-table.row.start(a)
a<-table.element(a,'Interpolation Forecasts of Exponential Smoothing',4,TRUE)
a<-table.row.end(a)
a<-table.row.start(a)
a<-table.element(a,'t',header=TRUE)
a<-table.element(a,'Observed',header=TRUE)
a<-table.element(a,'Fitted',header=TRUE)
a<-table.element(a,'Residuals',header=TRUE)
a<-table.row.end(a)
for (i in 1:nxmK) {
a<-table.row.start(a)
a<-table.element(a,i+K,header=TRUE)
a<-table.element(a,x[i+K])
a<-table.element(a,fit$fitted[i,'xhat'])
a<-table.element(a,myresid[i])
a<-table.row.end(a)
}
a<-table.end(a)
table.save(a,file='mytable1.tab')
a<-table.start()
a<-table.row.start(a)
a<-table.element(a,'Extrapolation Forecasts of Exponential Smoothing',4,TRUE)
a<-table.row.end(a)
a<-table.row.start(a)
a<-table.element(a,'t',header=TRUE)
a<-table.element(a,'Forecast',header=TRUE)
a<-table.element(a,'95% Lower Bound',header=TRUE)
a<-table.element(a,'95% Upper Bound',header=TRUE)
a<-table.row.end(a)
for (i in 1:np) {
a<-table.row.start(a)
a<-table.element(a,nx+i,header=TRUE)
a<-table.element(a,p[i,'fit'])
a<-table.element(a,p[i,'lwr'])
a<-table.element(a,p[i,'upr'])
a<-table.row.end(a)
}
a<-table.end(a)
table.save(a,file='mytable2.tab')