Free Statistics

of Irreproducible Research!

Author's title

Author*Unverified author*
R Software Modulerwasp_autocorrelation.wasp
Title produced by software(Partial) Autocorrelation Function
Date of computationThu, 04 Jun 2009 02:07:30 -0600
Cite this page as followsStatistical Computations at FreeStatistics.org, Office for Research Development and Education, URL https://freestatistics.org/blog/index.php?v=date/2009/Jun/04/t1244102959aj71wiw0jdjblon.htm/, Retrieved Mon, 13 May 2024 21:17:51 +0000
Statistical Computations at FreeStatistics.org, Office for Research Development and Education, URL https://freestatistics.org/blog/index.php?pk=41532, Retrieved Mon, 13 May 2024 21:17:51 +0000
QR Codes:

Original text written by user:
IsPrivate?No (this computation is public)
User-defined keywords
Estimated Impact138
Family? (F = Feedback message, R = changed R code, M = changed R Module, P = changed Parameters, D = changed Data)
-       [(Partial) Autocorrelation Function] [autocorrelation n...] [2009-06-04 08:07:30] [822aa141fddc67f18188afbe1dd38d3f] [Current]
Feedback Forum

Post a new message
Dataseries X:
233084
233898
231355
232662
230037
231814
246796
247891
248291
245766
238776
242541
246861
246843
246947
241679
240085
241514
250525
250567
252145
251877
245817
248269
246310
246733
245028
240022
238614
238096
248530
248381
247567
241783
235000
237384
238020
236412
232279
230408
230254
229217
239658
239906
236558
223566
216054
214685
216086
211692
204681
203075
198401
191246
206750
209611
199573
195635
190062
193134
194795
190835
185045
184425
177293
180549
195344
196597
189102
185749
185145
192243
197356


Summary of computational transaction
Raw Inputview raw input (R code)
Raw Outputview raw output of R engine
Computing time1 seconds
R Server'Gwilym Jenkins' @ 72.249.127.135

\begin{tabular}{lllllllll}
\hline
Summary of computational transaction \tabularnewline
Raw Input & view raw input (R code)  \tabularnewline
Raw Output & view raw output of R engine  \tabularnewline
Computing time & 1 seconds \tabularnewline
R Server & 'Gwilym Jenkins' @ 72.249.127.135 \tabularnewline
\hline
\end{tabular}
%Source: https://freestatistics.org/blog/index.php?pk=41532&T=0

[TABLE]
[ROW][C]Summary of computational transaction[/C][/ROW]
[ROW][C]Raw Input[/C][C]view raw input (R code) [/C][/ROW]
[ROW][C]Raw Output[/C][C]view raw output of R engine [/C][/ROW]
[ROW][C]Computing time[/C][C]1 seconds[/C][/ROW]
[ROW][C]R Server[/C][C]'Gwilym Jenkins' @ 72.249.127.135[/C][/ROW]
[/TABLE]
Source: https://freestatistics.org/blog/index.php?pk=41532&T=0

Globally Unique Identifier (entire table): ba.freestatistics.org/blog/index.php?pk=41532&T=0

As an alternative you can also use a QR Code:  

The GUIDs for individual cells are displayed in the table below:

Summary of computational transaction
Raw Inputview raw input (R code)
Raw Outputview raw output of R engine
Computing time1 seconds
R Server'Gwilym Jenkins' @ 72.249.127.135


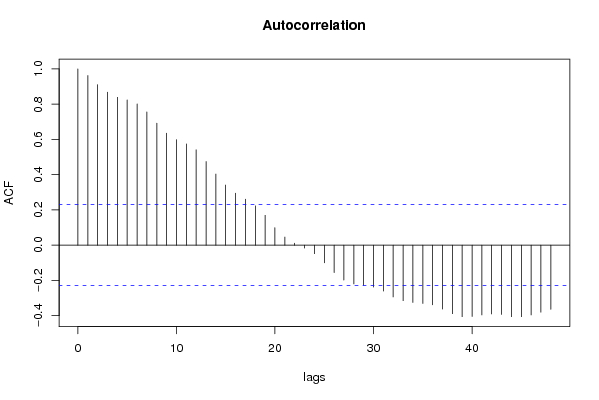
Autocorrelation Function
Time lag kACF(k)T-STATP-value
10.9622358.22130
20.9110027.78360
30.8684117.41970
40.8397.16840
50.8240217.04040
60.8015656.84860
70.7560956.46010
80.692015.91250
90.6351875.4270
100.5984765.11341e-06
110.5743844.90753e-06
120.540954.62198e-06
130.4743134.05256.3e-05
140.4036333.44860.00047
150.3412242.91540.002357
160.2951822.5220.006924
170.2606292.22680.014522
180.2229191.90460.030384
190.1695831.44890.075822
200.0990790.84650.200012
210.0461570.39440.347231
220.0113650.09710.461455
23-0.016561-0.14150.443932
24-0.048779-0.41680.339035
25-0.100493-0.85860.196683
26-0.155677-1.33010.093812
27-0.197874-1.69060.047586
28-0.220423-1.88330.031822
29-0.226995-1.93940.028156
30-0.238009-2.03350.022816
31-0.260488-2.22560.014564
32-0.294259-2.51410.007068
33-0.315157-2.69270.004393
34-0.324816-2.77520.003501
35-0.330773-2.82610.003037
36-0.338959-2.89610.002491
37-0.362634-3.09830.001381
38-0.389246-3.32570.000691
39-0.405741-3.46660.000443
40-0.404908-3.45950.000454
41-0.396084-3.38410.000576
42-0.390536-3.33670.000668
43-0.393432-3.36150.000618
44-0.405813-3.46730.000443
45-0.405721-3.46650.000444
46-0.396062-3.3840.000576
47-0.380672-3.25250.000867
48-0.364226-3.1120.001326

\begin{tabular}{lllllllll}
\hline
Autocorrelation Function \tabularnewline
Time lag k & ACF(k) & T-STAT & P-value \tabularnewline
1 & 0.962235 & 8.2213 & 0 \tabularnewline
2 & 0.911002 & 7.7836 & 0 \tabularnewline
3 & 0.868411 & 7.4197 & 0 \tabularnewline
4 & 0.839 & 7.1684 & 0 \tabularnewline
5 & 0.824021 & 7.0404 & 0 \tabularnewline
6 & 0.801565 & 6.8486 & 0 \tabularnewline
7 & 0.756095 & 6.4601 & 0 \tabularnewline
8 & 0.69201 & 5.9125 & 0 \tabularnewline
9 & 0.635187 & 5.427 & 0 \tabularnewline
10 & 0.598476 & 5.1134 & 1e-06 \tabularnewline
11 & 0.574384 & 4.9075 & 3e-06 \tabularnewline
12 & 0.54095 & 4.6219 & 8e-06 \tabularnewline
13 & 0.474313 & 4.0525 & 6.3e-05 \tabularnewline
14 & 0.403633 & 3.4486 & 0.00047 \tabularnewline
15 & 0.341224 & 2.9154 & 0.002357 \tabularnewline
16 & 0.295182 & 2.522 & 0.006924 \tabularnewline
17 & 0.260629 & 2.2268 & 0.014522 \tabularnewline
18 & 0.222919 & 1.9046 & 0.030384 \tabularnewline
19 & 0.169583 & 1.4489 & 0.075822 \tabularnewline
20 & 0.099079 & 0.8465 & 0.200012 \tabularnewline
21 & 0.046157 & 0.3944 & 0.347231 \tabularnewline
22 & 0.011365 & 0.0971 & 0.461455 \tabularnewline
23 & -0.016561 & -0.1415 & 0.443932 \tabularnewline
24 & -0.048779 & -0.4168 & 0.339035 \tabularnewline
25 & -0.100493 & -0.8586 & 0.196683 \tabularnewline
26 & -0.155677 & -1.3301 & 0.093812 \tabularnewline
27 & -0.197874 & -1.6906 & 0.047586 \tabularnewline
28 & -0.220423 & -1.8833 & 0.031822 \tabularnewline
29 & -0.226995 & -1.9394 & 0.028156 \tabularnewline
30 & -0.238009 & -2.0335 & 0.022816 \tabularnewline
31 & -0.260488 & -2.2256 & 0.014564 \tabularnewline
32 & -0.294259 & -2.5141 & 0.007068 \tabularnewline
33 & -0.315157 & -2.6927 & 0.004393 \tabularnewline
34 & -0.324816 & -2.7752 & 0.003501 \tabularnewline
35 & -0.330773 & -2.8261 & 0.003037 \tabularnewline
36 & -0.338959 & -2.8961 & 0.002491 \tabularnewline
37 & -0.362634 & -3.0983 & 0.001381 \tabularnewline
38 & -0.389246 & -3.3257 & 0.000691 \tabularnewline
39 & -0.405741 & -3.4666 & 0.000443 \tabularnewline
40 & -0.404908 & -3.4595 & 0.000454 \tabularnewline
41 & -0.396084 & -3.3841 & 0.000576 \tabularnewline
42 & -0.390536 & -3.3367 & 0.000668 \tabularnewline
43 & -0.393432 & -3.3615 & 0.000618 \tabularnewline
44 & -0.405813 & -3.4673 & 0.000443 \tabularnewline
45 & -0.405721 & -3.4665 & 0.000444 \tabularnewline
46 & -0.396062 & -3.384 & 0.000576 \tabularnewline
47 & -0.380672 & -3.2525 & 0.000867 \tabularnewline
48 & -0.364226 & -3.112 & 0.001326 \tabularnewline
\hline
\end{tabular}
%Source: https://freestatistics.org/blog/index.php?pk=41532&T=1

[TABLE]
[ROW][C]Autocorrelation Function[/C][/ROW]
[ROW][C]Time lag k[/C][C]ACF(k)[/C][C]T-STAT[/C][C]P-value[/C][/ROW]
[ROW][C]1[/C][C]0.962235[/C][C]8.2213[/C][C]0[/C][/ROW]
[ROW][C]2[/C][C]0.911002[/C][C]7.7836[/C][C]0[/C][/ROW]
[ROW][C]3[/C][C]0.868411[/C][C]7.4197[/C][C]0[/C][/ROW]
[ROW][C]4[/C][C]0.839[/C][C]7.1684[/C][C]0[/C][/ROW]
[ROW][C]5[/C][C]0.824021[/C][C]7.0404[/C][C]0[/C][/ROW]
[ROW][C]6[/C][C]0.801565[/C][C]6.8486[/C][C]0[/C][/ROW]
[ROW][C]7[/C][C]0.756095[/C][C]6.4601[/C][C]0[/C][/ROW]
[ROW][C]8[/C][C]0.69201[/C][C]5.9125[/C][C]0[/C][/ROW]
[ROW][C]9[/C][C]0.635187[/C][C]5.427[/C][C]0[/C][/ROW]
[ROW][C]10[/C][C]0.598476[/C][C]5.1134[/C][C]1e-06[/C][/ROW]
[ROW][C]11[/C][C]0.574384[/C][C]4.9075[/C][C]3e-06[/C][/ROW]
[ROW][C]12[/C][C]0.54095[/C][C]4.6219[/C][C]8e-06[/C][/ROW]
[ROW][C]13[/C][C]0.474313[/C][C]4.0525[/C][C]6.3e-05[/C][/ROW]
[ROW][C]14[/C][C]0.403633[/C][C]3.4486[/C][C]0.00047[/C][/ROW]
[ROW][C]15[/C][C]0.341224[/C][C]2.9154[/C][C]0.002357[/C][/ROW]
[ROW][C]16[/C][C]0.295182[/C][C]2.522[/C][C]0.006924[/C][/ROW]
[ROW][C]17[/C][C]0.260629[/C][C]2.2268[/C][C]0.014522[/C][/ROW]
[ROW][C]18[/C][C]0.222919[/C][C]1.9046[/C][C]0.030384[/C][/ROW]
[ROW][C]19[/C][C]0.169583[/C][C]1.4489[/C][C]0.075822[/C][/ROW]
[ROW][C]20[/C][C]0.099079[/C][C]0.8465[/C][C]0.200012[/C][/ROW]
[ROW][C]21[/C][C]0.046157[/C][C]0.3944[/C][C]0.347231[/C][/ROW]
[ROW][C]22[/C][C]0.011365[/C][C]0.0971[/C][C]0.461455[/C][/ROW]
[ROW][C]23[/C][C]-0.016561[/C][C]-0.1415[/C][C]0.443932[/C][/ROW]
[ROW][C]24[/C][C]-0.048779[/C][C]-0.4168[/C][C]0.339035[/C][/ROW]
[ROW][C]25[/C][C]-0.100493[/C][C]-0.8586[/C][C]0.196683[/C][/ROW]
[ROW][C]26[/C][C]-0.155677[/C][C]-1.3301[/C][C]0.093812[/C][/ROW]
[ROW][C]27[/C][C]-0.197874[/C][C]-1.6906[/C][C]0.047586[/C][/ROW]
[ROW][C]28[/C][C]-0.220423[/C][C]-1.8833[/C][C]0.031822[/C][/ROW]
[ROW][C]29[/C][C]-0.226995[/C][C]-1.9394[/C][C]0.028156[/C][/ROW]
[ROW][C]30[/C][C]-0.238009[/C][C]-2.0335[/C][C]0.022816[/C][/ROW]
[ROW][C]31[/C][C]-0.260488[/C][C]-2.2256[/C][C]0.014564[/C][/ROW]
[ROW][C]32[/C][C]-0.294259[/C][C]-2.5141[/C][C]0.007068[/C][/ROW]
[ROW][C]33[/C][C]-0.315157[/C][C]-2.6927[/C][C]0.004393[/C][/ROW]
[ROW][C]34[/C][C]-0.324816[/C][C]-2.7752[/C][C]0.003501[/C][/ROW]
[ROW][C]35[/C][C]-0.330773[/C][C]-2.8261[/C][C]0.003037[/C][/ROW]
[ROW][C]36[/C][C]-0.338959[/C][C]-2.8961[/C][C]0.002491[/C][/ROW]
[ROW][C]37[/C][C]-0.362634[/C][C]-3.0983[/C][C]0.001381[/C][/ROW]
[ROW][C]38[/C][C]-0.389246[/C][C]-3.3257[/C][C]0.000691[/C][/ROW]
[ROW][C]39[/C][C]-0.405741[/C][C]-3.4666[/C][C]0.000443[/C][/ROW]
[ROW][C]40[/C][C]-0.404908[/C][C]-3.4595[/C][C]0.000454[/C][/ROW]
[ROW][C]41[/C][C]-0.396084[/C][C]-3.3841[/C][C]0.000576[/C][/ROW]
[ROW][C]42[/C][C]-0.390536[/C][C]-3.3367[/C][C]0.000668[/C][/ROW]
[ROW][C]43[/C][C]-0.393432[/C][C]-3.3615[/C][C]0.000618[/C][/ROW]
[ROW][C]44[/C][C]-0.405813[/C][C]-3.4673[/C][C]0.000443[/C][/ROW]
[ROW][C]45[/C][C]-0.405721[/C][C]-3.4665[/C][C]0.000444[/C][/ROW]
[ROW][C]46[/C][C]-0.396062[/C][C]-3.384[/C][C]0.000576[/C][/ROW]
[ROW][C]47[/C][C]-0.380672[/C][C]-3.2525[/C][C]0.000867[/C][/ROW]
[ROW][C]48[/C][C]-0.364226[/C][C]-3.112[/C][C]0.001326[/C][/ROW]
[/TABLE]
Source: https://freestatistics.org/blog/index.php?pk=41532&T=1

Globally Unique Identifier (entire table): ba.freestatistics.org/blog/index.php?pk=41532&T=1

As an alternative you can also use a QR Code:  

The GUIDs for individual cells are displayed in the table below:

Autocorrelation Function
Time lag kACF(k)T-STATP-value
10.9622358.22130
20.9110027.78360
30.8684117.41970
40.8397.16840
50.8240217.04040
60.8015656.84860
70.7560956.46010
80.692015.91250
90.6351875.4270
100.5984765.11341e-06
110.5743844.90753e-06
120.540954.62198e-06
130.4743134.05256.3e-05
140.4036333.44860.00047
150.3412242.91540.002357
160.2951822.5220.006924
170.2606292.22680.014522
180.2229191.90460.030384
190.1695831.44890.075822
200.0990790.84650.200012
210.0461570.39440.347231
220.0113650.09710.461455
23-0.016561-0.14150.443932
24-0.048779-0.41680.339035
25-0.100493-0.85860.196683
26-0.155677-1.33010.093812
27-0.197874-1.69060.047586
28-0.220423-1.88330.031822
29-0.226995-1.93940.028156
30-0.238009-2.03350.022816
31-0.260488-2.22560.014564
32-0.294259-2.51410.007068
33-0.315157-2.69270.004393
34-0.324816-2.77520.003501
35-0.330773-2.82610.003037
36-0.338959-2.89610.002491
37-0.362634-3.09830.001381
38-0.389246-3.32570.000691
39-0.405741-3.46660.000443
40-0.404908-3.45950.000454
41-0.396084-3.38410.000576
42-0.390536-3.33670.000668
43-0.393432-3.36150.000618
44-0.405813-3.46730.000443
45-0.405721-3.46650.000444
46-0.396062-3.3840.000576
47-0.380672-3.25250.000867
48-0.364226-3.1120.001326


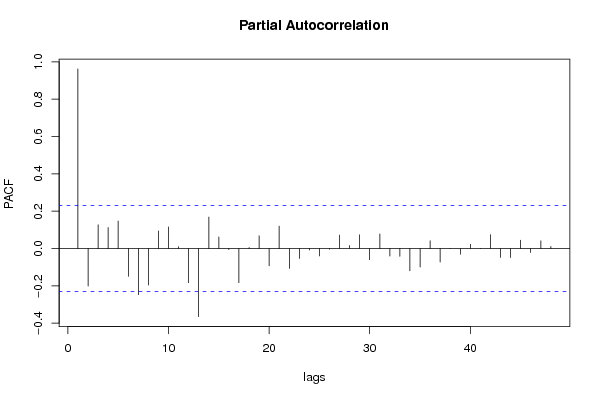
Partial Autocorrelation Function
Time lag kPACF(k)T-STATP-value
10.9622358.22130
2-0.200984-1.71720.045091
30.1269221.08440.140874
40.1125640.96180.169675
50.146811.25430.106859
6-0.148932-1.27250.103621
7-0.247207-2.11210.019048
8-0.195954-1.67420.049182
90.0939670.80290.212333
100.1154710.98660.163553
110.0100960.08630.465748
12-0.182917-1.56280.061207
13-0.365159-3.11990.001295
140.1685171.43980.077097
150.0620580.53020.298784
16-0.005697-0.04870.480657
17-0.182868-1.56240.061256
180.0048930.04180.483385
190.0682190.58290.280889
20-0.092663-0.79170.215546
210.1199771.02510.154354
22-0.106509-0.910.182906
23-0.053877-0.46030.323326
24-0.008146-0.06960.472352
25-0.039773-0.33980.367484
26-0.003797-0.03240.487106
270.0717530.61310.27087
280.016370.13990.444575
290.0735610.62850.265817
30-0.060828-0.51970.302418
310.0780630.6670.253446
32-0.040623-0.34710.364765
33-0.041952-0.35840.360525
34-0.11952-1.02120.155271
35-0.099119-0.84690.199918
360.0415520.3550.361798
37-0.07264-0.62060.268387
380.0005270.00450.498211
39-0.030422-0.25990.397825
400.0233640.19960.421166
41-0.00113-0.00970.496162
420.0741280.63340.264242
43-0.048002-0.41010.341458
44-0.048623-0.41540.339521
450.0448790.38340.351251
46-0.021841-0.18660.426243
470.041020.35050.363494
480.0111440.09520.462204

\begin{tabular}{lllllllll}
\hline
Partial Autocorrelation Function \tabularnewline
Time lag k & PACF(k) & T-STAT & P-value \tabularnewline
1 & 0.962235 & 8.2213 & 0 \tabularnewline
2 & -0.200984 & -1.7172 & 0.045091 \tabularnewline
3 & 0.126922 & 1.0844 & 0.140874 \tabularnewline
4 & 0.112564 & 0.9618 & 0.169675 \tabularnewline
5 & 0.14681 & 1.2543 & 0.106859 \tabularnewline
6 & -0.148932 & -1.2725 & 0.103621 \tabularnewline
7 & -0.247207 & -2.1121 & 0.019048 \tabularnewline
8 & -0.195954 & -1.6742 & 0.049182 \tabularnewline
9 & 0.093967 & 0.8029 & 0.212333 \tabularnewline
10 & 0.115471 & 0.9866 & 0.163553 \tabularnewline
11 & 0.010096 & 0.0863 & 0.465748 \tabularnewline
12 & -0.182917 & -1.5628 & 0.061207 \tabularnewline
13 & -0.365159 & -3.1199 & 0.001295 \tabularnewline
14 & 0.168517 & 1.4398 & 0.077097 \tabularnewline
15 & 0.062058 & 0.5302 & 0.298784 \tabularnewline
16 & -0.005697 & -0.0487 & 0.480657 \tabularnewline
17 & -0.182868 & -1.5624 & 0.061256 \tabularnewline
18 & 0.004893 & 0.0418 & 0.483385 \tabularnewline
19 & 0.068219 & 0.5829 & 0.280889 \tabularnewline
20 & -0.092663 & -0.7917 & 0.215546 \tabularnewline
21 & 0.119977 & 1.0251 & 0.154354 \tabularnewline
22 & -0.106509 & -0.91 & 0.182906 \tabularnewline
23 & -0.053877 & -0.4603 & 0.323326 \tabularnewline
24 & -0.008146 & -0.0696 & 0.472352 \tabularnewline
25 & -0.039773 & -0.3398 & 0.367484 \tabularnewline
26 & -0.003797 & -0.0324 & 0.487106 \tabularnewline
27 & 0.071753 & 0.6131 & 0.27087 \tabularnewline
28 & 0.01637 & 0.1399 & 0.444575 \tabularnewline
29 & 0.073561 & 0.6285 & 0.265817 \tabularnewline
30 & -0.060828 & -0.5197 & 0.302418 \tabularnewline
31 & 0.078063 & 0.667 & 0.253446 \tabularnewline
32 & -0.040623 & -0.3471 & 0.364765 \tabularnewline
33 & -0.041952 & -0.3584 & 0.360525 \tabularnewline
34 & -0.11952 & -1.0212 & 0.155271 \tabularnewline
35 & -0.099119 & -0.8469 & 0.199918 \tabularnewline
36 & 0.041552 & 0.355 & 0.361798 \tabularnewline
37 & -0.07264 & -0.6206 & 0.268387 \tabularnewline
38 & 0.000527 & 0.0045 & 0.498211 \tabularnewline
39 & -0.030422 & -0.2599 & 0.397825 \tabularnewline
40 & 0.023364 & 0.1996 & 0.421166 \tabularnewline
41 & -0.00113 & -0.0097 & 0.496162 \tabularnewline
42 & 0.074128 & 0.6334 & 0.264242 \tabularnewline
43 & -0.048002 & -0.4101 & 0.341458 \tabularnewline
44 & -0.048623 & -0.4154 & 0.339521 \tabularnewline
45 & 0.044879 & 0.3834 & 0.351251 \tabularnewline
46 & -0.021841 & -0.1866 & 0.426243 \tabularnewline
47 & 0.04102 & 0.3505 & 0.363494 \tabularnewline
48 & 0.011144 & 0.0952 & 0.462204 \tabularnewline
\hline
\end{tabular}
%Source: https://freestatistics.org/blog/index.php?pk=41532&T=2

[TABLE]
[ROW][C]Partial Autocorrelation Function[/C][/ROW]
[ROW][C]Time lag k[/C][C]PACF(k)[/C][C]T-STAT[/C][C]P-value[/C][/ROW]
[ROW][C]1[/C][C]0.962235[/C][C]8.2213[/C][C]0[/C][/ROW]
[ROW][C]2[/C][C]-0.200984[/C][C]-1.7172[/C][C]0.045091[/C][/ROW]
[ROW][C]3[/C][C]0.126922[/C][C]1.0844[/C][C]0.140874[/C][/ROW]
[ROW][C]4[/C][C]0.112564[/C][C]0.9618[/C][C]0.169675[/C][/ROW]
[ROW][C]5[/C][C]0.14681[/C][C]1.2543[/C][C]0.106859[/C][/ROW]
[ROW][C]6[/C][C]-0.148932[/C][C]-1.2725[/C][C]0.103621[/C][/ROW]
[ROW][C]7[/C][C]-0.247207[/C][C]-2.1121[/C][C]0.019048[/C][/ROW]
[ROW][C]8[/C][C]-0.195954[/C][C]-1.6742[/C][C]0.049182[/C][/ROW]
[ROW][C]9[/C][C]0.093967[/C][C]0.8029[/C][C]0.212333[/C][/ROW]
[ROW][C]10[/C][C]0.115471[/C][C]0.9866[/C][C]0.163553[/C][/ROW]
[ROW][C]11[/C][C]0.010096[/C][C]0.0863[/C][C]0.465748[/C][/ROW]
[ROW][C]12[/C][C]-0.182917[/C][C]-1.5628[/C][C]0.061207[/C][/ROW]
[ROW][C]13[/C][C]-0.365159[/C][C]-3.1199[/C][C]0.001295[/C][/ROW]
[ROW][C]14[/C][C]0.168517[/C][C]1.4398[/C][C]0.077097[/C][/ROW]
[ROW][C]15[/C][C]0.062058[/C][C]0.5302[/C][C]0.298784[/C][/ROW]
[ROW][C]16[/C][C]-0.005697[/C][C]-0.0487[/C][C]0.480657[/C][/ROW]
[ROW][C]17[/C][C]-0.182868[/C][C]-1.5624[/C][C]0.061256[/C][/ROW]
[ROW][C]18[/C][C]0.004893[/C][C]0.0418[/C][C]0.483385[/C][/ROW]
[ROW][C]19[/C][C]0.068219[/C][C]0.5829[/C][C]0.280889[/C][/ROW]
[ROW][C]20[/C][C]-0.092663[/C][C]-0.7917[/C][C]0.215546[/C][/ROW]
[ROW][C]21[/C][C]0.119977[/C][C]1.0251[/C][C]0.154354[/C][/ROW]
[ROW][C]22[/C][C]-0.106509[/C][C]-0.91[/C][C]0.182906[/C][/ROW]
[ROW][C]23[/C][C]-0.053877[/C][C]-0.4603[/C][C]0.323326[/C][/ROW]
[ROW][C]24[/C][C]-0.008146[/C][C]-0.0696[/C][C]0.472352[/C][/ROW]
[ROW][C]25[/C][C]-0.039773[/C][C]-0.3398[/C][C]0.367484[/C][/ROW]
[ROW][C]26[/C][C]-0.003797[/C][C]-0.0324[/C][C]0.487106[/C][/ROW]
[ROW][C]27[/C][C]0.071753[/C][C]0.6131[/C][C]0.27087[/C][/ROW]
[ROW][C]28[/C][C]0.01637[/C][C]0.1399[/C][C]0.444575[/C][/ROW]
[ROW][C]29[/C][C]0.073561[/C][C]0.6285[/C][C]0.265817[/C][/ROW]
[ROW][C]30[/C][C]-0.060828[/C][C]-0.5197[/C][C]0.302418[/C][/ROW]
[ROW][C]31[/C][C]0.078063[/C][C]0.667[/C][C]0.253446[/C][/ROW]
[ROW][C]32[/C][C]-0.040623[/C][C]-0.3471[/C][C]0.364765[/C][/ROW]
[ROW][C]33[/C][C]-0.041952[/C][C]-0.3584[/C][C]0.360525[/C][/ROW]
[ROW][C]34[/C][C]-0.11952[/C][C]-1.0212[/C][C]0.155271[/C][/ROW]
[ROW][C]35[/C][C]-0.099119[/C][C]-0.8469[/C][C]0.199918[/C][/ROW]
[ROW][C]36[/C][C]0.041552[/C][C]0.355[/C][C]0.361798[/C][/ROW]
[ROW][C]37[/C][C]-0.07264[/C][C]-0.6206[/C][C]0.268387[/C][/ROW]
[ROW][C]38[/C][C]0.000527[/C][C]0.0045[/C][C]0.498211[/C][/ROW]
[ROW][C]39[/C][C]-0.030422[/C][C]-0.2599[/C][C]0.397825[/C][/ROW]
[ROW][C]40[/C][C]0.023364[/C][C]0.1996[/C][C]0.421166[/C][/ROW]
[ROW][C]41[/C][C]-0.00113[/C][C]-0.0097[/C][C]0.496162[/C][/ROW]
[ROW][C]42[/C][C]0.074128[/C][C]0.6334[/C][C]0.264242[/C][/ROW]
[ROW][C]43[/C][C]-0.048002[/C][C]-0.4101[/C][C]0.341458[/C][/ROW]
[ROW][C]44[/C][C]-0.048623[/C][C]-0.4154[/C][C]0.339521[/C][/ROW]
[ROW][C]45[/C][C]0.044879[/C][C]0.3834[/C][C]0.351251[/C][/ROW]
[ROW][C]46[/C][C]-0.021841[/C][C]-0.1866[/C][C]0.426243[/C][/ROW]
[ROW][C]47[/C][C]0.04102[/C][C]0.3505[/C][C]0.363494[/C][/ROW]
[ROW][C]48[/C][C]0.011144[/C][C]0.0952[/C][C]0.462204[/C][/ROW]
[/TABLE]
Source: https://freestatistics.org/blog/index.php?pk=41532&T=2

Globally Unique Identifier (entire table): ba.freestatistics.org/blog/index.php?pk=41532&T=2

As an alternative you can also use a QR Code:  

The GUIDs for individual cells are displayed in the table below:

Partial Autocorrelation Function
Time lag kPACF(k)T-STATP-value
10.9622358.22130
2-0.200984-1.71720.045091
30.1269221.08440.140874
40.1125640.96180.169675
50.146811.25430.106859
6-0.148932-1.27250.103621
7-0.247207-2.11210.019048
8-0.195954-1.67420.049182
90.0939670.80290.212333
100.1154710.98660.163553
110.0100960.08630.465748
12-0.182917-1.56280.061207
13-0.365159-3.11990.001295
140.1685171.43980.077097
150.0620580.53020.298784
16-0.005697-0.04870.480657
17-0.182868-1.56240.061256
180.0048930.04180.483385
190.0682190.58290.280889
20-0.092663-0.79170.215546
210.1199771.02510.154354
22-0.106509-0.910.182906
23-0.053877-0.46030.323326
24-0.008146-0.06960.472352
25-0.039773-0.33980.367484
26-0.003797-0.03240.487106
270.0717530.61310.27087
280.016370.13990.444575
290.0735610.62850.265817
30-0.060828-0.51970.302418
310.0780630.6670.253446
32-0.040623-0.34710.364765
33-0.041952-0.35840.360525
34-0.11952-1.02120.155271
35-0.099119-0.84690.199918
360.0415520.3550.361798
37-0.07264-0.62060.268387
380.0005270.00450.498211
39-0.030422-0.25990.397825
400.0233640.19960.421166
41-0.00113-0.00970.496162
420.0741280.63340.264242
43-0.048002-0.41010.341458
44-0.048623-0.41540.339521
450.0448790.38340.351251
46-0.021841-0.18660.426243
470.041020.35050.363494
480.0111440.09520.462204


Parameters (Session):
par1 = 48 ; par2 = 1 ; par3 = 0 ; par4 = 0 ; par5 = 12 ;
Parameters (R input):
par1 = 48 ; par2 = 1 ; par3 = 0 ; par4 = 0 ; par5 = 12 ;
R code (references can be found in the software module):
if (par1 == 'Default') {
par1 = 10*log10(length(x))
} else {
par1 <- as.numeric(par1)
}
par2 <- as.numeric(par2)
par3 <- as.numeric(par3)
par4 <- as.numeric(par4)
par5 <- as.numeric(par5)
if (par2 == 0) {
x <- log(x)
} else {
x <- (x ^ par2 - 1) / par2
}
if (par3 > 0) x <- diff(x,lag=1,difference=par3)
if (par4 > 0) x <- diff(x,lag=par5,difference=par4)
bitmap(file='pic1.png')
racf <- acf(x,par1,main='Autocorrelation',xlab='lags',ylab='ACF')
dev.off()
bitmap(file='pic2.png')
rpacf <- pacf(x,par1,main='Partial Autocorrelation',xlab='lags',ylab='PACF')
dev.off()
(myacf <- c(racf$acf))
(mypacf <- c(rpacf$acf))
lengthx <- length(x)
sqrtn <- sqrt(lengthx)
load(file='createtable')
a<-table.start()
a<-table.row.start(a)
a<-table.element(a,'Autocorrelation Function',4,TRUE)
a<-table.row.end(a)
a<-table.row.start(a)
a<-table.element(a,'Time lag k',header=TRUE)
a<-table.element(a,hyperlink('basics.htm','ACF(k)','click here for more information about the Autocorrelation Function'),header=TRUE)
a<-table.element(a,'T-STAT',header=TRUE)
a<-table.element(a,'P-value',header=TRUE)
a<-table.row.end(a)
for (i in 2:(par1+1)) {
a<-table.row.start(a)
a<-table.element(a,i-1,header=TRUE)
a<-table.element(a,round(myacf[i],6))
mytstat <- myacf[i]*sqrtn
a<-table.element(a,round(mytstat,4))
a<-table.element(a,round(1-pt(abs(mytstat),lengthx),6))
a<-table.row.end(a)
}
a<-table.end(a)
table.save(a,file='mytable.tab')
a<-table.start()
a<-table.row.start(a)
a<-table.element(a,'Partial Autocorrelation Function',4,TRUE)
a<-table.row.end(a)
a<-table.row.start(a)
a<-table.element(a,'Time lag k',header=TRUE)
a<-table.element(a,hyperlink('basics.htm','PACF(k)','click here for more information about the Partial Autocorrelation Function'),header=TRUE)
a<-table.element(a,'T-STAT',header=TRUE)
a<-table.element(a,'P-value',header=TRUE)
a<-table.row.end(a)
for (i in 1:par1) {
a<-table.row.start(a)
a<-table.element(a,i,header=TRUE)
a<-table.element(a,round(mypacf[i],6))
mytstat <- mypacf[i]*sqrtn
a<-table.element(a,round(mytstat,4))
a<-table.element(a,round(1-pt(abs(mytstat),lengthx),6))
a<-table.row.end(a)
}
a<-table.end(a)
table.save(a,file='mytable1.tab')