Free Statistics

of Irreproducible Research!

Author's title

Author*Unverified author*
R Software Modulerwasp_autocorrelation.wasp
Title produced by software(Partial) Autocorrelation Function
Date of computationThu, 04 Jun 2009 02:03:30 -0600
Cite this page as followsStatistical Computations at FreeStatistics.org, Office for Research Development and Education, URL https://freestatistics.org/blog/index.php?v=date/2009/Jun/04/t1244102692a3amagbolwz4lrg.htm/, Retrieved Tue, 14 May 2024 22:15:18 +0000
Statistical Computations at FreeStatistics.org, Office for Research Development and Education, URL https://freestatistics.org/blog/index.php?pk=41531, Retrieved Tue, 14 May 2024 22:15:18 +0000
QR Codes:

Original text written by user:
IsPrivate?No (this computation is public)
User-defined keywords
Estimated Impact132
Family? (F = Feedback message, R = changed R code, M = changed R Module, P = changed Parameters, D = changed Data)
-       [(Partial) Autocorrelation Function] [Autocorrelation2 ...] [2009-06-04 08:03:30] [822aa141fddc67f18188afbe1dd38d3f] [Current]
Feedback Forum

Post a new message
Dataseries X:
260288
261544
259886
257006
259670
258873
264416
263596
262586
260237
261690
259295
264170
264451
265538
261723
266189
265073
267007
266376
267406
262742
260300
263074
265940
264771
268403
264264
264118
266817
269296
269001
266707
267507
267510
267420
270845
270671
273653
271567
268372
268160
267879
271142
271323
269478
271008
269145
271684
273582
279475
276188
278422
281084
278618
280738
288897
282129
286406
284288
286139
288275
287670
286864
288798
288316
286915
288006
293338
303730
306248
305700
314849


Summary of computational transaction
Raw Inputview raw input (R code)
Raw Outputview raw output of R engine
Computing time2 seconds
R Server'Gwilym Jenkins' @ 72.249.127.135

\begin{tabular}{lllllllll}
\hline
Summary of computational transaction \tabularnewline
Raw Input & view raw input (R code)  \tabularnewline
Raw Output & view raw output of R engine  \tabularnewline
Computing time & 2 seconds \tabularnewline
R Server & 'Gwilym Jenkins' @ 72.249.127.135 \tabularnewline
\hline
\end{tabular}
%Source: https://freestatistics.org/blog/index.php?pk=41531&T=0

[TABLE]
[ROW][C]Summary of computational transaction[/C][/ROW]
[ROW][C]Raw Input[/C][C]view raw input (R code) [/C][/ROW]
[ROW][C]Raw Output[/C][C]view raw output of R engine [/C][/ROW]
[ROW][C]Computing time[/C][C]2 seconds[/C][/ROW]
[ROW][C]R Server[/C][C]'Gwilym Jenkins' @ 72.249.127.135[/C][/ROW]
[/TABLE]
Source: https://freestatistics.org/blog/index.php?pk=41531&T=0

Globally Unique Identifier (entire table): ba.freestatistics.org/blog/index.php?pk=41531&T=0

As an alternative you can also use a QR Code:  

The GUIDs for individual cells are displayed in the table below:

Summary of computational transaction
Raw Inputview raw input (R code)
Raw Outputview raw output of R engine
Computing time2 seconds
R Server'Gwilym Jenkins' @ 72.249.127.135


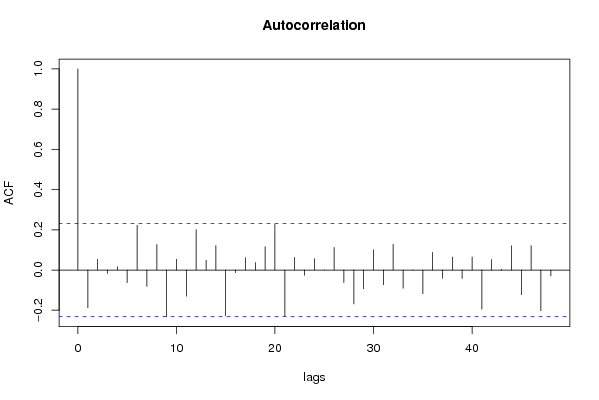
Autocorrelation Function
Time lag kACF(k)T-STATP-value
1-0.187577-1.59160.057923
20.0538330.45680.324598
3-0.017327-0.1470.441763
40.0156620.13290.447323
5-0.062736-0.53230.298067
60.2225341.88830.03151
7-0.081954-0.69540.24452
80.1264381.07290.143458
9-0.23203-1.96880.026411
100.0538120.45660.324662
11-0.130455-1.10690.136002
120.2007491.70340.046402
130.0482170.40910.341827
140.1215621.03150.152882
15-0.226889-1.92520.029076
16-0.012745-0.10810.457091
170.0611560.51890.302701
180.037130.31510.376816
190.1153710.9790.16544
200.2265681.92250.02925
21-0.230615-1.95680.027122
220.0624630.530.298865
23-0.026362-0.22370.411816
240.0564830.47930.316597
25-0.000395-0.00330.498669
260.1120030.95040.172551
27-0.062494-0.53030.298774
28-0.169121-1.4350.077803
29-0.093554-0.79380.214951
300.1003060.85110.198762
31-0.073317-0.62210.267916
320.127711.08370.141066
33-0.090529-0.76820.22245
34-0.002165-0.01840.492697
35-0.118548-1.00590.158913
360.0873420.74110.230516
37-0.041372-0.35110.363287
380.0646190.54830.292588
39-0.042276-0.35870.360427
400.0650040.55160.291473
41-0.195067-1.65520.051118
420.0524640.44520.328766
430.003420.0290.488465
440.1203211.0210.155347
45-0.123113-1.04460.149841
460.1210241.02690.153947
47-0.202473-1.7180.045043
48-0.029224-0.2480.402429

\begin{tabular}{lllllllll}
\hline
Autocorrelation Function \tabularnewline
Time lag k & ACF(k) & T-STAT & P-value \tabularnewline
1 & -0.187577 & -1.5916 & 0.057923 \tabularnewline
2 & 0.053833 & 0.4568 & 0.324598 \tabularnewline
3 & -0.017327 & -0.147 & 0.441763 \tabularnewline
4 & 0.015662 & 0.1329 & 0.447323 \tabularnewline
5 & -0.062736 & -0.5323 & 0.298067 \tabularnewline
6 & 0.222534 & 1.8883 & 0.03151 \tabularnewline
7 & -0.081954 & -0.6954 & 0.24452 \tabularnewline
8 & 0.126438 & 1.0729 & 0.143458 \tabularnewline
9 & -0.23203 & -1.9688 & 0.026411 \tabularnewline
10 & 0.053812 & 0.4566 & 0.324662 \tabularnewline
11 & -0.130455 & -1.1069 & 0.136002 \tabularnewline
12 & 0.200749 & 1.7034 & 0.046402 \tabularnewline
13 & 0.048217 & 0.4091 & 0.341827 \tabularnewline
14 & 0.121562 & 1.0315 & 0.152882 \tabularnewline
15 & -0.226889 & -1.9252 & 0.029076 \tabularnewline
16 & -0.012745 & -0.1081 & 0.457091 \tabularnewline
17 & 0.061156 & 0.5189 & 0.302701 \tabularnewline
18 & 0.03713 & 0.3151 & 0.376816 \tabularnewline
19 & 0.115371 & 0.979 & 0.16544 \tabularnewline
20 & 0.226568 & 1.9225 & 0.02925 \tabularnewline
21 & -0.230615 & -1.9568 & 0.027122 \tabularnewline
22 & 0.062463 & 0.53 & 0.298865 \tabularnewline
23 & -0.026362 & -0.2237 & 0.411816 \tabularnewline
24 & 0.056483 & 0.4793 & 0.316597 \tabularnewline
25 & -0.000395 & -0.0033 & 0.498669 \tabularnewline
26 & 0.112003 & 0.9504 & 0.172551 \tabularnewline
27 & -0.062494 & -0.5303 & 0.298774 \tabularnewline
28 & -0.169121 & -1.435 & 0.077803 \tabularnewline
29 & -0.093554 & -0.7938 & 0.214951 \tabularnewline
30 & 0.100306 & 0.8511 & 0.198762 \tabularnewline
31 & -0.073317 & -0.6221 & 0.267916 \tabularnewline
32 & 0.12771 & 1.0837 & 0.141066 \tabularnewline
33 & -0.090529 & -0.7682 & 0.22245 \tabularnewline
34 & -0.002165 & -0.0184 & 0.492697 \tabularnewline
35 & -0.118548 & -1.0059 & 0.158913 \tabularnewline
36 & 0.087342 & 0.7411 & 0.230516 \tabularnewline
37 & -0.041372 & -0.3511 & 0.363287 \tabularnewline
38 & 0.064619 & 0.5483 & 0.292588 \tabularnewline
39 & -0.042276 & -0.3587 & 0.360427 \tabularnewline
40 & 0.065004 & 0.5516 & 0.291473 \tabularnewline
41 & -0.195067 & -1.6552 & 0.051118 \tabularnewline
42 & 0.052464 & 0.4452 & 0.328766 \tabularnewline
43 & 0.00342 & 0.029 & 0.488465 \tabularnewline
44 & 0.120321 & 1.021 & 0.155347 \tabularnewline
45 & -0.123113 & -1.0446 & 0.149841 \tabularnewline
46 & 0.121024 & 1.0269 & 0.153947 \tabularnewline
47 & -0.202473 & -1.718 & 0.045043 \tabularnewline
48 & -0.029224 & -0.248 & 0.402429 \tabularnewline
\hline
\end{tabular}
%Source: https://freestatistics.org/blog/index.php?pk=41531&T=1

[TABLE]
[ROW][C]Autocorrelation Function[/C][/ROW]
[ROW][C]Time lag k[/C][C]ACF(k)[/C][C]T-STAT[/C][C]P-value[/C][/ROW]
[ROW][C]1[/C][C]-0.187577[/C][C]-1.5916[/C][C]0.057923[/C][/ROW]
[ROW][C]2[/C][C]0.053833[/C][C]0.4568[/C][C]0.324598[/C][/ROW]
[ROW][C]3[/C][C]-0.017327[/C][C]-0.147[/C][C]0.441763[/C][/ROW]
[ROW][C]4[/C][C]0.015662[/C][C]0.1329[/C][C]0.447323[/C][/ROW]
[ROW][C]5[/C][C]-0.062736[/C][C]-0.5323[/C][C]0.298067[/C][/ROW]
[ROW][C]6[/C][C]0.222534[/C][C]1.8883[/C][C]0.03151[/C][/ROW]
[ROW][C]7[/C][C]-0.081954[/C][C]-0.6954[/C][C]0.24452[/C][/ROW]
[ROW][C]8[/C][C]0.126438[/C][C]1.0729[/C][C]0.143458[/C][/ROW]
[ROW][C]9[/C][C]-0.23203[/C][C]-1.9688[/C][C]0.026411[/C][/ROW]
[ROW][C]10[/C][C]0.053812[/C][C]0.4566[/C][C]0.324662[/C][/ROW]
[ROW][C]11[/C][C]-0.130455[/C][C]-1.1069[/C][C]0.136002[/C][/ROW]
[ROW][C]12[/C][C]0.200749[/C][C]1.7034[/C][C]0.046402[/C][/ROW]
[ROW][C]13[/C][C]0.048217[/C][C]0.4091[/C][C]0.341827[/C][/ROW]
[ROW][C]14[/C][C]0.121562[/C][C]1.0315[/C][C]0.152882[/C][/ROW]
[ROW][C]15[/C][C]-0.226889[/C][C]-1.9252[/C][C]0.029076[/C][/ROW]
[ROW][C]16[/C][C]-0.012745[/C][C]-0.1081[/C][C]0.457091[/C][/ROW]
[ROW][C]17[/C][C]0.061156[/C][C]0.5189[/C][C]0.302701[/C][/ROW]
[ROW][C]18[/C][C]0.03713[/C][C]0.3151[/C][C]0.376816[/C][/ROW]
[ROW][C]19[/C][C]0.115371[/C][C]0.979[/C][C]0.16544[/C][/ROW]
[ROW][C]20[/C][C]0.226568[/C][C]1.9225[/C][C]0.02925[/C][/ROW]
[ROW][C]21[/C][C]-0.230615[/C][C]-1.9568[/C][C]0.027122[/C][/ROW]
[ROW][C]22[/C][C]0.062463[/C][C]0.53[/C][C]0.298865[/C][/ROW]
[ROW][C]23[/C][C]-0.026362[/C][C]-0.2237[/C][C]0.411816[/C][/ROW]
[ROW][C]24[/C][C]0.056483[/C][C]0.4793[/C][C]0.316597[/C][/ROW]
[ROW][C]25[/C][C]-0.000395[/C][C]-0.0033[/C][C]0.498669[/C][/ROW]
[ROW][C]26[/C][C]0.112003[/C][C]0.9504[/C][C]0.172551[/C][/ROW]
[ROW][C]27[/C][C]-0.062494[/C][C]-0.5303[/C][C]0.298774[/C][/ROW]
[ROW][C]28[/C][C]-0.169121[/C][C]-1.435[/C][C]0.077803[/C][/ROW]
[ROW][C]29[/C][C]-0.093554[/C][C]-0.7938[/C][C]0.214951[/C][/ROW]
[ROW][C]30[/C][C]0.100306[/C][C]0.8511[/C][C]0.198762[/C][/ROW]
[ROW][C]31[/C][C]-0.073317[/C][C]-0.6221[/C][C]0.267916[/C][/ROW]
[ROW][C]32[/C][C]0.12771[/C][C]1.0837[/C][C]0.141066[/C][/ROW]
[ROW][C]33[/C][C]-0.090529[/C][C]-0.7682[/C][C]0.22245[/C][/ROW]
[ROW][C]34[/C][C]-0.002165[/C][C]-0.0184[/C][C]0.492697[/C][/ROW]
[ROW][C]35[/C][C]-0.118548[/C][C]-1.0059[/C][C]0.158913[/C][/ROW]
[ROW][C]36[/C][C]0.087342[/C][C]0.7411[/C][C]0.230516[/C][/ROW]
[ROW][C]37[/C][C]-0.041372[/C][C]-0.3511[/C][C]0.363287[/C][/ROW]
[ROW][C]38[/C][C]0.064619[/C][C]0.5483[/C][C]0.292588[/C][/ROW]
[ROW][C]39[/C][C]-0.042276[/C][C]-0.3587[/C][C]0.360427[/C][/ROW]
[ROW][C]40[/C][C]0.065004[/C][C]0.5516[/C][C]0.291473[/C][/ROW]
[ROW][C]41[/C][C]-0.195067[/C][C]-1.6552[/C][C]0.051118[/C][/ROW]
[ROW][C]42[/C][C]0.052464[/C][C]0.4452[/C][C]0.328766[/C][/ROW]
[ROW][C]43[/C][C]0.00342[/C][C]0.029[/C][C]0.488465[/C][/ROW]
[ROW][C]44[/C][C]0.120321[/C][C]1.021[/C][C]0.155347[/C][/ROW]
[ROW][C]45[/C][C]-0.123113[/C][C]-1.0446[/C][C]0.149841[/C][/ROW]
[ROW][C]46[/C][C]0.121024[/C][C]1.0269[/C][C]0.153947[/C][/ROW]
[ROW][C]47[/C][C]-0.202473[/C][C]-1.718[/C][C]0.045043[/C][/ROW]
[ROW][C]48[/C][C]-0.029224[/C][C]-0.248[/C][C]0.402429[/C][/ROW]
[/TABLE]
Source: https://freestatistics.org/blog/index.php?pk=41531&T=1

Globally Unique Identifier (entire table): ba.freestatistics.org/blog/index.php?pk=41531&T=1

As an alternative you can also use a QR Code:  

The GUIDs for individual cells are displayed in the table below:

Autocorrelation Function
Time lag kACF(k)T-STATP-value
1-0.187577-1.59160.057923
20.0538330.45680.324598
3-0.017327-0.1470.441763
40.0156620.13290.447323
5-0.062736-0.53230.298067
60.2225341.88830.03151
7-0.081954-0.69540.24452
80.1264381.07290.143458
9-0.23203-1.96880.026411
100.0538120.45660.324662
11-0.130455-1.10690.136002
120.2007491.70340.046402
130.0482170.40910.341827
140.1215621.03150.152882
15-0.226889-1.92520.029076
16-0.012745-0.10810.457091
170.0611560.51890.302701
180.037130.31510.376816
190.1153710.9790.16544
200.2265681.92250.02925
21-0.230615-1.95680.027122
220.0624630.530.298865
23-0.026362-0.22370.411816
240.0564830.47930.316597
25-0.000395-0.00330.498669
260.1120030.95040.172551
27-0.062494-0.53030.298774
28-0.169121-1.4350.077803
29-0.093554-0.79380.214951
300.1003060.85110.198762
31-0.073317-0.62210.267916
320.127711.08370.141066
33-0.090529-0.76820.22245
34-0.002165-0.01840.492697
35-0.118548-1.00590.158913
360.0873420.74110.230516
37-0.041372-0.35110.363287
380.0646190.54830.292588
39-0.042276-0.35870.360427
400.0650040.55160.291473
41-0.195067-1.65520.051118
420.0524640.44520.328766
430.003420.0290.488465
440.1203211.0210.155347
45-0.123113-1.04460.149841
460.1210241.02690.153947
47-0.202473-1.7180.045043
48-0.029224-0.2480.402429


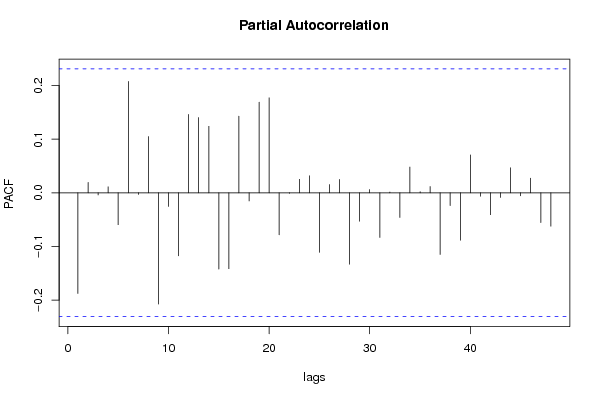
Partial Autocorrelation Function
Time lag kPACF(k)T-STATP-value
1-0.187577-1.59160.057923
20.0193290.1640.435092
3-0.003938-0.03340.486717
40.0111320.09450.462505
5-0.05947-0.50460.307683
60.2076961.76240.041126
7-0.002977-0.02530.489959
80.1048210.88940.188365
9-0.207451-1.76030.041304
10-0.025504-0.21640.41464
11-0.117594-0.99780.160855
120.146131.240.109509
130.1402121.18970.119029
140.1239111.05140.148291
15-0.142134-1.20610.115873
16-0.141471-1.20040.116955
170.1429551.2130.114545
18-0.01525-0.12940.448701
190.1690451.43440.077895
200.1771991.50360.068531
21-0.078306-0.66450.254262
22-0.000858-0.00730.497107
230.0251180.21310.415913
240.0316760.26880.394435
25-0.110941-0.94140.174832
260.0153580.13030.448338
270.0250060.21220.416283
28-0.133139-1.12970.131171
29-0.052914-0.4490.327394
300.0059390.05040.479976
31-0.08328-0.70670.241032
320.0013180.01120.495554
33-0.045953-0.38990.348873
340.0479160.40660.342761
350.0021820.01850.492639
360.0116830.09910.460654
37-0.11502-0.9760.166173
38-0.023872-0.20260.420024
39-0.088459-0.75060.227671
400.0707180.60010.275173
41-0.006397-0.05430.478431
42-0.040924-0.34730.364708
43-0.008557-0.07260.47116
440.046710.39630.34651
45-0.005538-0.0470.481325
460.0272770.23140.408811
47-0.055434-0.47040.319754
48-0.062336-0.52890.299239

\begin{tabular}{lllllllll}
\hline
Partial Autocorrelation Function \tabularnewline
Time lag k & PACF(k) & T-STAT & P-value \tabularnewline
1 & -0.187577 & -1.5916 & 0.057923 \tabularnewline
2 & 0.019329 & 0.164 & 0.435092 \tabularnewline
3 & -0.003938 & -0.0334 & 0.486717 \tabularnewline
4 & 0.011132 & 0.0945 & 0.462505 \tabularnewline
5 & -0.05947 & -0.5046 & 0.307683 \tabularnewline
6 & 0.207696 & 1.7624 & 0.041126 \tabularnewline
7 & -0.002977 & -0.0253 & 0.489959 \tabularnewline
8 & 0.104821 & 0.8894 & 0.188365 \tabularnewline
9 & -0.207451 & -1.7603 & 0.041304 \tabularnewline
10 & -0.025504 & -0.2164 & 0.41464 \tabularnewline
11 & -0.117594 & -0.9978 & 0.160855 \tabularnewline
12 & 0.14613 & 1.24 & 0.109509 \tabularnewline
13 & 0.140212 & 1.1897 & 0.119029 \tabularnewline
14 & 0.123911 & 1.0514 & 0.148291 \tabularnewline
15 & -0.142134 & -1.2061 & 0.115873 \tabularnewline
16 & -0.141471 & -1.2004 & 0.116955 \tabularnewline
17 & 0.142955 & 1.213 & 0.114545 \tabularnewline
18 & -0.01525 & -0.1294 & 0.448701 \tabularnewline
19 & 0.169045 & 1.4344 & 0.077895 \tabularnewline
20 & 0.177199 & 1.5036 & 0.068531 \tabularnewline
21 & -0.078306 & -0.6645 & 0.254262 \tabularnewline
22 & -0.000858 & -0.0073 & 0.497107 \tabularnewline
23 & 0.025118 & 0.2131 & 0.415913 \tabularnewline
24 & 0.031676 & 0.2688 & 0.394435 \tabularnewline
25 & -0.110941 & -0.9414 & 0.174832 \tabularnewline
26 & 0.015358 & 0.1303 & 0.448338 \tabularnewline
27 & 0.025006 & 0.2122 & 0.416283 \tabularnewline
28 & -0.133139 & -1.1297 & 0.131171 \tabularnewline
29 & -0.052914 & -0.449 & 0.327394 \tabularnewline
30 & 0.005939 & 0.0504 & 0.479976 \tabularnewline
31 & -0.08328 & -0.7067 & 0.241032 \tabularnewline
32 & 0.001318 & 0.0112 & 0.495554 \tabularnewline
33 & -0.045953 & -0.3899 & 0.348873 \tabularnewline
34 & 0.047916 & 0.4066 & 0.342761 \tabularnewline
35 & 0.002182 & 0.0185 & 0.492639 \tabularnewline
36 & 0.011683 & 0.0991 & 0.460654 \tabularnewline
37 & -0.11502 & -0.976 & 0.166173 \tabularnewline
38 & -0.023872 & -0.2026 & 0.420024 \tabularnewline
39 & -0.088459 & -0.7506 & 0.227671 \tabularnewline
40 & 0.070718 & 0.6001 & 0.275173 \tabularnewline
41 & -0.006397 & -0.0543 & 0.478431 \tabularnewline
42 & -0.040924 & -0.3473 & 0.364708 \tabularnewline
43 & -0.008557 & -0.0726 & 0.47116 \tabularnewline
44 & 0.04671 & 0.3963 & 0.34651 \tabularnewline
45 & -0.005538 & -0.047 & 0.481325 \tabularnewline
46 & 0.027277 & 0.2314 & 0.408811 \tabularnewline
47 & -0.055434 & -0.4704 & 0.319754 \tabularnewline
48 & -0.062336 & -0.5289 & 0.299239 \tabularnewline
\hline
\end{tabular}
%Source: https://freestatistics.org/blog/index.php?pk=41531&T=2

[TABLE]
[ROW][C]Partial Autocorrelation Function[/C][/ROW]
[ROW][C]Time lag k[/C][C]PACF(k)[/C][C]T-STAT[/C][C]P-value[/C][/ROW]
[ROW][C]1[/C][C]-0.187577[/C][C]-1.5916[/C][C]0.057923[/C][/ROW]
[ROW][C]2[/C][C]0.019329[/C][C]0.164[/C][C]0.435092[/C][/ROW]
[ROW][C]3[/C][C]-0.003938[/C][C]-0.0334[/C][C]0.486717[/C][/ROW]
[ROW][C]4[/C][C]0.011132[/C][C]0.0945[/C][C]0.462505[/C][/ROW]
[ROW][C]5[/C][C]-0.05947[/C][C]-0.5046[/C][C]0.307683[/C][/ROW]
[ROW][C]6[/C][C]0.207696[/C][C]1.7624[/C][C]0.041126[/C][/ROW]
[ROW][C]7[/C][C]-0.002977[/C][C]-0.0253[/C][C]0.489959[/C][/ROW]
[ROW][C]8[/C][C]0.104821[/C][C]0.8894[/C][C]0.188365[/C][/ROW]
[ROW][C]9[/C][C]-0.207451[/C][C]-1.7603[/C][C]0.041304[/C][/ROW]
[ROW][C]10[/C][C]-0.025504[/C][C]-0.2164[/C][C]0.41464[/C][/ROW]
[ROW][C]11[/C][C]-0.117594[/C][C]-0.9978[/C][C]0.160855[/C][/ROW]
[ROW][C]12[/C][C]0.14613[/C][C]1.24[/C][C]0.109509[/C][/ROW]
[ROW][C]13[/C][C]0.140212[/C][C]1.1897[/C][C]0.119029[/C][/ROW]
[ROW][C]14[/C][C]0.123911[/C][C]1.0514[/C][C]0.148291[/C][/ROW]
[ROW][C]15[/C][C]-0.142134[/C][C]-1.2061[/C][C]0.115873[/C][/ROW]
[ROW][C]16[/C][C]-0.141471[/C][C]-1.2004[/C][C]0.116955[/C][/ROW]
[ROW][C]17[/C][C]0.142955[/C][C]1.213[/C][C]0.114545[/C][/ROW]
[ROW][C]18[/C][C]-0.01525[/C][C]-0.1294[/C][C]0.448701[/C][/ROW]
[ROW][C]19[/C][C]0.169045[/C][C]1.4344[/C][C]0.077895[/C][/ROW]
[ROW][C]20[/C][C]0.177199[/C][C]1.5036[/C][C]0.068531[/C][/ROW]
[ROW][C]21[/C][C]-0.078306[/C][C]-0.6645[/C][C]0.254262[/C][/ROW]
[ROW][C]22[/C][C]-0.000858[/C][C]-0.0073[/C][C]0.497107[/C][/ROW]
[ROW][C]23[/C][C]0.025118[/C][C]0.2131[/C][C]0.415913[/C][/ROW]
[ROW][C]24[/C][C]0.031676[/C][C]0.2688[/C][C]0.394435[/C][/ROW]
[ROW][C]25[/C][C]-0.110941[/C][C]-0.9414[/C][C]0.174832[/C][/ROW]
[ROW][C]26[/C][C]0.015358[/C][C]0.1303[/C][C]0.448338[/C][/ROW]
[ROW][C]27[/C][C]0.025006[/C][C]0.2122[/C][C]0.416283[/C][/ROW]
[ROW][C]28[/C][C]-0.133139[/C][C]-1.1297[/C][C]0.131171[/C][/ROW]
[ROW][C]29[/C][C]-0.052914[/C][C]-0.449[/C][C]0.327394[/C][/ROW]
[ROW][C]30[/C][C]0.005939[/C][C]0.0504[/C][C]0.479976[/C][/ROW]
[ROW][C]31[/C][C]-0.08328[/C][C]-0.7067[/C][C]0.241032[/C][/ROW]
[ROW][C]32[/C][C]0.001318[/C][C]0.0112[/C][C]0.495554[/C][/ROW]
[ROW][C]33[/C][C]-0.045953[/C][C]-0.3899[/C][C]0.348873[/C][/ROW]
[ROW][C]34[/C][C]0.047916[/C][C]0.4066[/C][C]0.342761[/C][/ROW]
[ROW][C]35[/C][C]0.002182[/C][C]0.0185[/C][C]0.492639[/C][/ROW]
[ROW][C]36[/C][C]0.011683[/C][C]0.0991[/C][C]0.460654[/C][/ROW]
[ROW][C]37[/C][C]-0.11502[/C][C]-0.976[/C][C]0.166173[/C][/ROW]
[ROW][C]38[/C][C]-0.023872[/C][C]-0.2026[/C][C]0.420024[/C][/ROW]
[ROW][C]39[/C][C]-0.088459[/C][C]-0.7506[/C][C]0.227671[/C][/ROW]
[ROW][C]40[/C][C]0.070718[/C][C]0.6001[/C][C]0.275173[/C][/ROW]
[ROW][C]41[/C][C]-0.006397[/C][C]-0.0543[/C][C]0.478431[/C][/ROW]
[ROW][C]42[/C][C]-0.040924[/C][C]-0.3473[/C][C]0.364708[/C][/ROW]
[ROW][C]43[/C][C]-0.008557[/C][C]-0.0726[/C][C]0.47116[/C][/ROW]
[ROW][C]44[/C][C]0.04671[/C][C]0.3963[/C][C]0.34651[/C][/ROW]
[ROW][C]45[/C][C]-0.005538[/C][C]-0.047[/C][C]0.481325[/C][/ROW]
[ROW][C]46[/C][C]0.027277[/C][C]0.2314[/C][C]0.408811[/C][/ROW]
[ROW][C]47[/C][C]-0.055434[/C][C]-0.4704[/C][C]0.319754[/C][/ROW]
[ROW][C]48[/C][C]-0.062336[/C][C]-0.5289[/C][C]0.299239[/C][/ROW]
[/TABLE]
Source: https://freestatistics.org/blog/index.php?pk=41531&T=2

Globally Unique Identifier (entire table): ba.freestatistics.org/blog/index.php?pk=41531&T=2

As an alternative you can also use a QR Code:  

The GUIDs for individual cells are displayed in the table below:

Partial Autocorrelation Function
Time lag kPACF(k)T-STATP-value
1-0.187577-1.59160.057923
20.0193290.1640.435092
3-0.003938-0.03340.486717
40.0111320.09450.462505
5-0.05947-0.50460.307683
60.2076961.76240.041126
7-0.002977-0.02530.489959
80.1048210.88940.188365
9-0.207451-1.76030.041304
10-0.025504-0.21640.41464
11-0.117594-0.99780.160855
120.146131.240.109509
130.1402121.18970.119029
140.1239111.05140.148291
15-0.142134-1.20610.115873
16-0.141471-1.20040.116955
170.1429551.2130.114545
18-0.01525-0.12940.448701
190.1690451.43440.077895
200.1771991.50360.068531
21-0.078306-0.66450.254262
22-0.000858-0.00730.497107
230.0251180.21310.415913
240.0316760.26880.394435
25-0.110941-0.94140.174832
260.0153580.13030.448338
270.0250060.21220.416283
28-0.133139-1.12970.131171
29-0.052914-0.4490.327394
300.0059390.05040.479976
31-0.08328-0.70670.241032
320.0013180.01120.495554
33-0.045953-0.38990.348873
340.0479160.40660.342761
350.0021820.01850.492639
360.0116830.09910.460654
37-0.11502-0.9760.166173
38-0.023872-0.20260.420024
39-0.088459-0.75060.227671
400.0707180.60010.275173
41-0.006397-0.05430.478431
42-0.040924-0.34730.364708
43-0.008557-0.07260.47116
440.046710.39630.34651
45-0.005538-0.0470.481325
460.0272770.23140.408811
47-0.055434-0.47040.319754
48-0.062336-0.52890.299239


Parameters (Session):
par1 = 48 ; par2 = 1 ; par3 = 1 ; par4 = 0 ; par5 = 12 ;
Parameters (R input):
par1 = 48 ; par2 = 1 ; par3 = 1 ; par4 = 0 ; par5 = 12 ;
R code (references can be found in the software module):
if (par1 == 'Default') {
par1 = 10*log10(length(x))
} else {
par1 <- as.numeric(par1)
}
par2 <- as.numeric(par2)
par3 <- as.numeric(par3)
par4 <- as.numeric(par4)
par5 <- as.numeric(par5)
if (par2 == 0) {
x <- log(x)
} else {
x <- (x ^ par2 - 1) / par2
}
if (par3 > 0) x <- diff(x,lag=1,difference=par3)
if (par4 > 0) x <- diff(x,lag=par5,difference=par4)
bitmap(file='pic1.png')
racf <- acf(x,par1,main='Autocorrelation',xlab='lags',ylab='ACF')
dev.off()
bitmap(file='pic2.png')
rpacf <- pacf(x,par1,main='Partial Autocorrelation',xlab='lags',ylab='PACF')
dev.off()
(myacf <- c(racf$acf))
(mypacf <- c(rpacf$acf))
lengthx <- length(x)
sqrtn <- sqrt(lengthx)
load(file='createtable')
a<-table.start()
a<-table.row.start(a)
a<-table.element(a,'Autocorrelation Function',4,TRUE)
a<-table.row.end(a)
a<-table.row.start(a)
a<-table.element(a,'Time lag k',header=TRUE)
a<-table.element(a,hyperlink('basics.htm','ACF(k)','click here for more information about the Autocorrelation Function'),header=TRUE)
a<-table.element(a,'T-STAT',header=TRUE)
a<-table.element(a,'P-value',header=TRUE)
a<-table.row.end(a)
for (i in 2:(par1+1)) {
a<-table.row.start(a)
a<-table.element(a,i-1,header=TRUE)
a<-table.element(a,round(myacf[i],6))
mytstat <- myacf[i]*sqrtn
a<-table.element(a,round(mytstat,4))
a<-table.element(a,round(1-pt(abs(mytstat),lengthx),6))
a<-table.row.end(a)
}
a<-table.end(a)
table.save(a,file='mytable.tab')
a<-table.start()
a<-table.row.start(a)
a<-table.element(a,'Partial Autocorrelation Function',4,TRUE)
a<-table.row.end(a)
a<-table.row.start(a)
a<-table.element(a,'Time lag k',header=TRUE)
a<-table.element(a,hyperlink('basics.htm','PACF(k)','click here for more information about the Partial Autocorrelation Function'),header=TRUE)
a<-table.element(a,'T-STAT',header=TRUE)
a<-table.element(a,'P-value',header=TRUE)
a<-table.row.end(a)
for (i in 1:par1) {
a<-table.row.start(a)
a<-table.element(a,i,header=TRUE)
a<-table.element(a,round(mypacf[i],6))
mytstat <- mypacf[i]*sqrtn
a<-table.element(a,round(mytstat,4))
a<-table.element(a,round(1-pt(abs(mytstat),lengthx),6))
a<-table.row.end(a)
}
a<-table.end(a)
table.save(a,file='mytable1.tab')