Free Statistics

of Irreproducible Research!

Author's title

Author*Unverified author*
R Software Modulerwasp_autocorrelation.wasp
Title produced by software(Partial) Autocorrelation Function
Date of computationThu, 04 Jun 2009 02:00:44 -0600
Cite this page as followsStatistical Computations at FreeStatistics.org, Office for Research Development and Education, URL https://freestatistics.org/blog/index.php?v=date/2009/Jun/04/t1244102503mq17ycod4lmecw5.htm/, Retrieved Tue, 14 May 2024 16:46:17 +0000
Statistical Computations at FreeStatistics.org, Office for Research Development and Education, URL https://freestatistics.org/blog/index.php?pk=41530, Retrieved Tue, 14 May 2024 16:46:17 +0000
QR Codes:

Original text written by user:
IsPrivate?No (this computation is public)
User-defined keywords
Estimated Impact140
Family? (F = Feedback message, R = changed R code, M = changed R Module, P = changed Parameters, D = changed Data)
-       [(Partial) Autocorrelation Function] [Autocorrelation B...] [2009-06-04 08:00:44] [822aa141fddc67f18188afbe1dd38d3f] [Current]
Feedback Forum

Post a new message
Dataseries X:
260288
261544
259886
257006
259670
258873
264416
263596
262586
260237
261690
259295
264170
264451
265538
261723
266189
265073
267007
266376
267406
262742
260300
263074
265940
264771
268403
264264
264118
266817
269296
269001
266707
267507
267510
267420
270845
270671
273653
271567
268372
268160
267879
271142
271323
269478
271008
269145
271684
273582
279475
276188
278422
281084
278618
280738
288897
282129
286406
284288
286139
288275
287670
286864
288798
288316
286915
288006
293338
303730
306248
305700
314849


Summary of computational transaction
Raw Inputview raw input (R code)
Raw Outputview raw output of R engine
Computing time1 seconds
R Server'Gwilym Jenkins' @ 72.249.127.135

\begin{tabular}{lllllllll}
\hline
Summary of computational transaction \tabularnewline
Raw Input & view raw input (R code)  \tabularnewline
Raw Output & view raw output of R engine  \tabularnewline
Computing time & 1 seconds \tabularnewline
R Server & 'Gwilym Jenkins' @ 72.249.127.135 \tabularnewline
\hline
\end{tabular}
%Source: https://freestatistics.org/blog/index.php?pk=41530&T=0

[TABLE]
[ROW][C]Summary of computational transaction[/C][/ROW]
[ROW][C]Raw Input[/C][C]view raw input (R code) [/C][/ROW]
[ROW][C]Raw Output[/C][C]view raw output of R engine [/C][/ROW]
[ROW][C]Computing time[/C][C]1 seconds[/C][/ROW]
[ROW][C]R Server[/C][C]'Gwilym Jenkins' @ 72.249.127.135[/C][/ROW]
[/TABLE]
Source: https://freestatistics.org/blog/index.php?pk=41530&T=0

Globally Unique Identifier (entire table): ba.freestatistics.org/blog/index.php?pk=41530&T=0

As an alternative you can also use a QR Code:  

The GUIDs for individual cells are displayed in the table below:

Summary of computational transaction
Raw Inputview raw input (R code)
Raw Outputview raw output of R engine
Computing time1 seconds
R Server'Gwilym Jenkins' @ 72.249.127.135


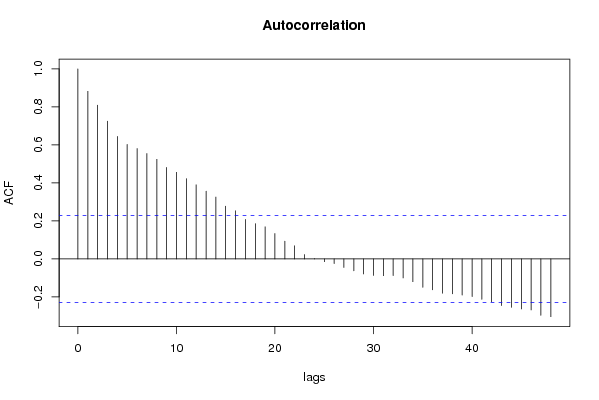
Autocorrelation Function
Time lag kACF(k)T-STATP-value
10.8825037.54010
20.8089486.91170
30.7249266.19380
40.6447495.50870
50.6026985.14951e-06
60.5811844.96562e-06
70.5544194.7375e-06
80.5245794.4821.3e-05
90.4818084.11665e-05
100.4556523.89310.000108
110.4225693.61040.000279
120.3900863.33290.000676
130.3565453.04630.001611
140.3252082.77860.003468
150.2776092.37190.010168
160.2534442.16540.016812
170.2076941.77450.040071
180.1852321.58260.058916
190.168831.44250.076721
200.1334691.14040.128932
210.0933680.79770.213805
220.0685540.58570.279933
230.02250.19220.424044
240.0012020.01030.495917
25-0.014909-0.12740.449495
26-0.024474-0.20910.417472
27-0.045258-0.38670.350057
28-0.062926-0.53760.29623
29-0.079049-0.67540.250779
30-0.087417-0.74690.228765
31-0.08851-0.75620.225972
32-0.087967-0.75160.227356
33-0.100461-0.85830.196757
34-0.12025-1.02740.153809
35-0.149784-1.27980.102342
36-0.163027-1.39290.083938
37-0.180269-1.54020.063916
38-0.184113-1.57310.060015
39-0.190428-1.6270.054021
40-0.198199-1.69340.04732
41-0.212581-1.81630.036716
42-0.225786-1.92910.028802
43-0.245887-2.10090.019553
44-0.255203-2.18050.016224
45-0.263509-2.25140.013684
46-0.268775-2.29640.012262
47-0.297313-2.54020.006602
48-0.304069-2.5980.005669

\begin{tabular}{lllllllll}
\hline
Autocorrelation Function \tabularnewline
Time lag k & ACF(k) & T-STAT & P-value \tabularnewline
1 & 0.882503 & 7.5401 & 0 \tabularnewline
2 & 0.808948 & 6.9117 & 0 \tabularnewline
3 & 0.724926 & 6.1938 & 0 \tabularnewline
4 & 0.644749 & 5.5087 & 0 \tabularnewline
5 & 0.602698 & 5.1495 & 1e-06 \tabularnewline
6 & 0.581184 & 4.9656 & 2e-06 \tabularnewline
7 & 0.554419 & 4.737 & 5e-06 \tabularnewline
8 & 0.524579 & 4.482 & 1.3e-05 \tabularnewline
9 & 0.481808 & 4.1166 & 5e-05 \tabularnewline
10 & 0.455652 & 3.8931 & 0.000108 \tabularnewline
11 & 0.422569 & 3.6104 & 0.000279 \tabularnewline
12 & 0.390086 & 3.3329 & 0.000676 \tabularnewline
13 & 0.356545 & 3.0463 & 0.001611 \tabularnewline
14 & 0.325208 & 2.7786 & 0.003468 \tabularnewline
15 & 0.277609 & 2.3719 & 0.010168 \tabularnewline
16 & 0.253444 & 2.1654 & 0.016812 \tabularnewline
17 & 0.207694 & 1.7745 & 0.040071 \tabularnewline
18 & 0.185232 & 1.5826 & 0.058916 \tabularnewline
19 & 0.16883 & 1.4425 & 0.076721 \tabularnewline
20 & 0.133469 & 1.1404 & 0.128932 \tabularnewline
21 & 0.093368 & 0.7977 & 0.213805 \tabularnewline
22 & 0.068554 & 0.5857 & 0.279933 \tabularnewline
23 & 0.0225 & 0.1922 & 0.424044 \tabularnewline
24 & 0.001202 & 0.0103 & 0.495917 \tabularnewline
25 & -0.014909 & -0.1274 & 0.449495 \tabularnewline
26 & -0.024474 & -0.2091 & 0.417472 \tabularnewline
27 & -0.045258 & -0.3867 & 0.350057 \tabularnewline
28 & -0.062926 & -0.5376 & 0.29623 \tabularnewline
29 & -0.079049 & -0.6754 & 0.250779 \tabularnewline
30 & -0.087417 & -0.7469 & 0.228765 \tabularnewline
31 & -0.08851 & -0.7562 & 0.225972 \tabularnewline
32 & -0.087967 & -0.7516 & 0.227356 \tabularnewline
33 & -0.100461 & -0.8583 & 0.196757 \tabularnewline
34 & -0.12025 & -1.0274 & 0.153809 \tabularnewline
35 & -0.149784 & -1.2798 & 0.102342 \tabularnewline
36 & -0.163027 & -1.3929 & 0.083938 \tabularnewline
37 & -0.180269 & -1.5402 & 0.063916 \tabularnewline
38 & -0.184113 & -1.5731 & 0.060015 \tabularnewline
39 & -0.190428 & -1.627 & 0.054021 \tabularnewline
40 & -0.198199 & -1.6934 & 0.04732 \tabularnewline
41 & -0.212581 & -1.8163 & 0.036716 \tabularnewline
42 & -0.225786 & -1.9291 & 0.028802 \tabularnewline
43 & -0.245887 & -2.1009 & 0.019553 \tabularnewline
44 & -0.255203 & -2.1805 & 0.016224 \tabularnewline
45 & -0.263509 & -2.2514 & 0.013684 \tabularnewline
46 & -0.268775 & -2.2964 & 0.012262 \tabularnewline
47 & -0.297313 & -2.5402 & 0.006602 \tabularnewline
48 & -0.304069 & -2.598 & 0.005669 \tabularnewline
\hline
\end{tabular}
%Source: https://freestatistics.org/blog/index.php?pk=41530&T=1

[TABLE]
[ROW][C]Autocorrelation Function[/C][/ROW]
[ROW][C]Time lag k[/C][C]ACF(k)[/C][C]T-STAT[/C][C]P-value[/C][/ROW]
[ROW][C]1[/C][C]0.882503[/C][C]7.5401[/C][C]0[/C][/ROW]
[ROW][C]2[/C][C]0.808948[/C][C]6.9117[/C][C]0[/C][/ROW]
[ROW][C]3[/C][C]0.724926[/C][C]6.1938[/C][C]0[/C][/ROW]
[ROW][C]4[/C][C]0.644749[/C][C]5.5087[/C][C]0[/C][/ROW]
[ROW][C]5[/C][C]0.602698[/C][C]5.1495[/C][C]1e-06[/C][/ROW]
[ROW][C]6[/C][C]0.581184[/C][C]4.9656[/C][C]2e-06[/C][/ROW]
[ROW][C]7[/C][C]0.554419[/C][C]4.737[/C][C]5e-06[/C][/ROW]
[ROW][C]8[/C][C]0.524579[/C][C]4.482[/C][C]1.3e-05[/C][/ROW]
[ROW][C]9[/C][C]0.481808[/C][C]4.1166[/C][C]5e-05[/C][/ROW]
[ROW][C]10[/C][C]0.455652[/C][C]3.8931[/C][C]0.000108[/C][/ROW]
[ROW][C]11[/C][C]0.422569[/C][C]3.6104[/C][C]0.000279[/C][/ROW]
[ROW][C]12[/C][C]0.390086[/C][C]3.3329[/C][C]0.000676[/C][/ROW]
[ROW][C]13[/C][C]0.356545[/C][C]3.0463[/C][C]0.001611[/C][/ROW]
[ROW][C]14[/C][C]0.325208[/C][C]2.7786[/C][C]0.003468[/C][/ROW]
[ROW][C]15[/C][C]0.277609[/C][C]2.3719[/C][C]0.010168[/C][/ROW]
[ROW][C]16[/C][C]0.253444[/C][C]2.1654[/C][C]0.016812[/C][/ROW]
[ROW][C]17[/C][C]0.207694[/C][C]1.7745[/C][C]0.040071[/C][/ROW]
[ROW][C]18[/C][C]0.185232[/C][C]1.5826[/C][C]0.058916[/C][/ROW]
[ROW][C]19[/C][C]0.16883[/C][C]1.4425[/C][C]0.076721[/C][/ROW]
[ROW][C]20[/C][C]0.133469[/C][C]1.1404[/C][C]0.128932[/C][/ROW]
[ROW][C]21[/C][C]0.093368[/C][C]0.7977[/C][C]0.213805[/C][/ROW]
[ROW][C]22[/C][C]0.068554[/C][C]0.5857[/C][C]0.279933[/C][/ROW]
[ROW][C]23[/C][C]0.0225[/C][C]0.1922[/C][C]0.424044[/C][/ROW]
[ROW][C]24[/C][C]0.001202[/C][C]0.0103[/C][C]0.495917[/C][/ROW]
[ROW][C]25[/C][C]-0.014909[/C][C]-0.1274[/C][C]0.449495[/C][/ROW]
[ROW][C]26[/C][C]-0.024474[/C][C]-0.2091[/C][C]0.417472[/C][/ROW]
[ROW][C]27[/C][C]-0.045258[/C][C]-0.3867[/C][C]0.350057[/C][/ROW]
[ROW][C]28[/C][C]-0.062926[/C][C]-0.5376[/C][C]0.29623[/C][/ROW]
[ROW][C]29[/C][C]-0.079049[/C][C]-0.6754[/C][C]0.250779[/C][/ROW]
[ROW][C]30[/C][C]-0.087417[/C][C]-0.7469[/C][C]0.228765[/C][/ROW]
[ROW][C]31[/C][C]-0.08851[/C][C]-0.7562[/C][C]0.225972[/C][/ROW]
[ROW][C]32[/C][C]-0.087967[/C][C]-0.7516[/C][C]0.227356[/C][/ROW]
[ROW][C]33[/C][C]-0.100461[/C][C]-0.8583[/C][C]0.196757[/C][/ROW]
[ROW][C]34[/C][C]-0.12025[/C][C]-1.0274[/C][C]0.153809[/C][/ROW]
[ROW][C]35[/C][C]-0.149784[/C][C]-1.2798[/C][C]0.102342[/C][/ROW]
[ROW][C]36[/C][C]-0.163027[/C][C]-1.3929[/C][C]0.083938[/C][/ROW]
[ROW][C]37[/C][C]-0.180269[/C][C]-1.5402[/C][C]0.063916[/C][/ROW]
[ROW][C]38[/C][C]-0.184113[/C][C]-1.5731[/C][C]0.060015[/C][/ROW]
[ROW][C]39[/C][C]-0.190428[/C][C]-1.627[/C][C]0.054021[/C][/ROW]
[ROW][C]40[/C][C]-0.198199[/C][C]-1.6934[/C][C]0.04732[/C][/ROW]
[ROW][C]41[/C][C]-0.212581[/C][C]-1.8163[/C][C]0.036716[/C][/ROW]
[ROW][C]42[/C][C]-0.225786[/C][C]-1.9291[/C][C]0.028802[/C][/ROW]
[ROW][C]43[/C][C]-0.245887[/C][C]-2.1009[/C][C]0.019553[/C][/ROW]
[ROW][C]44[/C][C]-0.255203[/C][C]-2.1805[/C][C]0.016224[/C][/ROW]
[ROW][C]45[/C][C]-0.263509[/C][C]-2.2514[/C][C]0.013684[/C][/ROW]
[ROW][C]46[/C][C]-0.268775[/C][C]-2.2964[/C][C]0.012262[/C][/ROW]
[ROW][C]47[/C][C]-0.297313[/C][C]-2.5402[/C][C]0.006602[/C][/ROW]
[ROW][C]48[/C][C]-0.304069[/C][C]-2.598[/C][C]0.005669[/C][/ROW]
[/TABLE]
Source: https://freestatistics.org/blog/index.php?pk=41530&T=1

Globally Unique Identifier (entire table): ba.freestatistics.org/blog/index.php?pk=41530&T=1

As an alternative you can also use a QR Code:  

The GUIDs for individual cells are displayed in the table below:

Autocorrelation Function
Time lag kACF(k)T-STATP-value
10.8825037.54010
20.8089486.91170
30.7249266.19380
40.6447495.50870
50.6026985.14951e-06
60.5811844.96562e-06
70.5544194.7375e-06
80.5245794.4821.3e-05
90.4818084.11665e-05
100.4556523.89310.000108
110.4225693.61040.000279
120.3900863.33290.000676
130.3565453.04630.001611
140.3252082.77860.003468
150.2776092.37190.010168
160.2534442.16540.016812
170.2076941.77450.040071
180.1852321.58260.058916
190.168831.44250.076721
200.1334691.14040.128932
210.0933680.79770.213805
220.0685540.58570.279933
230.02250.19220.424044
240.0012020.01030.495917
25-0.014909-0.12740.449495
26-0.024474-0.20910.417472
27-0.045258-0.38670.350057
28-0.062926-0.53760.29623
29-0.079049-0.67540.250779
30-0.087417-0.74690.228765
31-0.08851-0.75620.225972
32-0.087967-0.75160.227356
33-0.100461-0.85830.196757
34-0.12025-1.02740.153809
35-0.149784-1.27980.102342
36-0.163027-1.39290.083938
37-0.180269-1.54020.063916
38-0.184113-1.57310.060015
39-0.190428-1.6270.054021
40-0.198199-1.69340.04732
41-0.212581-1.81630.036716
42-0.225786-1.92910.028802
43-0.245887-2.10090.019553
44-0.255203-2.18050.016224
45-0.263509-2.25140.013684
46-0.268775-2.29640.012262
47-0.297313-2.54020.006602
48-0.304069-2.5980.005669


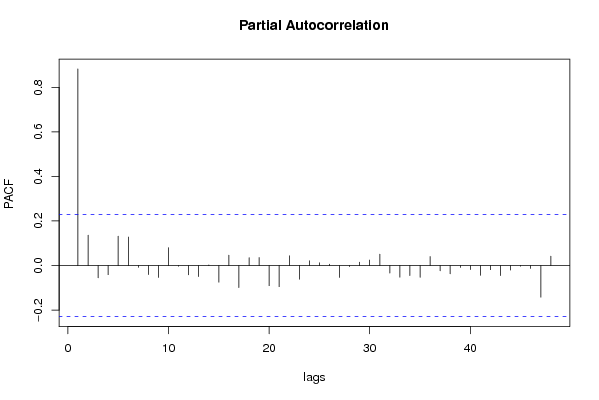
Partial Autocorrelation Function
Time lag kPACF(k)T-STATP-value
10.8825037.54010
20.1362491.16410.124084
3-0.055024-0.47010.319833
4-0.040932-0.34970.363776
50.1320521.12830.131454
60.127771.09170.139285
7-0.008048-0.06880.472684
8-0.04056-0.34650.364965
9-0.05363-0.45820.324081
100.080230.68550.247605
11-0.002963-0.02530.489937
12-0.041604-0.35550.361632
13-0.04961-0.42390.336455
140.002880.02460.490219
15-0.074801-0.63910.262379
160.0466470.39860.345693
17-0.098687-0.84320.20094
180.0350920.29980.38258
190.0361070.30850.379292
20-0.090258-0.77120.221548
21-0.095155-0.8130.209429
220.0434320.37110.355826
23-0.061318-0.52390.300968
240.0214540.18330.427534
250.0123420.10550.458153
260.0061280.05240.479194
27-0.053495-0.45710.324492
28-0.004432-0.03790.484947
290.0151680.12960.44862
300.0248380.21220.416265
310.0509080.4350.332438
32-0.033698-0.28790.387113
33-0.052166-0.44570.328565
34-0.045027-0.38470.350786
35-0.052584-0.44930.327281
360.0401840.34330.366169
37-0.023766-0.20310.419828
38-0.037199-0.31780.375762
39-0.008732-0.07460.470365
40-0.017902-0.1530.439429
41-0.044024-0.37610.35395
42-0.018314-0.15650.438046
43-0.045065-0.3850.350666
44-0.0203-0.17340.431392
45-0.003049-0.02610.489643
46-0.01326-0.11330.455053
47-0.142293-1.21580.113998
480.0419020.3580.360684

\begin{tabular}{lllllllll}
\hline
Partial Autocorrelation Function \tabularnewline
Time lag k & PACF(k) & T-STAT & P-value \tabularnewline
1 & 0.882503 & 7.5401 & 0 \tabularnewline
2 & 0.136249 & 1.1641 & 0.124084 \tabularnewline
3 & -0.055024 & -0.4701 & 0.319833 \tabularnewline
4 & -0.040932 & -0.3497 & 0.363776 \tabularnewline
5 & 0.132052 & 1.1283 & 0.131454 \tabularnewline
6 & 0.12777 & 1.0917 & 0.139285 \tabularnewline
7 & -0.008048 & -0.0688 & 0.472684 \tabularnewline
8 & -0.04056 & -0.3465 & 0.364965 \tabularnewline
9 & -0.05363 & -0.4582 & 0.324081 \tabularnewline
10 & 0.08023 & 0.6855 & 0.247605 \tabularnewline
11 & -0.002963 & -0.0253 & 0.489937 \tabularnewline
12 & -0.041604 & -0.3555 & 0.361632 \tabularnewline
13 & -0.04961 & -0.4239 & 0.336455 \tabularnewline
14 & 0.00288 & 0.0246 & 0.490219 \tabularnewline
15 & -0.074801 & -0.6391 & 0.262379 \tabularnewline
16 & 0.046647 & 0.3986 & 0.345693 \tabularnewline
17 & -0.098687 & -0.8432 & 0.20094 \tabularnewline
18 & 0.035092 & 0.2998 & 0.38258 \tabularnewline
19 & 0.036107 & 0.3085 & 0.379292 \tabularnewline
20 & -0.090258 & -0.7712 & 0.221548 \tabularnewline
21 & -0.095155 & -0.813 & 0.209429 \tabularnewline
22 & 0.043432 & 0.3711 & 0.355826 \tabularnewline
23 & -0.061318 & -0.5239 & 0.300968 \tabularnewline
24 & 0.021454 & 0.1833 & 0.427534 \tabularnewline
25 & 0.012342 & 0.1055 & 0.458153 \tabularnewline
26 & 0.006128 & 0.0524 & 0.479194 \tabularnewline
27 & -0.053495 & -0.4571 & 0.324492 \tabularnewline
28 & -0.004432 & -0.0379 & 0.484947 \tabularnewline
29 & 0.015168 & 0.1296 & 0.44862 \tabularnewline
30 & 0.024838 & 0.2122 & 0.416265 \tabularnewline
31 & 0.050908 & 0.435 & 0.332438 \tabularnewline
32 & -0.033698 & -0.2879 & 0.387113 \tabularnewline
33 & -0.052166 & -0.4457 & 0.328565 \tabularnewline
34 & -0.045027 & -0.3847 & 0.350786 \tabularnewline
35 & -0.052584 & -0.4493 & 0.327281 \tabularnewline
36 & 0.040184 & 0.3433 & 0.366169 \tabularnewline
37 & -0.023766 & -0.2031 & 0.419828 \tabularnewline
38 & -0.037199 & -0.3178 & 0.375762 \tabularnewline
39 & -0.008732 & -0.0746 & 0.470365 \tabularnewline
40 & -0.017902 & -0.153 & 0.439429 \tabularnewline
41 & -0.044024 & -0.3761 & 0.35395 \tabularnewline
42 & -0.018314 & -0.1565 & 0.438046 \tabularnewline
43 & -0.045065 & -0.385 & 0.350666 \tabularnewline
44 & -0.0203 & -0.1734 & 0.431392 \tabularnewline
45 & -0.003049 & -0.0261 & 0.489643 \tabularnewline
46 & -0.01326 & -0.1133 & 0.455053 \tabularnewline
47 & -0.142293 & -1.2158 & 0.113998 \tabularnewline
48 & 0.041902 & 0.358 & 0.360684 \tabularnewline
\hline
\end{tabular}
%Source: https://freestatistics.org/blog/index.php?pk=41530&T=2

[TABLE]
[ROW][C]Partial Autocorrelation Function[/C][/ROW]
[ROW][C]Time lag k[/C][C]PACF(k)[/C][C]T-STAT[/C][C]P-value[/C][/ROW]
[ROW][C]1[/C][C]0.882503[/C][C]7.5401[/C][C]0[/C][/ROW]
[ROW][C]2[/C][C]0.136249[/C][C]1.1641[/C][C]0.124084[/C][/ROW]
[ROW][C]3[/C][C]-0.055024[/C][C]-0.4701[/C][C]0.319833[/C][/ROW]
[ROW][C]4[/C][C]-0.040932[/C][C]-0.3497[/C][C]0.363776[/C][/ROW]
[ROW][C]5[/C][C]0.132052[/C][C]1.1283[/C][C]0.131454[/C][/ROW]
[ROW][C]6[/C][C]0.12777[/C][C]1.0917[/C][C]0.139285[/C][/ROW]
[ROW][C]7[/C][C]-0.008048[/C][C]-0.0688[/C][C]0.472684[/C][/ROW]
[ROW][C]8[/C][C]-0.04056[/C][C]-0.3465[/C][C]0.364965[/C][/ROW]
[ROW][C]9[/C][C]-0.05363[/C][C]-0.4582[/C][C]0.324081[/C][/ROW]
[ROW][C]10[/C][C]0.08023[/C][C]0.6855[/C][C]0.247605[/C][/ROW]
[ROW][C]11[/C][C]-0.002963[/C][C]-0.0253[/C][C]0.489937[/C][/ROW]
[ROW][C]12[/C][C]-0.041604[/C][C]-0.3555[/C][C]0.361632[/C][/ROW]
[ROW][C]13[/C][C]-0.04961[/C][C]-0.4239[/C][C]0.336455[/C][/ROW]
[ROW][C]14[/C][C]0.00288[/C][C]0.0246[/C][C]0.490219[/C][/ROW]
[ROW][C]15[/C][C]-0.074801[/C][C]-0.6391[/C][C]0.262379[/C][/ROW]
[ROW][C]16[/C][C]0.046647[/C][C]0.3986[/C][C]0.345693[/C][/ROW]
[ROW][C]17[/C][C]-0.098687[/C][C]-0.8432[/C][C]0.20094[/C][/ROW]
[ROW][C]18[/C][C]0.035092[/C][C]0.2998[/C][C]0.38258[/C][/ROW]
[ROW][C]19[/C][C]0.036107[/C][C]0.3085[/C][C]0.379292[/C][/ROW]
[ROW][C]20[/C][C]-0.090258[/C][C]-0.7712[/C][C]0.221548[/C][/ROW]
[ROW][C]21[/C][C]-0.095155[/C][C]-0.813[/C][C]0.209429[/C][/ROW]
[ROW][C]22[/C][C]0.043432[/C][C]0.3711[/C][C]0.355826[/C][/ROW]
[ROW][C]23[/C][C]-0.061318[/C][C]-0.5239[/C][C]0.300968[/C][/ROW]
[ROW][C]24[/C][C]0.021454[/C][C]0.1833[/C][C]0.427534[/C][/ROW]
[ROW][C]25[/C][C]0.012342[/C][C]0.1055[/C][C]0.458153[/C][/ROW]
[ROW][C]26[/C][C]0.006128[/C][C]0.0524[/C][C]0.479194[/C][/ROW]
[ROW][C]27[/C][C]-0.053495[/C][C]-0.4571[/C][C]0.324492[/C][/ROW]
[ROW][C]28[/C][C]-0.004432[/C][C]-0.0379[/C][C]0.484947[/C][/ROW]
[ROW][C]29[/C][C]0.015168[/C][C]0.1296[/C][C]0.44862[/C][/ROW]
[ROW][C]30[/C][C]0.024838[/C][C]0.2122[/C][C]0.416265[/C][/ROW]
[ROW][C]31[/C][C]0.050908[/C][C]0.435[/C][C]0.332438[/C][/ROW]
[ROW][C]32[/C][C]-0.033698[/C][C]-0.2879[/C][C]0.387113[/C][/ROW]
[ROW][C]33[/C][C]-0.052166[/C][C]-0.4457[/C][C]0.328565[/C][/ROW]
[ROW][C]34[/C][C]-0.045027[/C][C]-0.3847[/C][C]0.350786[/C][/ROW]
[ROW][C]35[/C][C]-0.052584[/C][C]-0.4493[/C][C]0.327281[/C][/ROW]
[ROW][C]36[/C][C]0.040184[/C][C]0.3433[/C][C]0.366169[/C][/ROW]
[ROW][C]37[/C][C]-0.023766[/C][C]-0.2031[/C][C]0.419828[/C][/ROW]
[ROW][C]38[/C][C]-0.037199[/C][C]-0.3178[/C][C]0.375762[/C][/ROW]
[ROW][C]39[/C][C]-0.008732[/C][C]-0.0746[/C][C]0.470365[/C][/ROW]
[ROW][C]40[/C][C]-0.017902[/C][C]-0.153[/C][C]0.439429[/C][/ROW]
[ROW][C]41[/C][C]-0.044024[/C][C]-0.3761[/C][C]0.35395[/C][/ROW]
[ROW][C]42[/C][C]-0.018314[/C][C]-0.1565[/C][C]0.438046[/C][/ROW]
[ROW][C]43[/C][C]-0.045065[/C][C]-0.385[/C][C]0.350666[/C][/ROW]
[ROW][C]44[/C][C]-0.0203[/C][C]-0.1734[/C][C]0.431392[/C][/ROW]
[ROW][C]45[/C][C]-0.003049[/C][C]-0.0261[/C][C]0.489643[/C][/ROW]
[ROW][C]46[/C][C]-0.01326[/C][C]-0.1133[/C][C]0.455053[/C][/ROW]
[ROW][C]47[/C][C]-0.142293[/C][C]-1.2158[/C][C]0.113998[/C][/ROW]
[ROW][C]48[/C][C]0.041902[/C][C]0.358[/C][C]0.360684[/C][/ROW]
[/TABLE]
Source: https://freestatistics.org/blog/index.php?pk=41530&T=2

Globally Unique Identifier (entire table): ba.freestatistics.org/blog/index.php?pk=41530&T=2

As an alternative you can also use a QR Code:  

The GUIDs for individual cells are displayed in the table below:

Partial Autocorrelation Function
Time lag kPACF(k)T-STATP-value
10.8825037.54010
20.1362491.16410.124084
3-0.055024-0.47010.319833
4-0.040932-0.34970.363776
50.1320521.12830.131454
60.127771.09170.139285
7-0.008048-0.06880.472684
8-0.04056-0.34650.364965
9-0.05363-0.45820.324081
100.080230.68550.247605
11-0.002963-0.02530.489937
12-0.041604-0.35550.361632
13-0.04961-0.42390.336455
140.002880.02460.490219
15-0.074801-0.63910.262379
160.0466470.39860.345693
17-0.098687-0.84320.20094
180.0350920.29980.38258
190.0361070.30850.379292
20-0.090258-0.77120.221548
21-0.095155-0.8130.209429
220.0434320.37110.355826
23-0.061318-0.52390.300968
240.0214540.18330.427534
250.0123420.10550.458153
260.0061280.05240.479194
27-0.053495-0.45710.324492
28-0.004432-0.03790.484947
290.0151680.12960.44862
300.0248380.21220.416265
310.0509080.4350.332438
32-0.033698-0.28790.387113
33-0.052166-0.44570.328565
34-0.045027-0.38470.350786
35-0.052584-0.44930.327281
360.0401840.34330.366169
37-0.023766-0.20310.419828
38-0.037199-0.31780.375762
39-0.008732-0.07460.470365
40-0.017902-0.1530.439429
41-0.044024-0.37610.35395
42-0.018314-0.15650.438046
43-0.045065-0.3850.350666
44-0.0203-0.17340.431392
45-0.003049-0.02610.489643
46-0.01326-0.11330.455053
47-0.142293-1.21580.113998
480.0419020.3580.360684


Parameters (Session):
par1 = 48 ; par2 = 1 ; par3 = 0 ; par4 = 0 ; par5 = 12 ;
Parameters (R input):
par1 = 48 ; par2 = 1 ; par3 = 0 ; par4 = 0 ; par5 = 12 ;
R code (references can be found in the software module):
if (par1 == 'Default') {
par1 = 10*log10(length(x))
} else {
par1 <- as.numeric(par1)
}
par2 <- as.numeric(par2)
par3 <- as.numeric(par3)
par4 <- as.numeric(par4)
par5 <- as.numeric(par5)
if (par2 == 0) {
x <- log(x)
} else {
x <- (x ^ par2 - 1) / par2
}
if (par3 > 0) x <- diff(x,lag=1,difference=par3)
if (par4 > 0) x <- diff(x,lag=par5,difference=par4)
bitmap(file='pic1.png')
racf <- acf(x,par1,main='Autocorrelation',xlab='lags',ylab='ACF')
dev.off()
bitmap(file='pic2.png')
rpacf <- pacf(x,par1,main='Partial Autocorrelation',xlab='lags',ylab='PACF')
dev.off()
(myacf <- c(racf$acf))
(mypacf <- c(rpacf$acf))
lengthx <- length(x)
sqrtn <- sqrt(lengthx)
load(file='createtable')
a<-table.start()
a<-table.row.start(a)
a<-table.element(a,'Autocorrelation Function',4,TRUE)
a<-table.row.end(a)
a<-table.row.start(a)
a<-table.element(a,'Time lag k',header=TRUE)
a<-table.element(a,hyperlink('basics.htm','ACF(k)','click here for more information about the Autocorrelation Function'),header=TRUE)
a<-table.element(a,'T-STAT',header=TRUE)
a<-table.element(a,'P-value',header=TRUE)
a<-table.row.end(a)
for (i in 2:(par1+1)) {
a<-table.row.start(a)
a<-table.element(a,i-1,header=TRUE)
a<-table.element(a,round(myacf[i],6))
mytstat <- myacf[i]*sqrtn
a<-table.element(a,round(mytstat,4))
a<-table.element(a,round(1-pt(abs(mytstat),lengthx),6))
a<-table.row.end(a)
}
a<-table.end(a)
table.save(a,file='mytable.tab')
a<-table.start()
a<-table.row.start(a)
a<-table.element(a,'Partial Autocorrelation Function',4,TRUE)
a<-table.row.end(a)
a<-table.row.start(a)
a<-table.element(a,'Time lag k',header=TRUE)
a<-table.element(a,hyperlink('basics.htm','PACF(k)','click here for more information about the Partial Autocorrelation Function'),header=TRUE)
a<-table.element(a,'T-STAT',header=TRUE)
a<-table.element(a,'P-value',header=TRUE)
a<-table.row.end(a)
for (i in 1:par1) {
a<-table.row.start(a)
a<-table.element(a,i,header=TRUE)
a<-table.element(a,round(mypacf[i],6))
mytstat <- mypacf[i]*sqrtn
a<-table.element(a,round(mytstat,4))
a<-table.element(a,round(1-pt(abs(mytstat),lengthx),6))
a<-table.row.end(a)
}
a<-table.end(a)
table.save(a,file='mytable1.tab')