Free Statistics

of Irreproducible Research!

Author's title

Author*Unverified author*
R Software Modulerwasp_autocorrelation.wasp
Title produced by software(Partial) Autocorrelation Function
Date of computationThu, 04 Jun 2009 01:53:29 -0600
Cite this page as followsStatistical Computations at FreeStatistics.org, Office for Research Development and Education, URL https://freestatistics.org/blog/index.php?v=date/2009/Jun/04/t1244102035j9dym8l71yzhc7g.htm/, Retrieved Tue, 14 May 2024 08:51:02 +0000
Statistical Computations at FreeStatistics.org, Office for Research Development and Education, URL https://freestatistics.org/blog/index.php?pk=41527, Retrieved Tue, 14 May 2024 08:51:02 +0000
QR Codes:

Original text written by user:
IsPrivate?No (this computation is public)
User-defined keywords
Estimated Impact179
Family? (F = Feedback message, R = changed R code, M = changed R Module, P = changed Parameters, D = changed Data)
-       [(Partial) Autocorrelation Function] [DIFFERENTIEREN - ...] [2009-06-04 07:53:29] [cec0b6ecf0cab4e1552eba4b21b592a6] [Current]
Feedback Forum

Post a new message
Dataseries X:
509
501
507
569
580
578
565
547
555
562
561
555
544
537
543
594
611
613
611
594
595
591
589
584
573
567
569
621
629
628
612
595
597
593
590
580
574
573
573
620
626
620
588
566
557
561
549
532
526
511
499
555
565
542
527
510
514
517
508
493
490
469
478
528
534
518
506
502
516
528
533
536


Summary of computational transaction
Raw Inputview raw input (R code)
Raw Outputview raw output of R engine
Computing time2 seconds
R Server'Sir Ronald Aylmer Fisher' @ 193.190.124.24

\begin{tabular}{lllllllll}
\hline
Summary of computational transaction \tabularnewline
Raw Input & view raw input (R code)  \tabularnewline
Raw Output & view raw output of R engine  \tabularnewline
Computing time & 2 seconds \tabularnewline
R Server & 'Sir Ronald Aylmer Fisher' @ 193.190.124.24 \tabularnewline
\hline
\end{tabular}
%Source: https://freestatistics.org/blog/index.php?pk=41527&T=0

[TABLE]
[ROW][C]Summary of computational transaction[/C][/ROW]
[ROW][C]Raw Input[/C][C]view raw input (R code) [/C][/ROW]
[ROW][C]Raw Output[/C][C]view raw output of R engine [/C][/ROW]
[ROW][C]Computing time[/C][C]2 seconds[/C][/ROW]
[ROW][C]R Server[/C][C]'Sir Ronald Aylmer Fisher' @ 193.190.124.24[/C][/ROW]
[/TABLE]
Source: https://freestatistics.org/blog/index.php?pk=41527&T=0

Globally Unique Identifier (entire table): ba.freestatistics.org/blog/index.php?pk=41527&T=0

As an alternative you can also use a QR Code:  

The GUIDs for individual cells are displayed in the table below:

Summary of computational transaction
Raw Inputview raw input (R code)
Raw Outputview raw output of R engine
Computing time2 seconds
R Server'Sir Ronald Aylmer Fisher' @ 193.190.124.24


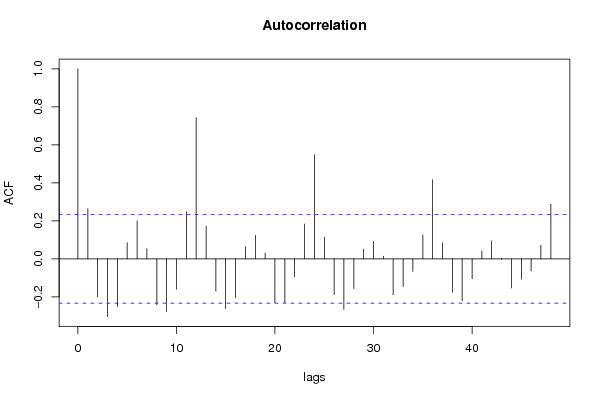
Autocorrelation Function
Time lag kACF(k)T-STATP-value
10.2640752.22510.014625
2-0.199348-1.67970.048702
3-0.304383-2.56480.00622
4-0.251231-2.11690.018886
50.0845180.71220.239348
60.2002591.68740.047957
70.0530550.44710.3281
8-0.24202-2.03930.022572
9-0.277797-2.34080.011029
10-0.159592-1.34480.091493
110.2479562.08930.020132
120.7431976.26230
130.1713131.44350.076638
14-0.16939-1.42730.078937
15-0.261996-2.20760.015252
16-0.204539-1.72350.044577
170.064280.54160.294884
180.1242011.04650.149432
190.0301640.25420.40005
20-0.230959-1.94610.027801
21-0.231374-1.94960.027587
22-0.094204-0.79380.214986
230.183911.54970.062836
240.5480434.61798e-06
250.1134130.95560.17125
26-0.187753-1.5820.059043
27-0.266473-2.24530.013931
28-0.156614-1.31970.095595
290.0514570.43360.332953
300.0908840.76580.223166
310.0140040.1180.453199
32-0.189422-1.59610.057455
33-0.145846-1.22890.11158
34-0.066491-0.56030.288533
350.1252651.05550.147386
360.4161943.50690.000395
370.0843790.7110.239709
38-0.176477-1.4870.070719
39-0.220396-1.85710.033723
40-0.104234-0.87830.191375
410.041570.35030.363585
420.0955330.8050.211761
43-0.003171-0.02670.489381
44-0.153435-1.29290.100124
45-0.107019-0.90180.185118
46-0.063809-0.53770.296244
470.0710620.59880.275613
480.2877942.4250.008927

\begin{tabular}{lllllllll}
\hline
Autocorrelation Function \tabularnewline
Time lag k & ACF(k) & T-STAT & P-value \tabularnewline
1 & 0.264075 & 2.2251 & 0.014625 \tabularnewline
2 & -0.199348 & -1.6797 & 0.048702 \tabularnewline
3 & -0.304383 & -2.5648 & 0.00622 \tabularnewline
4 & -0.251231 & -2.1169 & 0.018886 \tabularnewline
5 & 0.084518 & 0.7122 & 0.239348 \tabularnewline
6 & 0.200259 & 1.6874 & 0.047957 \tabularnewline
7 & 0.053055 & 0.4471 & 0.3281 \tabularnewline
8 & -0.24202 & -2.0393 & 0.022572 \tabularnewline
9 & -0.277797 & -2.3408 & 0.011029 \tabularnewline
10 & -0.159592 & -1.3448 & 0.091493 \tabularnewline
11 & 0.247956 & 2.0893 & 0.020132 \tabularnewline
12 & 0.743197 & 6.2623 & 0 \tabularnewline
13 & 0.171313 & 1.4435 & 0.076638 \tabularnewline
14 & -0.16939 & -1.4273 & 0.078937 \tabularnewline
15 & -0.261996 & -2.2076 & 0.015252 \tabularnewline
16 & -0.204539 & -1.7235 & 0.044577 \tabularnewline
17 & 0.06428 & 0.5416 & 0.294884 \tabularnewline
18 & 0.124201 & 1.0465 & 0.149432 \tabularnewline
19 & 0.030164 & 0.2542 & 0.40005 \tabularnewline
20 & -0.230959 & -1.9461 & 0.027801 \tabularnewline
21 & -0.231374 & -1.9496 & 0.027587 \tabularnewline
22 & -0.094204 & -0.7938 & 0.214986 \tabularnewline
23 & 0.18391 & 1.5497 & 0.062836 \tabularnewline
24 & 0.548043 & 4.6179 & 8e-06 \tabularnewline
25 & 0.113413 & 0.9556 & 0.17125 \tabularnewline
26 & -0.187753 & -1.582 & 0.059043 \tabularnewline
27 & -0.266473 & -2.2453 & 0.013931 \tabularnewline
28 & -0.156614 & -1.3197 & 0.095595 \tabularnewline
29 & 0.051457 & 0.4336 & 0.332953 \tabularnewline
30 & 0.090884 & 0.7658 & 0.223166 \tabularnewline
31 & 0.014004 & 0.118 & 0.453199 \tabularnewline
32 & -0.189422 & -1.5961 & 0.057455 \tabularnewline
33 & -0.145846 & -1.2289 & 0.11158 \tabularnewline
34 & -0.066491 & -0.5603 & 0.288533 \tabularnewline
35 & 0.125265 & 1.0555 & 0.147386 \tabularnewline
36 & 0.416194 & 3.5069 & 0.000395 \tabularnewline
37 & 0.084379 & 0.711 & 0.239709 \tabularnewline
38 & -0.176477 & -1.487 & 0.070719 \tabularnewline
39 & -0.220396 & -1.8571 & 0.033723 \tabularnewline
40 & -0.104234 & -0.8783 & 0.191375 \tabularnewline
41 & 0.04157 & 0.3503 & 0.363585 \tabularnewline
42 & 0.095533 & 0.805 & 0.211761 \tabularnewline
43 & -0.003171 & -0.0267 & 0.489381 \tabularnewline
44 & -0.153435 & -1.2929 & 0.100124 \tabularnewline
45 & -0.107019 & -0.9018 & 0.185118 \tabularnewline
46 & -0.063809 & -0.5377 & 0.296244 \tabularnewline
47 & 0.071062 & 0.5988 & 0.275613 \tabularnewline
48 & 0.287794 & 2.425 & 0.008927 \tabularnewline
\hline
\end{tabular}
%Source: https://freestatistics.org/blog/index.php?pk=41527&T=1

[TABLE]
[ROW][C]Autocorrelation Function[/C][/ROW]
[ROW][C]Time lag k[/C][C]ACF(k)[/C][C]T-STAT[/C][C]P-value[/C][/ROW]
[ROW][C]1[/C][C]0.264075[/C][C]2.2251[/C][C]0.014625[/C][/ROW]
[ROW][C]2[/C][C]-0.199348[/C][C]-1.6797[/C][C]0.048702[/C][/ROW]
[ROW][C]3[/C][C]-0.304383[/C][C]-2.5648[/C][C]0.00622[/C][/ROW]
[ROW][C]4[/C][C]-0.251231[/C][C]-2.1169[/C][C]0.018886[/C][/ROW]
[ROW][C]5[/C][C]0.084518[/C][C]0.7122[/C][C]0.239348[/C][/ROW]
[ROW][C]6[/C][C]0.200259[/C][C]1.6874[/C][C]0.047957[/C][/ROW]
[ROW][C]7[/C][C]0.053055[/C][C]0.4471[/C][C]0.3281[/C][/ROW]
[ROW][C]8[/C][C]-0.24202[/C][C]-2.0393[/C][C]0.022572[/C][/ROW]
[ROW][C]9[/C][C]-0.277797[/C][C]-2.3408[/C][C]0.011029[/C][/ROW]
[ROW][C]10[/C][C]-0.159592[/C][C]-1.3448[/C][C]0.091493[/C][/ROW]
[ROW][C]11[/C][C]0.247956[/C][C]2.0893[/C][C]0.020132[/C][/ROW]
[ROW][C]12[/C][C]0.743197[/C][C]6.2623[/C][C]0[/C][/ROW]
[ROW][C]13[/C][C]0.171313[/C][C]1.4435[/C][C]0.076638[/C][/ROW]
[ROW][C]14[/C][C]-0.16939[/C][C]-1.4273[/C][C]0.078937[/C][/ROW]
[ROW][C]15[/C][C]-0.261996[/C][C]-2.2076[/C][C]0.015252[/C][/ROW]
[ROW][C]16[/C][C]-0.204539[/C][C]-1.7235[/C][C]0.044577[/C][/ROW]
[ROW][C]17[/C][C]0.06428[/C][C]0.5416[/C][C]0.294884[/C][/ROW]
[ROW][C]18[/C][C]0.124201[/C][C]1.0465[/C][C]0.149432[/C][/ROW]
[ROW][C]19[/C][C]0.030164[/C][C]0.2542[/C][C]0.40005[/C][/ROW]
[ROW][C]20[/C][C]-0.230959[/C][C]-1.9461[/C][C]0.027801[/C][/ROW]
[ROW][C]21[/C][C]-0.231374[/C][C]-1.9496[/C][C]0.027587[/C][/ROW]
[ROW][C]22[/C][C]-0.094204[/C][C]-0.7938[/C][C]0.214986[/C][/ROW]
[ROW][C]23[/C][C]0.18391[/C][C]1.5497[/C][C]0.062836[/C][/ROW]
[ROW][C]24[/C][C]0.548043[/C][C]4.6179[/C][C]8e-06[/C][/ROW]
[ROW][C]25[/C][C]0.113413[/C][C]0.9556[/C][C]0.17125[/C][/ROW]
[ROW][C]26[/C][C]-0.187753[/C][C]-1.582[/C][C]0.059043[/C][/ROW]
[ROW][C]27[/C][C]-0.266473[/C][C]-2.2453[/C][C]0.013931[/C][/ROW]
[ROW][C]28[/C][C]-0.156614[/C][C]-1.3197[/C][C]0.095595[/C][/ROW]
[ROW][C]29[/C][C]0.051457[/C][C]0.4336[/C][C]0.332953[/C][/ROW]
[ROW][C]30[/C][C]0.090884[/C][C]0.7658[/C][C]0.223166[/C][/ROW]
[ROW][C]31[/C][C]0.014004[/C][C]0.118[/C][C]0.453199[/C][/ROW]
[ROW][C]32[/C][C]-0.189422[/C][C]-1.5961[/C][C]0.057455[/C][/ROW]
[ROW][C]33[/C][C]-0.145846[/C][C]-1.2289[/C][C]0.11158[/C][/ROW]
[ROW][C]34[/C][C]-0.066491[/C][C]-0.5603[/C][C]0.288533[/C][/ROW]
[ROW][C]35[/C][C]0.125265[/C][C]1.0555[/C][C]0.147386[/C][/ROW]
[ROW][C]36[/C][C]0.416194[/C][C]3.5069[/C][C]0.000395[/C][/ROW]
[ROW][C]37[/C][C]0.084379[/C][C]0.711[/C][C]0.239709[/C][/ROW]
[ROW][C]38[/C][C]-0.176477[/C][C]-1.487[/C][C]0.070719[/C][/ROW]
[ROW][C]39[/C][C]-0.220396[/C][C]-1.8571[/C][C]0.033723[/C][/ROW]
[ROW][C]40[/C][C]-0.104234[/C][C]-0.8783[/C][C]0.191375[/C][/ROW]
[ROW][C]41[/C][C]0.04157[/C][C]0.3503[/C][C]0.363585[/C][/ROW]
[ROW][C]42[/C][C]0.095533[/C][C]0.805[/C][C]0.211761[/C][/ROW]
[ROW][C]43[/C][C]-0.003171[/C][C]-0.0267[/C][C]0.489381[/C][/ROW]
[ROW][C]44[/C][C]-0.153435[/C][C]-1.2929[/C][C]0.100124[/C][/ROW]
[ROW][C]45[/C][C]-0.107019[/C][C]-0.9018[/C][C]0.185118[/C][/ROW]
[ROW][C]46[/C][C]-0.063809[/C][C]-0.5377[/C][C]0.296244[/C][/ROW]
[ROW][C]47[/C][C]0.071062[/C][C]0.5988[/C][C]0.275613[/C][/ROW]
[ROW][C]48[/C][C]0.287794[/C][C]2.425[/C][C]0.008927[/C][/ROW]
[/TABLE]
Source: https://freestatistics.org/blog/index.php?pk=41527&T=1

Globally Unique Identifier (entire table): ba.freestatistics.org/blog/index.php?pk=41527&T=1

As an alternative you can also use a QR Code:  

The GUIDs for individual cells are displayed in the table below:

Autocorrelation Function
Time lag kACF(k)T-STATP-value
10.2640752.22510.014625
2-0.199348-1.67970.048702
3-0.304383-2.56480.00622
4-0.251231-2.11690.018886
50.0845180.71220.239348
60.2002591.68740.047957
70.0530550.44710.3281
8-0.24202-2.03930.022572
9-0.277797-2.34080.011029
10-0.159592-1.34480.091493
110.2479562.08930.020132
120.7431976.26230
130.1713131.44350.076638
14-0.16939-1.42730.078937
15-0.261996-2.20760.015252
16-0.204539-1.72350.044577
170.064280.54160.294884
180.1242011.04650.149432
190.0301640.25420.40005
20-0.230959-1.94610.027801
21-0.231374-1.94960.027587
22-0.094204-0.79380.214986
230.183911.54970.062836
240.5480434.61798e-06
250.1134130.95560.17125
26-0.187753-1.5820.059043
27-0.266473-2.24530.013931
28-0.156614-1.31970.095595
290.0514570.43360.332953
300.0908840.76580.223166
310.0140040.1180.453199
32-0.189422-1.59610.057455
33-0.145846-1.22890.11158
34-0.066491-0.56030.288533
350.1252651.05550.147386
360.4161943.50690.000395
370.0843790.7110.239709
38-0.176477-1.4870.070719
39-0.220396-1.85710.033723
40-0.104234-0.87830.191375
410.041570.35030.363585
420.0955330.8050.211761
43-0.003171-0.02670.489381
44-0.153435-1.29290.100124
45-0.107019-0.90180.185118
46-0.063809-0.53770.296244
470.0710620.59880.275613
480.2877942.4250.008927


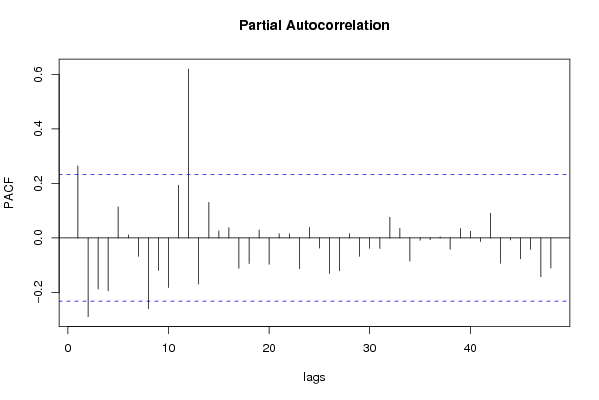
Partial Autocorrelation Function
Time lag kPACF(k)T-STATP-value
10.2640752.22510.014625
2-0.289256-2.43730.008652
3-0.187848-1.58280.058952
4-0.193891-1.63380.053369
50.1139590.96020.170098
60.0103950.08760.465226
7-0.06738-0.56780.285996
8-0.260448-2.19460.015733
9-0.119464-1.00660.158767
10-0.182263-1.53580.064519
110.1932221.62810.053965
120.6204765.22821e-06
13-0.169333-1.42680.079006
140.1303671.09850.13785
150.0257040.21660.414575
160.0376780.31750.375904
17-0.111364-0.93840.175619
18-0.094197-0.79370.215002
190.0294330.2480.402423
20-0.096883-0.81630.208516
210.0155870.13130.447941
220.0147570.12430.450696
23-0.113332-0.9550.171421
240.0384010.32360.373608
25-0.037355-0.31480.376935
26-0.130622-1.10060.137384
27-0.120906-1.01880.155885
280.0158710.13370.446998
29-0.067767-0.5710.284896
30-0.038284-0.32260.373978
31-0.038668-0.32580.372758
320.0761270.64150.261646
330.0346050.29160.385726
34-0.084892-0.71530.238382
35-0.008719-0.07350.470821
36-0.006639-0.05590.477774
370.0031860.02680.48933
38-0.041511-0.34980.363769
390.0344250.29010.386303
400.0240270.20250.420071
41-0.013061-0.11010.456339
420.0908260.76530.223312
43-0.092704-0.78110.218658
44-0.007333-0.06180.475451
45-0.076926-0.64820.259475
46-0.042211-0.35570.361569
47-0.142864-1.20380.116334
48-0.110671-0.93250.177111

\begin{tabular}{lllllllll}
\hline
Partial Autocorrelation Function \tabularnewline
Time lag k & PACF(k) & T-STAT & P-value \tabularnewline
1 & 0.264075 & 2.2251 & 0.014625 \tabularnewline
2 & -0.289256 & -2.4373 & 0.008652 \tabularnewline
3 & -0.187848 & -1.5828 & 0.058952 \tabularnewline
4 & -0.193891 & -1.6338 & 0.053369 \tabularnewline
5 & 0.113959 & 0.9602 & 0.170098 \tabularnewline
6 & 0.010395 & 0.0876 & 0.465226 \tabularnewline
7 & -0.06738 & -0.5678 & 0.285996 \tabularnewline
8 & -0.260448 & -2.1946 & 0.015733 \tabularnewline
9 & -0.119464 & -1.0066 & 0.158767 \tabularnewline
10 & -0.182263 & -1.5358 & 0.064519 \tabularnewline
11 & 0.193222 & 1.6281 & 0.053965 \tabularnewline
12 & 0.620476 & 5.2282 & 1e-06 \tabularnewline
13 & -0.169333 & -1.4268 & 0.079006 \tabularnewline
14 & 0.130367 & 1.0985 & 0.13785 \tabularnewline
15 & 0.025704 & 0.2166 & 0.414575 \tabularnewline
16 & 0.037678 & 0.3175 & 0.375904 \tabularnewline
17 & -0.111364 & -0.9384 & 0.175619 \tabularnewline
18 & -0.094197 & -0.7937 & 0.215002 \tabularnewline
19 & 0.029433 & 0.248 & 0.402423 \tabularnewline
20 & -0.096883 & -0.8163 & 0.208516 \tabularnewline
21 & 0.015587 & 0.1313 & 0.447941 \tabularnewline
22 & 0.014757 & 0.1243 & 0.450696 \tabularnewline
23 & -0.113332 & -0.955 & 0.171421 \tabularnewline
24 & 0.038401 & 0.3236 & 0.373608 \tabularnewline
25 & -0.037355 & -0.3148 & 0.376935 \tabularnewline
26 & -0.130622 & -1.1006 & 0.137384 \tabularnewline
27 & -0.120906 & -1.0188 & 0.155885 \tabularnewline
28 & 0.015871 & 0.1337 & 0.446998 \tabularnewline
29 & -0.067767 & -0.571 & 0.284896 \tabularnewline
30 & -0.038284 & -0.3226 & 0.373978 \tabularnewline
31 & -0.038668 & -0.3258 & 0.372758 \tabularnewline
32 & 0.076127 & 0.6415 & 0.261646 \tabularnewline
33 & 0.034605 & 0.2916 & 0.385726 \tabularnewline
34 & -0.084892 & -0.7153 & 0.238382 \tabularnewline
35 & -0.008719 & -0.0735 & 0.470821 \tabularnewline
36 & -0.006639 & -0.0559 & 0.477774 \tabularnewline
37 & 0.003186 & 0.0268 & 0.48933 \tabularnewline
38 & -0.041511 & -0.3498 & 0.363769 \tabularnewline
39 & 0.034425 & 0.2901 & 0.386303 \tabularnewline
40 & 0.024027 & 0.2025 & 0.420071 \tabularnewline
41 & -0.013061 & -0.1101 & 0.456339 \tabularnewline
42 & 0.090826 & 0.7653 & 0.223312 \tabularnewline
43 & -0.092704 & -0.7811 & 0.218658 \tabularnewline
44 & -0.007333 & -0.0618 & 0.475451 \tabularnewline
45 & -0.076926 & -0.6482 & 0.259475 \tabularnewline
46 & -0.042211 & -0.3557 & 0.361569 \tabularnewline
47 & -0.142864 & -1.2038 & 0.116334 \tabularnewline
48 & -0.110671 & -0.9325 & 0.177111 \tabularnewline
\hline
\end{tabular}
%Source: https://freestatistics.org/blog/index.php?pk=41527&T=2

[TABLE]
[ROW][C]Partial Autocorrelation Function[/C][/ROW]
[ROW][C]Time lag k[/C][C]PACF(k)[/C][C]T-STAT[/C][C]P-value[/C][/ROW]
[ROW][C]1[/C][C]0.264075[/C][C]2.2251[/C][C]0.014625[/C][/ROW]
[ROW][C]2[/C][C]-0.289256[/C][C]-2.4373[/C][C]0.008652[/C][/ROW]
[ROW][C]3[/C][C]-0.187848[/C][C]-1.5828[/C][C]0.058952[/C][/ROW]
[ROW][C]4[/C][C]-0.193891[/C][C]-1.6338[/C][C]0.053369[/C][/ROW]
[ROW][C]5[/C][C]0.113959[/C][C]0.9602[/C][C]0.170098[/C][/ROW]
[ROW][C]6[/C][C]0.010395[/C][C]0.0876[/C][C]0.465226[/C][/ROW]
[ROW][C]7[/C][C]-0.06738[/C][C]-0.5678[/C][C]0.285996[/C][/ROW]
[ROW][C]8[/C][C]-0.260448[/C][C]-2.1946[/C][C]0.015733[/C][/ROW]
[ROW][C]9[/C][C]-0.119464[/C][C]-1.0066[/C][C]0.158767[/C][/ROW]
[ROW][C]10[/C][C]-0.182263[/C][C]-1.5358[/C][C]0.064519[/C][/ROW]
[ROW][C]11[/C][C]0.193222[/C][C]1.6281[/C][C]0.053965[/C][/ROW]
[ROW][C]12[/C][C]0.620476[/C][C]5.2282[/C][C]1e-06[/C][/ROW]
[ROW][C]13[/C][C]-0.169333[/C][C]-1.4268[/C][C]0.079006[/C][/ROW]
[ROW][C]14[/C][C]0.130367[/C][C]1.0985[/C][C]0.13785[/C][/ROW]
[ROW][C]15[/C][C]0.025704[/C][C]0.2166[/C][C]0.414575[/C][/ROW]
[ROW][C]16[/C][C]0.037678[/C][C]0.3175[/C][C]0.375904[/C][/ROW]
[ROW][C]17[/C][C]-0.111364[/C][C]-0.9384[/C][C]0.175619[/C][/ROW]
[ROW][C]18[/C][C]-0.094197[/C][C]-0.7937[/C][C]0.215002[/C][/ROW]
[ROW][C]19[/C][C]0.029433[/C][C]0.248[/C][C]0.402423[/C][/ROW]
[ROW][C]20[/C][C]-0.096883[/C][C]-0.8163[/C][C]0.208516[/C][/ROW]
[ROW][C]21[/C][C]0.015587[/C][C]0.1313[/C][C]0.447941[/C][/ROW]
[ROW][C]22[/C][C]0.014757[/C][C]0.1243[/C][C]0.450696[/C][/ROW]
[ROW][C]23[/C][C]-0.113332[/C][C]-0.955[/C][C]0.171421[/C][/ROW]
[ROW][C]24[/C][C]0.038401[/C][C]0.3236[/C][C]0.373608[/C][/ROW]
[ROW][C]25[/C][C]-0.037355[/C][C]-0.3148[/C][C]0.376935[/C][/ROW]
[ROW][C]26[/C][C]-0.130622[/C][C]-1.1006[/C][C]0.137384[/C][/ROW]
[ROW][C]27[/C][C]-0.120906[/C][C]-1.0188[/C][C]0.155885[/C][/ROW]
[ROW][C]28[/C][C]0.015871[/C][C]0.1337[/C][C]0.446998[/C][/ROW]
[ROW][C]29[/C][C]-0.067767[/C][C]-0.571[/C][C]0.284896[/C][/ROW]
[ROW][C]30[/C][C]-0.038284[/C][C]-0.3226[/C][C]0.373978[/C][/ROW]
[ROW][C]31[/C][C]-0.038668[/C][C]-0.3258[/C][C]0.372758[/C][/ROW]
[ROW][C]32[/C][C]0.076127[/C][C]0.6415[/C][C]0.261646[/C][/ROW]
[ROW][C]33[/C][C]0.034605[/C][C]0.2916[/C][C]0.385726[/C][/ROW]
[ROW][C]34[/C][C]-0.084892[/C][C]-0.7153[/C][C]0.238382[/C][/ROW]
[ROW][C]35[/C][C]-0.008719[/C][C]-0.0735[/C][C]0.470821[/C][/ROW]
[ROW][C]36[/C][C]-0.006639[/C][C]-0.0559[/C][C]0.477774[/C][/ROW]
[ROW][C]37[/C][C]0.003186[/C][C]0.0268[/C][C]0.48933[/C][/ROW]
[ROW][C]38[/C][C]-0.041511[/C][C]-0.3498[/C][C]0.363769[/C][/ROW]
[ROW][C]39[/C][C]0.034425[/C][C]0.2901[/C][C]0.386303[/C][/ROW]
[ROW][C]40[/C][C]0.024027[/C][C]0.2025[/C][C]0.420071[/C][/ROW]
[ROW][C]41[/C][C]-0.013061[/C][C]-0.1101[/C][C]0.456339[/C][/ROW]
[ROW][C]42[/C][C]0.090826[/C][C]0.7653[/C][C]0.223312[/C][/ROW]
[ROW][C]43[/C][C]-0.092704[/C][C]-0.7811[/C][C]0.218658[/C][/ROW]
[ROW][C]44[/C][C]-0.007333[/C][C]-0.0618[/C][C]0.475451[/C][/ROW]
[ROW][C]45[/C][C]-0.076926[/C][C]-0.6482[/C][C]0.259475[/C][/ROW]
[ROW][C]46[/C][C]-0.042211[/C][C]-0.3557[/C][C]0.361569[/C][/ROW]
[ROW][C]47[/C][C]-0.142864[/C][C]-1.2038[/C][C]0.116334[/C][/ROW]
[ROW][C]48[/C][C]-0.110671[/C][C]-0.9325[/C][C]0.177111[/C][/ROW]
[/TABLE]
Source: https://freestatistics.org/blog/index.php?pk=41527&T=2

Globally Unique Identifier (entire table): ba.freestatistics.org/blog/index.php?pk=41527&T=2

As an alternative you can also use a QR Code:  

The GUIDs for individual cells are displayed in the table below:

Partial Autocorrelation Function
Time lag kPACF(k)T-STATP-value
10.2640752.22510.014625
2-0.289256-2.43730.008652
3-0.187848-1.58280.058952
4-0.193891-1.63380.053369
50.1139590.96020.170098
60.0103950.08760.465226
7-0.06738-0.56780.285996
8-0.260448-2.19460.015733
9-0.119464-1.00660.158767
10-0.182263-1.53580.064519
110.1932221.62810.053965
120.6204765.22821e-06
13-0.169333-1.42680.079006
140.1303671.09850.13785
150.0257040.21660.414575
160.0376780.31750.375904
17-0.111364-0.93840.175619
18-0.094197-0.79370.215002
190.0294330.2480.402423
20-0.096883-0.81630.208516
210.0155870.13130.447941
220.0147570.12430.450696
23-0.113332-0.9550.171421
240.0384010.32360.373608
25-0.037355-0.31480.376935
26-0.130622-1.10060.137384
27-0.120906-1.01880.155885
280.0158710.13370.446998
29-0.067767-0.5710.284896
30-0.038284-0.32260.373978
31-0.038668-0.32580.372758
320.0761270.64150.261646
330.0346050.29160.385726
34-0.084892-0.71530.238382
35-0.008719-0.07350.470821
36-0.006639-0.05590.477774
370.0031860.02680.48933
38-0.041511-0.34980.363769
390.0344250.29010.386303
400.0240270.20250.420071
41-0.013061-0.11010.456339
420.0908260.76530.223312
43-0.092704-0.78110.218658
44-0.007333-0.06180.475451
45-0.076926-0.64820.259475
46-0.042211-0.35570.361569
47-0.142864-1.20380.116334
48-0.110671-0.93250.177111


Parameters (Session):
par1 = 48 ; par2 = 1 ; par3 = 1 ; par4 = 0 ; par5 = 12 ;
Parameters (R input):
par1 = 48 ; par2 = 1 ; par3 = 1 ; par4 = 0 ; par5 = 12 ;
R code (references can be found in the software module):
if (par1 == 'Default') {
par1 = 10*log10(length(x))
} else {
par1 <- as.numeric(par1)
}
par2 <- as.numeric(par2)
par3 <- as.numeric(par3)
par4 <- as.numeric(par4)
par5 <- as.numeric(par5)
if (par2 == 0) {
x <- log(x)
} else {
x <- (x ^ par2 - 1) / par2
}
if (par3 > 0) x <- diff(x,lag=1,difference=par3)
if (par4 > 0) x <- diff(x,lag=par5,difference=par4)
bitmap(file='pic1.png')
racf <- acf(x,par1,main='Autocorrelation',xlab='lags',ylab='ACF')
dev.off()
bitmap(file='pic2.png')
rpacf <- pacf(x,par1,main='Partial Autocorrelation',xlab='lags',ylab='PACF')
dev.off()
(myacf <- c(racf$acf))
(mypacf <- c(rpacf$acf))
lengthx <- length(x)
sqrtn <- sqrt(lengthx)
load(file='createtable')
a<-table.start()
a<-table.row.start(a)
a<-table.element(a,'Autocorrelation Function',4,TRUE)
a<-table.row.end(a)
a<-table.row.start(a)
a<-table.element(a,'Time lag k',header=TRUE)
a<-table.element(a,hyperlink('basics.htm','ACF(k)','click here for more information about the Autocorrelation Function'),header=TRUE)
a<-table.element(a,'T-STAT',header=TRUE)
a<-table.element(a,'P-value',header=TRUE)
a<-table.row.end(a)
for (i in 2:(par1+1)) {
a<-table.row.start(a)
a<-table.element(a,i-1,header=TRUE)
a<-table.element(a,round(myacf[i],6))
mytstat <- myacf[i]*sqrtn
a<-table.element(a,round(mytstat,4))
a<-table.element(a,round(1-pt(abs(mytstat),lengthx),6))
a<-table.row.end(a)
}
a<-table.end(a)
table.save(a,file='mytable.tab')
a<-table.start()
a<-table.row.start(a)
a<-table.element(a,'Partial Autocorrelation Function',4,TRUE)
a<-table.row.end(a)
a<-table.row.start(a)
a<-table.element(a,'Time lag k',header=TRUE)
a<-table.element(a,hyperlink('basics.htm','PACF(k)','click here for more information about the Partial Autocorrelation Function'),header=TRUE)
a<-table.element(a,'T-STAT',header=TRUE)
a<-table.element(a,'P-value',header=TRUE)
a<-table.row.end(a)
for (i in 1:par1) {
a<-table.row.start(a)
a<-table.element(a,i,header=TRUE)
a<-table.element(a,round(mypacf[i],6))
mytstat <- mypacf[i]*sqrtn
a<-table.element(a,round(mytstat,4))
a<-table.element(a,round(1-pt(abs(mytstat),lengthx),6))
a<-table.row.end(a)
}
a<-table.end(a)
table.save(a,file='mytable1.tab')