Free Statistics

of Irreproducible Research!

Author's title

Author*Unverified author*
R Software Modulerwasp_autocorrelation.wasp
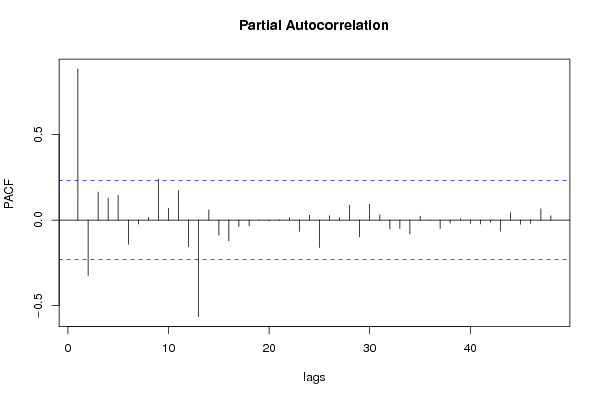
Title produced by software(Partial) Autocorrelation Function
Date of computationWed, 03 Jun 2009 13:08:31 -0600
Cite this page as followsStatistical Computations at FreeStatistics.org, Office for Research Development and Education, URL https://freestatistics.org/blog/index.php?v=date/2009/Jun/03/t1244056147g0om1t3i5wrv5tu.htm/, Retrieved Sat, 11 May 2024 18:39:00 +0000
Statistical Computations at FreeStatistics.org, Office for Research Development and Education, URL https://freestatistics.org/blog/index.php?pk=41522, Retrieved Sat, 11 May 2024 18:39:00 +0000
QR Codes:

Original text written by user:
IsPrivate?No (this computation is public)
User-defined keywordsFilip Bosschaerts
Estimated Impact115
Family? (F = Feedback message, R = changed R code, M = changed R Module, P = changed Parameters, D = changed Data)
-       [(Partial) Autocorrelation Function] [Opdracht 6 bis de...] [2009-06-03 19:08:31] [d41d8cd98f00b204e9800998ecf8427e] [Current]
Feedback Forum

Post a new message
Dataseries X:
516141
501866
506174
517945
533590
528379
477580
469357
490243
492622
507561
516922
514258
509846
527070
541657
564591
555362
498662
511038
525919
531673
548854
560576
557274
565742
587625
619916
625809
619567
572942
572775
574205
579799
590072
593408
597141
595404
612117
628232
628884
620735
569028
567456
573100
584428
589379
590865
595454
594167
611324
612613
610763
593530
542722
536662
543599
555332
560854
562325
554788
547344
565464
577992
579714
569323
506971
500857
509127
509933
517009
519164


Summary of computational transaction
Raw Inputview raw input (R code)
Raw Outputview raw output of R engine
Computing time1 seconds
R Server'George Udny Yule' @ 72.249.76.132

\begin{tabular}{lllllllll}
\hline
Summary of computational transaction \tabularnewline
Raw Input & view raw input (R code)  \tabularnewline
Raw Output & view raw output of R engine  \tabularnewline
Computing time & 1 seconds \tabularnewline
R Server & 'George Udny Yule' @ 72.249.76.132 \tabularnewline
\hline
\end{tabular}
%Source: https://freestatistics.org/blog/index.php?pk=41522&T=0

[TABLE]
[ROW][C]Summary of computational transaction[/C][/ROW]
[ROW][C]Raw Input[/C][C]view raw input (R code) [/C][/ROW]
[ROW][C]Raw Output[/C][C]view raw output of R engine [/C][/ROW]
[ROW][C]Computing time[/C][C]1 seconds[/C][/ROW]
[ROW][C]R Server[/C][C]'George Udny Yule' @ 72.249.76.132[/C][/ROW]
[/TABLE]
Source: https://freestatistics.org/blog/index.php?pk=41522&T=0

Globally Unique Identifier (entire table): ba.freestatistics.org/blog/index.php?pk=41522&T=0

As an alternative you can also use a QR Code:  

The GUIDs for individual cells are displayed in the table below:

Summary of computational transaction
Raw Inputview raw input (R code)
Raw Outputview raw output of R engine
Computing time1 seconds
R Server'George Udny Yule' @ 72.249.76.132


Autocorrelation Function
Time lag kACF(k)T-STATP-value
10.8826757.48970
20.7075126.00340
30.5731624.86343e-06
40.5046514.28212.8e-05
50.4937064.18923.9e-05
60.4667973.96098.7e-05
70.4062513.44720.000475
80.3374752.86360.002742
90.3239462.74880.003778
100.3640173.08880.001427
110.4357493.69750.000211
120.4601923.90490.000105
130.3291812.79320.003341
140.1607621.36410.08839
150.0295090.25040.401497
16-0.04737-0.4020.344455
17-0.075751-0.64280.261209
18-0.117059-0.99330.16195
19-0.180674-1.53310.064821
20-0.239712-2.0340.022817
21-0.246553-2.09210.019979
22-0.205468-1.74350.042762
23-0.147031-1.24760.108111
24-0.124544-1.05680.14707
25-0.22022-1.86860.032872
26-0.33822-2.86990.002693
27-0.41435-3.51590.000381
28-0.431178-3.65870.00024
29-0.414224-3.51480.000383
30-0.408806-3.46880.000443
31-0.416797-3.53660.000357
32-0.423985-3.59760.000293
33-0.391319-3.32040.000707
34-0.333-2.82560.003052
35-0.264408-2.24360.013968
36-0.221267-1.87750.032249
37-0.266898-2.26470.013271
38-0.331636-2.8140.003152
39-0.359441-3.050.001601
40-0.338986-2.87640.002644
41-0.295512-2.50750.007207
42-0.262201-2.22480.014613
43-0.246414-2.09090.020034
44-0.228319-1.93740.028313
45-0.178829-1.51740.066771
46-0.116553-0.9890.162992
47-0.047776-0.40540.343197
480.003130.02660.489442

\begin{tabular}{lllllllll}
\hline
Autocorrelation Function \tabularnewline
Time lag k & ACF(k) & T-STAT & P-value \tabularnewline
1 & 0.882675 & 7.4897 & 0 \tabularnewline
2 & 0.707512 & 6.0034 & 0 \tabularnewline
3 & 0.573162 & 4.8634 & 3e-06 \tabularnewline
4 & 0.504651 & 4.2821 & 2.8e-05 \tabularnewline
5 & 0.493706 & 4.1892 & 3.9e-05 \tabularnewline
6 & 0.466797 & 3.9609 & 8.7e-05 \tabularnewline
7 & 0.406251 & 3.4472 & 0.000475 \tabularnewline
8 & 0.337475 & 2.8636 & 0.002742 \tabularnewline
9 & 0.323946 & 2.7488 & 0.003778 \tabularnewline
10 & 0.364017 & 3.0888 & 0.001427 \tabularnewline
11 & 0.435749 & 3.6975 & 0.000211 \tabularnewline
12 & 0.460192 & 3.9049 & 0.000105 \tabularnewline
13 & 0.329181 & 2.7932 & 0.003341 \tabularnewline
14 & 0.160762 & 1.3641 & 0.08839 \tabularnewline
15 & 0.029509 & 0.2504 & 0.401497 \tabularnewline
16 & -0.04737 & -0.402 & 0.344455 \tabularnewline
17 & -0.075751 & -0.6428 & 0.261209 \tabularnewline
18 & -0.117059 & -0.9933 & 0.16195 \tabularnewline
19 & -0.180674 & -1.5331 & 0.064821 \tabularnewline
20 & -0.239712 & -2.034 & 0.022817 \tabularnewline
21 & -0.246553 & -2.0921 & 0.019979 \tabularnewline
22 & -0.205468 & -1.7435 & 0.042762 \tabularnewline
23 & -0.147031 & -1.2476 & 0.108111 \tabularnewline
24 & -0.124544 & -1.0568 & 0.14707 \tabularnewline
25 & -0.22022 & -1.8686 & 0.032872 \tabularnewline
26 & -0.33822 & -2.8699 & 0.002693 \tabularnewline
27 & -0.41435 & -3.5159 & 0.000381 \tabularnewline
28 & -0.431178 & -3.6587 & 0.00024 \tabularnewline
29 & -0.414224 & -3.5148 & 0.000383 \tabularnewline
30 & -0.408806 & -3.4688 & 0.000443 \tabularnewline
31 & -0.416797 & -3.5366 & 0.000357 \tabularnewline
32 & -0.423985 & -3.5976 & 0.000293 \tabularnewline
33 & -0.391319 & -3.3204 & 0.000707 \tabularnewline
34 & -0.333 & -2.8256 & 0.003052 \tabularnewline
35 & -0.264408 & -2.2436 & 0.013968 \tabularnewline
36 & -0.221267 & -1.8775 & 0.032249 \tabularnewline
37 & -0.266898 & -2.2647 & 0.013271 \tabularnewline
38 & -0.331636 & -2.814 & 0.003152 \tabularnewline
39 & -0.359441 & -3.05 & 0.001601 \tabularnewline
40 & -0.338986 & -2.8764 & 0.002644 \tabularnewline
41 & -0.295512 & -2.5075 & 0.007207 \tabularnewline
42 & -0.262201 & -2.2248 & 0.014613 \tabularnewline
43 & -0.246414 & -2.0909 & 0.020034 \tabularnewline
44 & -0.228319 & -1.9374 & 0.028313 \tabularnewline
45 & -0.178829 & -1.5174 & 0.066771 \tabularnewline
46 & -0.116553 & -0.989 & 0.162992 \tabularnewline
47 & -0.047776 & -0.4054 & 0.343197 \tabularnewline
48 & 0.00313 & 0.0266 & 0.489442 \tabularnewline
\hline
\end{tabular}
%Source: https://freestatistics.org/blog/index.php?pk=41522&T=1

[TABLE]
[ROW][C]Autocorrelation Function[/C][/ROW]
[ROW][C]Time lag k[/C][C]ACF(k)[/C][C]T-STAT[/C][C]P-value[/C][/ROW]
[ROW][C]1[/C][C]0.882675[/C][C]7.4897[/C][C]0[/C][/ROW]
[ROW][C]2[/C][C]0.707512[/C][C]6.0034[/C][C]0[/C][/ROW]
[ROW][C]3[/C][C]0.573162[/C][C]4.8634[/C][C]3e-06[/C][/ROW]
[ROW][C]4[/C][C]0.504651[/C][C]4.2821[/C][C]2.8e-05[/C][/ROW]
[ROW][C]5[/C][C]0.493706[/C][C]4.1892[/C][C]3.9e-05[/C][/ROW]
[ROW][C]6[/C][C]0.466797[/C][C]3.9609[/C][C]8.7e-05[/C][/ROW]
[ROW][C]7[/C][C]0.406251[/C][C]3.4472[/C][C]0.000475[/C][/ROW]
[ROW][C]8[/C][C]0.337475[/C][C]2.8636[/C][C]0.002742[/C][/ROW]
[ROW][C]9[/C][C]0.323946[/C][C]2.7488[/C][C]0.003778[/C][/ROW]
[ROW][C]10[/C][C]0.364017[/C][C]3.0888[/C][C]0.001427[/C][/ROW]
[ROW][C]11[/C][C]0.435749[/C][C]3.6975[/C][C]0.000211[/C][/ROW]
[ROW][C]12[/C][C]0.460192[/C][C]3.9049[/C][C]0.000105[/C][/ROW]
[ROW][C]13[/C][C]0.329181[/C][C]2.7932[/C][C]0.003341[/C][/ROW]
[ROW][C]14[/C][C]0.160762[/C][C]1.3641[/C][C]0.08839[/C][/ROW]
[ROW][C]15[/C][C]0.029509[/C][C]0.2504[/C][C]0.401497[/C][/ROW]
[ROW][C]16[/C][C]-0.04737[/C][C]-0.402[/C][C]0.344455[/C][/ROW]
[ROW][C]17[/C][C]-0.075751[/C][C]-0.6428[/C][C]0.261209[/C][/ROW]
[ROW][C]18[/C][C]-0.117059[/C][C]-0.9933[/C][C]0.16195[/C][/ROW]
[ROW][C]19[/C][C]-0.180674[/C][C]-1.5331[/C][C]0.064821[/C][/ROW]
[ROW][C]20[/C][C]-0.239712[/C][C]-2.034[/C][C]0.022817[/C][/ROW]
[ROW][C]21[/C][C]-0.246553[/C][C]-2.0921[/C][C]0.019979[/C][/ROW]
[ROW][C]22[/C][C]-0.205468[/C][C]-1.7435[/C][C]0.042762[/C][/ROW]
[ROW][C]23[/C][C]-0.147031[/C][C]-1.2476[/C][C]0.108111[/C][/ROW]
[ROW][C]24[/C][C]-0.124544[/C][C]-1.0568[/C][C]0.14707[/C][/ROW]
[ROW][C]25[/C][C]-0.22022[/C][C]-1.8686[/C][C]0.032872[/C][/ROW]
[ROW][C]26[/C][C]-0.33822[/C][C]-2.8699[/C][C]0.002693[/C][/ROW]
[ROW][C]27[/C][C]-0.41435[/C][C]-3.5159[/C][C]0.000381[/C][/ROW]
[ROW][C]28[/C][C]-0.431178[/C][C]-3.6587[/C][C]0.00024[/C][/ROW]
[ROW][C]29[/C][C]-0.414224[/C][C]-3.5148[/C][C]0.000383[/C][/ROW]
[ROW][C]30[/C][C]-0.408806[/C][C]-3.4688[/C][C]0.000443[/C][/ROW]
[ROW][C]31[/C][C]-0.416797[/C][C]-3.5366[/C][C]0.000357[/C][/ROW]
[ROW][C]32[/C][C]-0.423985[/C][C]-3.5976[/C][C]0.000293[/C][/ROW]
[ROW][C]33[/C][C]-0.391319[/C][C]-3.3204[/C][C]0.000707[/C][/ROW]
[ROW][C]34[/C][C]-0.333[/C][C]-2.8256[/C][C]0.003052[/C][/ROW]
[ROW][C]35[/C][C]-0.264408[/C][C]-2.2436[/C][C]0.013968[/C][/ROW]
[ROW][C]36[/C][C]-0.221267[/C][C]-1.8775[/C][C]0.032249[/C][/ROW]
[ROW][C]37[/C][C]-0.266898[/C][C]-2.2647[/C][C]0.013271[/C][/ROW]
[ROW][C]38[/C][C]-0.331636[/C][C]-2.814[/C][C]0.003152[/C][/ROW]
[ROW][C]39[/C][C]-0.359441[/C][C]-3.05[/C][C]0.001601[/C][/ROW]
[ROW][C]40[/C][C]-0.338986[/C][C]-2.8764[/C][C]0.002644[/C][/ROW]
[ROW][C]41[/C][C]-0.295512[/C][C]-2.5075[/C][C]0.007207[/C][/ROW]
[ROW][C]42[/C][C]-0.262201[/C][C]-2.2248[/C][C]0.014613[/C][/ROW]
[ROW][C]43[/C][C]-0.246414[/C][C]-2.0909[/C][C]0.020034[/C][/ROW]
[ROW][C]44[/C][C]-0.228319[/C][C]-1.9374[/C][C]0.028313[/C][/ROW]
[ROW][C]45[/C][C]-0.178829[/C][C]-1.5174[/C][C]0.066771[/C][/ROW]
[ROW][C]46[/C][C]-0.116553[/C][C]-0.989[/C][C]0.162992[/C][/ROW]
[ROW][C]47[/C][C]-0.047776[/C][C]-0.4054[/C][C]0.343197[/C][/ROW]
[ROW][C]48[/C][C]0.00313[/C][C]0.0266[/C][C]0.489442[/C][/ROW]
[/TABLE]
Source: https://freestatistics.org/blog/index.php?pk=41522&T=1

Globally Unique Identifier (entire table): ba.freestatistics.org/blog/index.php?pk=41522&T=1

As an alternative you can also use a QR Code:  

The GUIDs for individual cells are displayed in the table below:

Autocorrelation Function
Time lag kACF(k)T-STATP-value
10.8826757.48970
20.7075126.00340
30.5731624.86343e-06
40.5046514.28212.8e-05
50.4937064.18923.9e-05
60.4667973.96098.7e-05
70.4062513.44720.000475
80.3374752.86360.002742
90.3239462.74880.003778
100.3640173.08880.001427
110.4357493.69750.000211
120.4601923.90490.000105
130.3291812.79320.003341
140.1607621.36410.08839
150.0295090.25040.401497
16-0.04737-0.4020.344455
17-0.075751-0.64280.261209
18-0.117059-0.99330.16195
19-0.180674-1.53310.064821
20-0.239712-2.0340.022817
21-0.246553-2.09210.019979
22-0.205468-1.74350.042762
23-0.147031-1.24760.108111
24-0.124544-1.05680.14707
25-0.22022-1.86860.032872
26-0.33822-2.86990.002693
27-0.41435-3.51590.000381
28-0.431178-3.65870.00024
29-0.414224-3.51480.000383
30-0.408806-3.46880.000443
31-0.416797-3.53660.000357
32-0.423985-3.59760.000293
33-0.391319-3.32040.000707
34-0.333-2.82560.003052
35-0.264408-2.24360.013968
36-0.221267-1.87750.032249
37-0.266898-2.26470.013271
38-0.331636-2.8140.003152
39-0.359441-3.050.001601
40-0.338986-2.87640.002644
41-0.295512-2.50750.007207
42-0.262201-2.22480.014613
43-0.246414-2.09090.020034
44-0.228319-1.93740.028313
45-0.178829-1.51740.066771
46-0.116553-0.9890.162992
47-0.047776-0.40540.343197
480.003130.02660.489442


Partial Autocorrelation Function
Time lag kPACF(k)T-STATP-value
10.8826757.48970
2-0.324171-2.75070.003758
30.1636611.38870.084601
40.1276531.08320.141173
50.1439751.22170.112909
6-0.14112-1.19740.11753
7-0.023402-0.19860.421577
80.0170470.14460.442697
90.2390952.02880.023089
100.0693060.58810.279159
110.1719981.45940.074396
12-0.156981-1.3320.093527
13-0.564176-4.78724e-06
140.0599350.50860.306305
15-0.089148-0.75640.225924
16-0.120858-1.02550.154276
17-0.037165-0.31540.376703
18-0.032849-0.27870.390623
190.0011510.00980.496117
20-0.005124-0.04350.482719
210.0023510.020.492069
220.0150030.12730.449528
23-0.066437-0.56370.287341
240.0280140.23770.406392
25-0.160679-1.36340.088502
260.0252960.21460.415328
270.0148560.12610.45002
280.08680.73650.231904
29-0.098127-0.83260.203902
300.0921430.78190.21843
310.0311910.26470.396012
32-0.051932-0.44070.33039
33-0.049333-0.41860.338375
34-0.082126-0.69690.244065
350.0229040.19430.423226
36-0.000596-0.00510.497989
37-0.049393-0.41910.338192
38-0.016742-0.14210.443715
390.0087670.07440.470454
40-0.019066-0.16180.435965
41-0.022267-0.18890.425336
42-0.014807-0.12560.450184
43-0.06468-0.54880.29241
440.0435450.36950.356422
45-0.024864-0.2110.416751
46-0.019696-0.16710.43387
470.0664550.56390.28729
480.0255370.21670.414531

\begin{tabular}{lllllllll}
\hline
Partial Autocorrelation Function \tabularnewline
Time lag k & PACF(k) & T-STAT & P-value \tabularnewline
1 & 0.882675 & 7.4897 & 0 \tabularnewline
2 & -0.324171 & -2.7507 & 0.003758 \tabularnewline
3 & 0.163661 & 1.3887 & 0.084601 \tabularnewline
4 & 0.127653 & 1.0832 & 0.141173 \tabularnewline
5 & 0.143975 & 1.2217 & 0.112909 \tabularnewline
6 & -0.14112 & -1.1974 & 0.11753 \tabularnewline
7 & -0.023402 & -0.1986 & 0.421577 \tabularnewline
8 & 0.017047 & 0.1446 & 0.442697 \tabularnewline
9 & 0.239095 & 2.0288 & 0.023089 \tabularnewline
10 & 0.069306 & 0.5881 & 0.279159 \tabularnewline
11 & 0.171998 & 1.4594 & 0.074396 \tabularnewline
12 & -0.156981 & -1.332 & 0.093527 \tabularnewline
13 & -0.564176 & -4.7872 & 4e-06 \tabularnewline
14 & 0.059935 & 0.5086 & 0.306305 \tabularnewline
15 & -0.089148 & -0.7564 & 0.225924 \tabularnewline
16 & -0.120858 & -1.0255 & 0.154276 \tabularnewline
17 & -0.037165 & -0.3154 & 0.376703 \tabularnewline
18 & -0.032849 & -0.2787 & 0.390623 \tabularnewline
19 & 0.001151 & 0.0098 & 0.496117 \tabularnewline
20 & -0.005124 & -0.0435 & 0.482719 \tabularnewline
21 & 0.002351 & 0.02 & 0.492069 \tabularnewline
22 & 0.015003 & 0.1273 & 0.449528 \tabularnewline
23 & -0.066437 & -0.5637 & 0.287341 \tabularnewline
24 & 0.028014 & 0.2377 & 0.406392 \tabularnewline
25 & -0.160679 & -1.3634 & 0.088502 \tabularnewline
26 & 0.025296 & 0.2146 & 0.415328 \tabularnewline
27 & 0.014856 & 0.1261 & 0.45002 \tabularnewline
28 & 0.0868 & 0.7365 & 0.231904 \tabularnewline
29 & -0.098127 & -0.8326 & 0.203902 \tabularnewline
30 & 0.092143 & 0.7819 & 0.21843 \tabularnewline
31 & 0.031191 & 0.2647 & 0.396012 \tabularnewline
32 & -0.051932 & -0.4407 & 0.33039 \tabularnewline
33 & -0.049333 & -0.4186 & 0.338375 \tabularnewline
34 & -0.082126 & -0.6969 & 0.244065 \tabularnewline
35 & 0.022904 & 0.1943 & 0.423226 \tabularnewline
36 & -0.000596 & -0.0051 & 0.497989 \tabularnewline
37 & -0.049393 & -0.4191 & 0.338192 \tabularnewline
38 & -0.016742 & -0.1421 & 0.443715 \tabularnewline
39 & 0.008767 & 0.0744 & 0.470454 \tabularnewline
40 & -0.019066 & -0.1618 & 0.435965 \tabularnewline
41 & -0.022267 & -0.1889 & 0.425336 \tabularnewline
42 & -0.014807 & -0.1256 & 0.450184 \tabularnewline
43 & -0.06468 & -0.5488 & 0.29241 \tabularnewline
44 & 0.043545 & 0.3695 & 0.356422 \tabularnewline
45 & -0.024864 & -0.211 & 0.416751 \tabularnewline
46 & -0.019696 & -0.1671 & 0.43387 \tabularnewline
47 & 0.066455 & 0.5639 & 0.28729 \tabularnewline
48 & 0.025537 & 0.2167 & 0.414531 \tabularnewline
\hline
\end{tabular}
%Source: https://freestatistics.org/blog/index.php?pk=41522&T=2

[TABLE]
[ROW][C]Partial Autocorrelation Function[/C][/ROW]
[ROW][C]Time lag k[/C][C]PACF(k)[/C][C]T-STAT[/C][C]P-value[/C][/ROW]
[ROW][C]1[/C][C]0.882675[/C][C]7.4897[/C][C]0[/C][/ROW]
[ROW][C]2[/C][C]-0.324171[/C][C]-2.7507[/C][C]0.003758[/C][/ROW]
[ROW][C]3[/C][C]0.163661[/C][C]1.3887[/C][C]0.084601[/C][/ROW]
[ROW][C]4[/C][C]0.127653[/C][C]1.0832[/C][C]0.141173[/C][/ROW]
[ROW][C]5[/C][C]0.143975[/C][C]1.2217[/C][C]0.112909[/C][/ROW]
[ROW][C]6[/C][C]-0.14112[/C][C]-1.1974[/C][C]0.11753[/C][/ROW]
[ROW][C]7[/C][C]-0.023402[/C][C]-0.1986[/C][C]0.421577[/C][/ROW]
[ROW][C]8[/C][C]0.017047[/C][C]0.1446[/C][C]0.442697[/C][/ROW]
[ROW][C]9[/C][C]0.239095[/C][C]2.0288[/C][C]0.023089[/C][/ROW]
[ROW][C]10[/C][C]0.069306[/C][C]0.5881[/C][C]0.279159[/C][/ROW]
[ROW][C]11[/C][C]0.171998[/C][C]1.4594[/C][C]0.074396[/C][/ROW]
[ROW][C]12[/C][C]-0.156981[/C][C]-1.332[/C][C]0.093527[/C][/ROW]
[ROW][C]13[/C][C]-0.564176[/C][C]-4.7872[/C][C]4e-06[/C][/ROW]
[ROW][C]14[/C][C]0.059935[/C][C]0.5086[/C][C]0.306305[/C][/ROW]
[ROW][C]15[/C][C]-0.089148[/C][C]-0.7564[/C][C]0.225924[/C][/ROW]
[ROW][C]16[/C][C]-0.120858[/C][C]-1.0255[/C][C]0.154276[/C][/ROW]
[ROW][C]17[/C][C]-0.037165[/C][C]-0.3154[/C][C]0.376703[/C][/ROW]
[ROW][C]18[/C][C]-0.032849[/C][C]-0.2787[/C][C]0.390623[/C][/ROW]
[ROW][C]19[/C][C]0.001151[/C][C]0.0098[/C][C]0.496117[/C][/ROW]
[ROW][C]20[/C][C]-0.005124[/C][C]-0.0435[/C][C]0.482719[/C][/ROW]
[ROW][C]21[/C][C]0.002351[/C][C]0.02[/C][C]0.492069[/C][/ROW]
[ROW][C]22[/C][C]0.015003[/C][C]0.1273[/C][C]0.449528[/C][/ROW]
[ROW][C]23[/C][C]-0.066437[/C][C]-0.5637[/C][C]0.287341[/C][/ROW]
[ROW][C]24[/C][C]0.028014[/C][C]0.2377[/C][C]0.406392[/C][/ROW]
[ROW][C]25[/C][C]-0.160679[/C][C]-1.3634[/C][C]0.088502[/C][/ROW]
[ROW][C]26[/C][C]0.025296[/C][C]0.2146[/C][C]0.415328[/C][/ROW]
[ROW][C]27[/C][C]0.014856[/C][C]0.1261[/C][C]0.45002[/C][/ROW]
[ROW][C]28[/C][C]0.0868[/C][C]0.7365[/C][C]0.231904[/C][/ROW]
[ROW][C]29[/C][C]-0.098127[/C][C]-0.8326[/C][C]0.203902[/C][/ROW]
[ROW][C]30[/C][C]0.092143[/C][C]0.7819[/C][C]0.21843[/C][/ROW]
[ROW][C]31[/C][C]0.031191[/C][C]0.2647[/C][C]0.396012[/C][/ROW]
[ROW][C]32[/C][C]-0.051932[/C][C]-0.4407[/C][C]0.33039[/C][/ROW]
[ROW][C]33[/C][C]-0.049333[/C][C]-0.4186[/C][C]0.338375[/C][/ROW]
[ROW][C]34[/C][C]-0.082126[/C][C]-0.6969[/C][C]0.244065[/C][/ROW]
[ROW][C]35[/C][C]0.022904[/C][C]0.1943[/C][C]0.423226[/C][/ROW]
[ROW][C]36[/C][C]-0.000596[/C][C]-0.0051[/C][C]0.497989[/C][/ROW]
[ROW][C]37[/C][C]-0.049393[/C][C]-0.4191[/C][C]0.338192[/C][/ROW]
[ROW][C]38[/C][C]-0.016742[/C][C]-0.1421[/C][C]0.443715[/C][/ROW]
[ROW][C]39[/C][C]0.008767[/C][C]0.0744[/C][C]0.470454[/C][/ROW]
[ROW][C]40[/C][C]-0.019066[/C][C]-0.1618[/C][C]0.435965[/C][/ROW]
[ROW][C]41[/C][C]-0.022267[/C][C]-0.1889[/C][C]0.425336[/C][/ROW]
[ROW][C]42[/C][C]-0.014807[/C][C]-0.1256[/C][C]0.450184[/C][/ROW]
[ROW][C]43[/C][C]-0.06468[/C][C]-0.5488[/C][C]0.29241[/C][/ROW]
[ROW][C]44[/C][C]0.043545[/C][C]0.3695[/C][C]0.356422[/C][/ROW]
[ROW][C]45[/C][C]-0.024864[/C][C]-0.211[/C][C]0.416751[/C][/ROW]
[ROW][C]46[/C][C]-0.019696[/C][C]-0.1671[/C][C]0.43387[/C][/ROW]
[ROW][C]47[/C][C]0.066455[/C][C]0.5639[/C][C]0.28729[/C][/ROW]
[ROW][C]48[/C][C]0.025537[/C][C]0.2167[/C][C]0.414531[/C][/ROW]
[/TABLE]
Source: https://freestatistics.org/blog/index.php?pk=41522&T=2

Globally Unique Identifier (entire table): ba.freestatistics.org/blog/index.php?pk=41522&T=2

As an alternative you can also use a QR Code:  

The GUIDs for individual cells are displayed in the table below:

Partial Autocorrelation Function
Time lag kPACF(k)T-STATP-value
10.8826757.48970
2-0.324171-2.75070.003758
30.1636611.38870.084601
40.1276531.08320.141173
50.1439751.22170.112909
6-0.14112-1.19740.11753
7-0.023402-0.19860.421577
80.0170470.14460.442697
90.2390952.02880.023089
100.0693060.58810.279159
110.1719981.45940.074396
12-0.156981-1.3320.093527
13-0.564176-4.78724e-06
140.0599350.50860.306305
15-0.089148-0.75640.225924
16-0.120858-1.02550.154276
17-0.037165-0.31540.376703
18-0.032849-0.27870.390623
190.0011510.00980.496117
20-0.005124-0.04350.482719
210.0023510.020.492069
220.0150030.12730.449528
23-0.066437-0.56370.287341
240.0280140.23770.406392
25-0.160679-1.36340.088502
260.0252960.21460.415328
270.0148560.12610.45002
280.08680.73650.231904
29-0.098127-0.83260.203902
300.0921430.78190.21843
310.0311910.26470.396012
32-0.051932-0.44070.33039
33-0.049333-0.41860.338375
34-0.082126-0.69690.244065
350.0229040.19430.423226
36-0.000596-0.00510.497989
37-0.049393-0.41910.338192
38-0.016742-0.14210.443715
390.0087670.07440.470454
40-0.019066-0.16180.435965
41-0.022267-0.18890.425336
42-0.014807-0.12560.450184
43-0.06468-0.54880.29241
440.0435450.36950.356422
45-0.024864-0.2110.416751
46-0.019696-0.16710.43387
470.0664550.56390.28729
480.0255370.21670.414531


Parameters (Session):
par1 = 48 ; par2 = 1 ; par3 = 0 ; par4 = 0 ; par5 = 12 ;
Parameters (R input):
par1 = 48 ; par2 = 1 ; par3 = 0 ; par4 = 0 ; par5 = 12 ;
R code (references can be found in the software module):
if (par1 == 'Default') {
par1 = 10*log10(length(x))
} else {
par1 <- as.numeric(par1)
}
par2 <- as.numeric(par2)
par3 <- as.numeric(par3)
par4 <- as.numeric(par4)
par5 <- as.numeric(par5)
if (par2 == 0) {
x <- log(x)
} else {
x <- (x ^ par2 - 1) / par2
}
if (par3 > 0) x <- diff(x,lag=1,difference=par3)
if (par4 > 0) x <- diff(x,lag=par5,difference=par4)
bitmap(file='pic1.png')
racf <- acf(x,par1,main='Autocorrelation',xlab='lags',ylab='ACF')
dev.off()
bitmap(file='pic2.png')
rpacf <- pacf(x,par1,main='Partial Autocorrelation',xlab='lags',ylab='PACF')
dev.off()
(myacf <- c(racf$acf))
(mypacf <- c(rpacf$acf))
lengthx <- length(x)
sqrtn <- sqrt(lengthx)
load(file='createtable')
a<-table.start()
a<-table.row.start(a)
a<-table.element(a,'Autocorrelation Function',4,TRUE)
a<-table.row.end(a)
a<-table.row.start(a)
a<-table.element(a,'Time lag k',header=TRUE)
a<-table.element(a,hyperlink('basics.htm','ACF(k)','click here for more information about the Autocorrelation Function'),header=TRUE)
a<-table.element(a,'T-STAT',header=TRUE)
a<-table.element(a,'P-value',header=TRUE)
a<-table.row.end(a)
for (i in 2:(par1+1)) {
a<-table.row.start(a)
a<-table.element(a,i-1,header=TRUE)
a<-table.element(a,round(myacf[i],6))
mytstat <- myacf[i]*sqrtn
a<-table.element(a,round(mytstat,4))
a<-table.element(a,round(1-pt(abs(mytstat),lengthx),6))
a<-table.row.end(a)
}
a<-table.end(a)
table.save(a,file='mytable.tab')
a<-table.start()
a<-table.row.start(a)
a<-table.element(a,'Partial Autocorrelation Function',4,TRUE)
a<-table.row.end(a)
a<-table.row.start(a)
a<-table.element(a,'Time lag k',header=TRUE)
a<-table.element(a,hyperlink('basics.htm','PACF(k)','click here for more information about the Partial Autocorrelation Function'),header=TRUE)
a<-table.element(a,'T-STAT',header=TRUE)
a<-table.element(a,'P-value',header=TRUE)
a<-table.row.end(a)
for (i in 1:par1) {
a<-table.row.start(a)
a<-table.element(a,i,header=TRUE)
a<-table.element(a,round(mypacf[i],6))
mytstat <- mypacf[i]*sqrtn
a<-table.element(a,round(mytstat,4))
a<-table.element(a,round(1-pt(abs(mytstat),lengthx),6))
a<-table.row.end(a)
}
a<-table.end(a)
table.save(a,file='mytable1.tab')