Free Statistics

of Irreproducible Research!

Author's title

Author*Unverified author*
R Software Modulerwasp_autocorrelation.wasp
Title produced by software(Partial) Autocorrelation Function
Date of computationWed, 03 Jun 2009 12:31:56 -0600
Cite this page as followsStatistical Computations at FreeStatistics.org, Office for Research Development and Education, URL https://freestatistics.org/blog/index.php?v=date/2009/Jun/03/t1244054002thqjnys2v7591d6.htm/, Retrieved Sat, 11 May 2024 17:27:53 +0000
Statistical Computations at FreeStatistics.org, Office for Research Development and Education, URL https://freestatistics.org/blog/index.php?pk=41521, Retrieved Sat, 11 May 2024 17:27:53 +0000
QR Codes:

Original text written by user:
IsPrivate?No (this computation is public)
User-defined keywords
Estimated Impact145
Family? (F = Feedback message, R = changed R code, M = changed R Module, P = changed Parameters, D = changed Data)
-     [(Partial) Autocorrelation Function] [autocorr - niet w...] [2009-05-13 18:11:28] [74be16979710d4c4e7c6647856088456]
- RMPD  [Bootstrap Plot - Central Tendency] [bootstrap plot - ...] [2009-05-13 18:23:37] [74be16979710d4c4e7c6647856088456]
-   PD    [Bootstrap Plot - Central Tendency] [bootstrap 750 - m...] [2009-05-13 18:33:55] [74be16979710d4c4e7c6647856088456]
- RMPD      [Variability] [variability - max...] [2009-05-22 12:40:32] [74be16979710d4c4e7c6647856088456]
- RMPD          [(Partial) Autocorrelation Function] [Robin Bosmans-Dat...] [2009-06-03 18:31:56] [f565a348fef35d164bc634b6b1fffd89] [Current]
Feedback Forum

Post a new message
Dataseries X:
467
460
448
443
436
431
484
510
513
503
471
471
476
475
470
461
455
456
517
525
523
519
509
512
519
517
510
509
501
507
569
580
578
565
547
555
562
561
555
544
537
543
594
611
613
611
594
595
591
589
584
573
567
569
621
629
628
612
595
597
593
590
580
574
573
573
620
626
620
588
566
557
561
549
532
526
511
499
555
565
542
527
510
514
517
508
493
490
469
478
528
534
518
506
502
516
528


Summary of computational transaction
Raw Inputview raw input (R code)
Raw Outputview raw output of R engine
Computing time1 seconds
R Server'George Udny Yule' @ 72.249.76.132

\begin{tabular}{lllllllll}
\hline
Summary of computational transaction \tabularnewline
Raw Input & view raw input (R code)  \tabularnewline
Raw Output & view raw output of R engine  \tabularnewline
Computing time & 1 seconds \tabularnewline
R Server & 'George Udny Yule' @ 72.249.76.132 \tabularnewline
\hline
\end{tabular}
%Source: https://freestatistics.org/blog/index.php?pk=41521&T=0

[TABLE]
[ROW][C]Summary of computational transaction[/C][/ROW]
[ROW][C]Raw Input[/C][C]view raw input (R code) [/C][/ROW]
[ROW][C]Raw Output[/C][C]view raw output of R engine [/C][/ROW]
[ROW][C]Computing time[/C][C]1 seconds[/C][/ROW]
[ROW][C]R Server[/C][C]'George Udny Yule' @ 72.249.76.132[/C][/ROW]
[/TABLE]
Source: https://freestatistics.org/blog/index.php?pk=41521&T=0

Globally Unique Identifier (entire table): ba.freestatistics.org/blog/index.php?pk=41521&T=0

As an alternative you can also use a QR Code:  

The GUIDs for individual cells are displayed in the table below:

Summary of computational transaction
Raw Inputview raw input (R code)
Raw Outputview raw output of R engine
Computing time1 seconds
R Server'George Udny Yule' @ 72.249.76.132


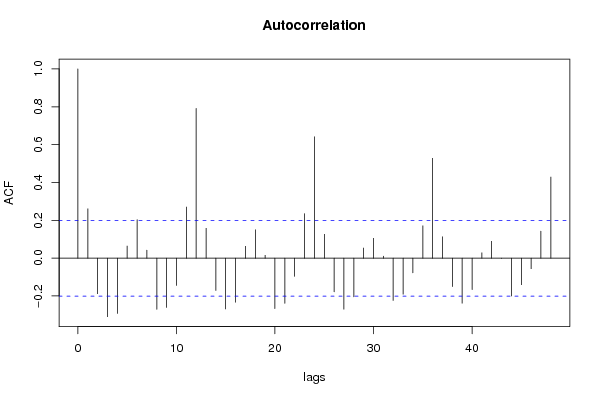
Autocorrelation Function
Time lag kACF(k)T-STATP-value
10.2608642.55590.00608
2-0.188116-1.84320.034196
3-0.309186-3.02940.001574
4-0.292173-2.86270.002579
50.063680.62390.267074
60.2030691.98970.024737
70.0422130.41360.340044
8-0.270694-2.65220.004678
9-0.260316-2.55060.006168
10-0.144239-1.41320.080409
110.2702172.64760.004739
120.7914467.75460
130.1575881.5440.062935
14-0.170853-1.6740.048692
15-0.268598-2.63170.00495
16-0.232891-2.28190.012353
170.0626320.61370.270444
180.1496371.46610.07294
190.0152870.14980.440626
20-0.26667-2.61280.005212
21-0.238748-2.33920.010698
22-0.095909-0.93970.174862
230.2348452.3010.011777
240.6413126.28360
250.1261681.23620.109703
26-0.177882-1.74290.042279
27-0.269659-2.64210.00481
28-0.20449-2.00360.023967
290.0536280.52540.300244
300.1046711.02560.153837
310.0103780.10170.459608
32-0.223334-2.18820.01554
33-0.190702-1.86850.032372
34-0.077712-0.76140.224136
350.1711051.67650.048449
360.5280145.17351e-06
370.1129551.10670.135588
38-0.150318-1.47280.072036
39-0.238131-2.33320.010862
40-0.165763-1.62410.053813
410.0283710.2780.390813
420.0888630.87070.193052
43-0.001078-0.01060.495796
44-0.19942-1.95390.026811
45-0.140151-1.37320.086445
46-0.055555-0.54430.29374
470.1427341.39850.082593
480.4283224.19673e-05

\begin{tabular}{lllllllll}
\hline
Autocorrelation Function \tabularnewline
Time lag k & ACF(k) & T-STAT & P-value \tabularnewline
1 & 0.260864 & 2.5559 & 0.00608 \tabularnewline
2 & -0.188116 & -1.8432 & 0.034196 \tabularnewline
3 & -0.309186 & -3.0294 & 0.001574 \tabularnewline
4 & -0.292173 & -2.8627 & 0.002579 \tabularnewline
5 & 0.06368 & 0.6239 & 0.267074 \tabularnewline
6 & 0.203069 & 1.9897 & 0.024737 \tabularnewline
7 & 0.042213 & 0.4136 & 0.340044 \tabularnewline
8 & -0.270694 & -2.6522 & 0.004678 \tabularnewline
9 & -0.260316 & -2.5506 & 0.006168 \tabularnewline
10 & -0.144239 & -1.4132 & 0.080409 \tabularnewline
11 & 0.270217 & 2.6476 & 0.004739 \tabularnewline
12 & 0.791446 & 7.7546 & 0 \tabularnewline
13 & 0.157588 & 1.544 & 0.062935 \tabularnewline
14 & -0.170853 & -1.674 & 0.048692 \tabularnewline
15 & -0.268598 & -2.6317 & 0.00495 \tabularnewline
16 & -0.232891 & -2.2819 & 0.012353 \tabularnewline
17 & 0.062632 & 0.6137 & 0.270444 \tabularnewline
18 & 0.149637 & 1.4661 & 0.07294 \tabularnewline
19 & 0.015287 & 0.1498 & 0.440626 \tabularnewline
20 & -0.26667 & -2.6128 & 0.005212 \tabularnewline
21 & -0.238748 & -2.3392 & 0.010698 \tabularnewline
22 & -0.095909 & -0.9397 & 0.174862 \tabularnewline
23 & 0.234845 & 2.301 & 0.011777 \tabularnewline
24 & 0.641312 & 6.2836 & 0 \tabularnewline
25 & 0.126168 & 1.2362 & 0.109703 \tabularnewline
26 & -0.177882 & -1.7429 & 0.042279 \tabularnewline
27 & -0.269659 & -2.6421 & 0.00481 \tabularnewline
28 & -0.20449 & -2.0036 & 0.023967 \tabularnewline
29 & 0.053628 & 0.5254 & 0.300244 \tabularnewline
30 & 0.104671 & 1.0256 & 0.153837 \tabularnewline
31 & 0.010378 & 0.1017 & 0.459608 \tabularnewline
32 & -0.223334 & -2.1882 & 0.01554 \tabularnewline
33 & -0.190702 & -1.8685 & 0.032372 \tabularnewline
34 & -0.077712 & -0.7614 & 0.224136 \tabularnewline
35 & 0.171105 & 1.6765 & 0.048449 \tabularnewline
36 & 0.528014 & 5.1735 & 1e-06 \tabularnewline
37 & 0.112955 & 1.1067 & 0.135588 \tabularnewline
38 & -0.150318 & -1.4728 & 0.072036 \tabularnewline
39 & -0.238131 & -2.3332 & 0.010862 \tabularnewline
40 & -0.165763 & -1.6241 & 0.053813 \tabularnewline
41 & 0.028371 & 0.278 & 0.390813 \tabularnewline
42 & 0.088863 & 0.8707 & 0.193052 \tabularnewline
43 & -0.001078 & -0.0106 & 0.495796 \tabularnewline
44 & -0.19942 & -1.9539 & 0.026811 \tabularnewline
45 & -0.140151 & -1.3732 & 0.086445 \tabularnewline
46 & -0.055555 & -0.5443 & 0.29374 \tabularnewline
47 & 0.142734 & 1.3985 & 0.082593 \tabularnewline
48 & 0.428322 & 4.1967 & 3e-05 \tabularnewline
\hline
\end{tabular}
%Source: https://freestatistics.org/blog/index.php?pk=41521&T=1

[TABLE]
[ROW][C]Autocorrelation Function[/C][/ROW]
[ROW][C]Time lag k[/C][C]ACF(k)[/C][C]T-STAT[/C][C]P-value[/C][/ROW]
[ROW][C]1[/C][C]0.260864[/C][C]2.5559[/C][C]0.00608[/C][/ROW]
[ROW][C]2[/C][C]-0.188116[/C][C]-1.8432[/C][C]0.034196[/C][/ROW]
[ROW][C]3[/C][C]-0.309186[/C][C]-3.0294[/C][C]0.001574[/C][/ROW]
[ROW][C]4[/C][C]-0.292173[/C][C]-2.8627[/C][C]0.002579[/C][/ROW]
[ROW][C]5[/C][C]0.06368[/C][C]0.6239[/C][C]0.267074[/C][/ROW]
[ROW][C]6[/C][C]0.203069[/C][C]1.9897[/C][C]0.024737[/C][/ROW]
[ROW][C]7[/C][C]0.042213[/C][C]0.4136[/C][C]0.340044[/C][/ROW]
[ROW][C]8[/C][C]-0.270694[/C][C]-2.6522[/C][C]0.004678[/C][/ROW]
[ROW][C]9[/C][C]-0.260316[/C][C]-2.5506[/C][C]0.006168[/C][/ROW]
[ROW][C]10[/C][C]-0.144239[/C][C]-1.4132[/C][C]0.080409[/C][/ROW]
[ROW][C]11[/C][C]0.270217[/C][C]2.6476[/C][C]0.004739[/C][/ROW]
[ROW][C]12[/C][C]0.791446[/C][C]7.7546[/C][C]0[/C][/ROW]
[ROW][C]13[/C][C]0.157588[/C][C]1.544[/C][C]0.062935[/C][/ROW]
[ROW][C]14[/C][C]-0.170853[/C][C]-1.674[/C][C]0.048692[/C][/ROW]
[ROW][C]15[/C][C]-0.268598[/C][C]-2.6317[/C][C]0.00495[/C][/ROW]
[ROW][C]16[/C][C]-0.232891[/C][C]-2.2819[/C][C]0.012353[/C][/ROW]
[ROW][C]17[/C][C]0.062632[/C][C]0.6137[/C][C]0.270444[/C][/ROW]
[ROW][C]18[/C][C]0.149637[/C][C]1.4661[/C][C]0.07294[/C][/ROW]
[ROW][C]19[/C][C]0.015287[/C][C]0.1498[/C][C]0.440626[/C][/ROW]
[ROW][C]20[/C][C]-0.26667[/C][C]-2.6128[/C][C]0.005212[/C][/ROW]
[ROW][C]21[/C][C]-0.238748[/C][C]-2.3392[/C][C]0.010698[/C][/ROW]
[ROW][C]22[/C][C]-0.095909[/C][C]-0.9397[/C][C]0.174862[/C][/ROW]
[ROW][C]23[/C][C]0.234845[/C][C]2.301[/C][C]0.011777[/C][/ROW]
[ROW][C]24[/C][C]0.641312[/C][C]6.2836[/C][C]0[/C][/ROW]
[ROW][C]25[/C][C]0.126168[/C][C]1.2362[/C][C]0.109703[/C][/ROW]
[ROW][C]26[/C][C]-0.177882[/C][C]-1.7429[/C][C]0.042279[/C][/ROW]
[ROW][C]27[/C][C]-0.269659[/C][C]-2.6421[/C][C]0.00481[/C][/ROW]
[ROW][C]28[/C][C]-0.20449[/C][C]-2.0036[/C][C]0.023967[/C][/ROW]
[ROW][C]29[/C][C]0.053628[/C][C]0.5254[/C][C]0.300244[/C][/ROW]
[ROW][C]30[/C][C]0.104671[/C][C]1.0256[/C][C]0.153837[/C][/ROW]
[ROW][C]31[/C][C]0.010378[/C][C]0.1017[/C][C]0.459608[/C][/ROW]
[ROW][C]32[/C][C]-0.223334[/C][C]-2.1882[/C][C]0.01554[/C][/ROW]
[ROW][C]33[/C][C]-0.190702[/C][C]-1.8685[/C][C]0.032372[/C][/ROW]
[ROW][C]34[/C][C]-0.077712[/C][C]-0.7614[/C][C]0.224136[/C][/ROW]
[ROW][C]35[/C][C]0.171105[/C][C]1.6765[/C][C]0.048449[/C][/ROW]
[ROW][C]36[/C][C]0.528014[/C][C]5.1735[/C][C]1e-06[/C][/ROW]
[ROW][C]37[/C][C]0.112955[/C][C]1.1067[/C][C]0.135588[/C][/ROW]
[ROW][C]38[/C][C]-0.150318[/C][C]-1.4728[/C][C]0.072036[/C][/ROW]
[ROW][C]39[/C][C]-0.238131[/C][C]-2.3332[/C][C]0.010862[/C][/ROW]
[ROW][C]40[/C][C]-0.165763[/C][C]-1.6241[/C][C]0.053813[/C][/ROW]
[ROW][C]41[/C][C]0.028371[/C][C]0.278[/C][C]0.390813[/C][/ROW]
[ROW][C]42[/C][C]0.088863[/C][C]0.8707[/C][C]0.193052[/C][/ROW]
[ROW][C]43[/C][C]-0.001078[/C][C]-0.0106[/C][C]0.495796[/C][/ROW]
[ROW][C]44[/C][C]-0.19942[/C][C]-1.9539[/C][C]0.026811[/C][/ROW]
[ROW][C]45[/C][C]-0.140151[/C][C]-1.3732[/C][C]0.086445[/C][/ROW]
[ROW][C]46[/C][C]-0.055555[/C][C]-0.5443[/C][C]0.29374[/C][/ROW]
[ROW][C]47[/C][C]0.142734[/C][C]1.3985[/C][C]0.082593[/C][/ROW]
[ROW][C]48[/C][C]0.428322[/C][C]4.1967[/C][C]3e-05[/C][/ROW]
[/TABLE]
Source: https://freestatistics.org/blog/index.php?pk=41521&T=1

Globally Unique Identifier (entire table): ba.freestatistics.org/blog/index.php?pk=41521&T=1

As an alternative you can also use a QR Code:  

The GUIDs for individual cells are displayed in the table below:

Autocorrelation Function
Time lag kACF(k)T-STATP-value
10.2608642.55590.00608
2-0.188116-1.84320.034196
3-0.309186-3.02940.001574
4-0.292173-2.86270.002579
50.063680.62390.267074
60.2030691.98970.024737
70.0422130.41360.340044
8-0.270694-2.65220.004678
9-0.260316-2.55060.006168
10-0.144239-1.41320.080409
110.2702172.64760.004739
120.7914467.75460
130.1575881.5440.062935
14-0.170853-1.6740.048692
15-0.268598-2.63170.00495
16-0.232891-2.28190.012353
170.0626320.61370.270444
180.1496371.46610.07294
190.0152870.14980.440626
20-0.26667-2.61280.005212
21-0.238748-2.33920.010698
22-0.095909-0.93970.174862
230.2348452.3010.011777
240.6413126.28360
250.1261681.23620.109703
26-0.177882-1.74290.042279
27-0.269659-2.64210.00481
28-0.20449-2.00360.023967
290.0536280.52540.300244
300.1046711.02560.153837
310.0103780.10170.459608
32-0.223334-2.18820.01554
33-0.190702-1.86850.032372
34-0.077712-0.76140.224136
350.1711051.67650.048449
360.5280145.17351e-06
370.1129551.10670.135588
38-0.150318-1.47280.072036
39-0.238131-2.33320.010862
40-0.165763-1.62410.053813
410.0283710.2780.390813
420.0888630.87070.193052
43-0.001078-0.01060.495796
44-0.19942-1.95390.026811
45-0.140151-1.37320.086445
46-0.055555-0.54430.29374
470.1427341.39850.082593
480.4283224.19673e-05


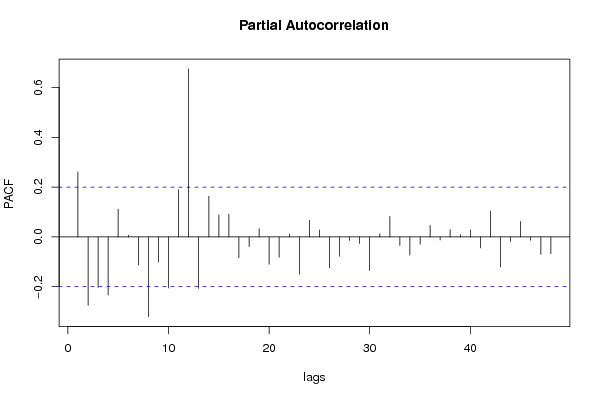
Partial Autocorrelation Function
Time lag kPACF(k)T-STATP-value
10.2608642.55590.00608
2-0.274871-2.69320.004177
3-0.203033-1.98930.024757
4-0.23322-2.28510.012255
50.1106581.08420.140492
60.006480.06350.474753
7-0.112656-1.10380.13622
8-0.32032-3.13850.001128
9-0.101334-0.99290.161634
10-0.204992-2.00850.023699
110.189661.85830.033097
120.6742986.60670
13-0.207006-2.02820.022654
140.1635381.60230.056183
150.0885940.8680.193768
160.0909780.89140.187471
17-0.084132-0.82430.205899
18-0.038687-0.37910.352741
190.0331520.32480.373011
20-0.109445-1.07230.143128
21-0.082-0.80340.211855
220.0111680.10940.456547
23-0.150196-1.47160.072198
240.067170.65810.256017
250.0280890.27520.391872
26-0.123774-1.21270.114104
27-0.077299-0.75740.225341
28-0.015027-0.14720.441627
29-0.026783-0.26240.396782
30-0.135411-1.32680.093868
310.0127040.12450.450599
320.0821840.80520.211337
33-0.034283-0.33590.36884
34-0.072745-0.71280.238864
35-0.029683-0.29080.385902
360.0460980.45170.326266
37-0.012535-0.12280.451253
380.0286730.28090.389682
390.0084440.08270.467117
400.0281350.27570.391699
41-0.044528-0.43630.331804
420.1037921.0170.155867
43-0.120892-1.18450.11957
44-0.018403-0.18030.428644
450.0619930.60740.272507
46-0.013083-0.12820.449136
47-0.069816-0.68410.247796
48-0.067315-0.65960.255561

\begin{tabular}{lllllllll}
\hline
Partial Autocorrelation Function \tabularnewline
Time lag k & PACF(k) & T-STAT & P-value \tabularnewline
1 & 0.260864 & 2.5559 & 0.00608 \tabularnewline
2 & -0.274871 & -2.6932 & 0.004177 \tabularnewline
3 & -0.203033 & -1.9893 & 0.024757 \tabularnewline
4 & -0.23322 & -2.2851 & 0.012255 \tabularnewline
5 & 0.110658 & 1.0842 & 0.140492 \tabularnewline
6 & 0.00648 & 0.0635 & 0.474753 \tabularnewline
7 & -0.112656 & -1.1038 & 0.13622 \tabularnewline
8 & -0.32032 & -3.1385 & 0.001128 \tabularnewline
9 & -0.101334 & -0.9929 & 0.161634 \tabularnewline
10 & -0.204992 & -2.0085 & 0.023699 \tabularnewline
11 & 0.18966 & 1.8583 & 0.033097 \tabularnewline
12 & 0.674298 & 6.6067 & 0 \tabularnewline
13 & -0.207006 & -2.0282 & 0.022654 \tabularnewline
14 & 0.163538 & 1.6023 & 0.056183 \tabularnewline
15 & 0.088594 & 0.868 & 0.193768 \tabularnewline
16 & 0.090978 & 0.8914 & 0.187471 \tabularnewline
17 & -0.084132 & -0.8243 & 0.205899 \tabularnewline
18 & -0.038687 & -0.3791 & 0.352741 \tabularnewline
19 & 0.033152 & 0.3248 & 0.373011 \tabularnewline
20 & -0.109445 & -1.0723 & 0.143128 \tabularnewline
21 & -0.082 & -0.8034 & 0.211855 \tabularnewline
22 & 0.011168 & 0.1094 & 0.456547 \tabularnewline
23 & -0.150196 & -1.4716 & 0.072198 \tabularnewline
24 & 0.06717 & 0.6581 & 0.256017 \tabularnewline
25 & 0.028089 & 0.2752 & 0.391872 \tabularnewline
26 & -0.123774 & -1.2127 & 0.114104 \tabularnewline
27 & -0.077299 & -0.7574 & 0.225341 \tabularnewline
28 & -0.015027 & -0.1472 & 0.441627 \tabularnewline
29 & -0.026783 & -0.2624 & 0.396782 \tabularnewline
30 & -0.135411 & -1.3268 & 0.093868 \tabularnewline
31 & 0.012704 & 0.1245 & 0.450599 \tabularnewline
32 & 0.082184 & 0.8052 & 0.211337 \tabularnewline
33 & -0.034283 & -0.3359 & 0.36884 \tabularnewline
34 & -0.072745 & -0.7128 & 0.238864 \tabularnewline
35 & -0.029683 & -0.2908 & 0.385902 \tabularnewline
36 & 0.046098 & 0.4517 & 0.326266 \tabularnewline
37 & -0.012535 & -0.1228 & 0.451253 \tabularnewline
38 & 0.028673 & 0.2809 & 0.389682 \tabularnewline
39 & 0.008444 & 0.0827 & 0.467117 \tabularnewline
40 & 0.028135 & 0.2757 & 0.391699 \tabularnewline
41 & -0.044528 & -0.4363 & 0.331804 \tabularnewline
42 & 0.103792 & 1.017 & 0.155867 \tabularnewline
43 & -0.120892 & -1.1845 & 0.11957 \tabularnewline
44 & -0.018403 & -0.1803 & 0.428644 \tabularnewline
45 & 0.061993 & 0.6074 & 0.272507 \tabularnewline
46 & -0.013083 & -0.1282 & 0.449136 \tabularnewline
47 & -0.069816 & -0.6841 & 0.247796 \tabularnewline
48 & -0.067315 & -0.6596 & 0.255561 \tabularnewline
\hline
\end{tabular}
%Source: https://freestatistics.org/blog/index.php?pk=41521&T=2

[TABLE]
[ROW][C]Partial Autocorrelation Function[/C][/ROW]
[ROW][C]Time lag k[/C][C]PACF(k)[/C][C]T-STAT[/C][C]P-value[/C][/ROW]
[ROW][C]1[/C][C]0.260864[/C][C]2.5559[/C][C]0.00608[/C][/ROW]
[ROW][C]2[/C][C]-0.274871[/C][C]-2.6932[/C][C]0.004177[/C][/ROW]
[ROW][C]3[/C][C]-0.203033[/C][C]-1.9893[/C][C]0.024757[/C][/ROW]
[ROW][C]4[/C][C]-0.23322[/C][C]-2.2851[/C][C]0.012255[/C][/ROW]
[ROW][C]5[/C][C]0.110658[/C][C]1.0842[/C][C]0.140492[/C][/ROW]
[ROW][C]6[/C][C]0.00648[/C][C]0.0635[/C][C]0.474753[/C][/ROW]
[ROW][C]7[/C][C]-0.112656[/C][C]-1.1038[/C][C]0.13622[/C][/ROW]
[ROW][C]8[/C][C]-0.32032[/C][C]-3.1385[/C][C]0.001128[/C][/ROW]
[ROW][C]9[/C][C]-0.101334[/C][C]-0.9929[/C][C]0.161634[/C][/ROW]
[ROW][C]10[/C][C]-0.204992[/C][C]-2.0085[/C][C]0.023699[/C][/ROW]
[ROW][C]11[/C][C]0.18966[/C][C]1.8583[/C][C]0.033097[/C][/ROW]
[ROW][C]12[/C][C]0.674298[/C][C]6.6067[/C][C]0[/C][/ROW]
[ROW][C]13[/C][C]-0.207006[/C][C]-2.0282[/C][C]0.022654[/C][/ROW]
[ROW][C]14[/C][C]0.163538[/C][C]1.6023[/C][C]0.056183[/C][/ROW]
[ROW][C]15[/C][C]0.088594[/C][C]0.868[/C][C]0.193768[/C][/ROW]
[ROW][C]16[/C][C]0.090978[/C][C]0.8914[/C][C]0.187471[/C][/ROW]
[ROW][C]17[/C][C]-0.084132[/C][C]-0.8243[/C][C]0.205899[/C][/ROW]
[ROW][C]18[/C][C]-0.038687[/C][C]-0.3791[/C][C]0.352741[/C][/ROW]
[ROW][C]19[/C][C]0.033152[/C][C]0.3248[/C][C]0.373011[/C][/ROW]
[ROW][C]20[/C][C]-0.109445[/C][C]-1.0723[/C][C]0.143128[/C][/ROW]
[ROW][C]21[/C][C]-0.082[/C][C]-0.8034[/C][C]0.211855[/C][/ROW]
[ROW][C]22[/C][C]0.011168[/C][C]0.1094[/C][C]0.456547[/C][/ROW]
[ROW][C]23[/C][C]-0.150196[/C][C]-1.4716[/C][C]0.072198[/C][/ROW]
[ROW][C]24[/C][C]0.06717[/C][C]0.6581[/C][C]0.256017[/C][/ROW]
[ROW][C]25[/C][C]0.028089[/C][C]0.2752[/C][C]0.391872[/C][/ROW]
[ROW][C]26[/C][C]-0.123774[/C][C]-1.2127[/C][C]0.114104[/C][/ROW]
[ROW][C]27[/C][C]-0.077299[/C][C]-0.7574[/C][C]0.225341[/C][/ROW]
[ROW][C]28[/C][C]-0.015027[/C][C]-0.1472[/C][C]0.441627[/C][/ROW]
[ROW][C]29[/C][C]-0.026783[/C][C]-0.2624[/C][C]0.396782[/C][/ROW]
[ROW][C]30[/C][C]-0.135411[/C][C]-1.3268[/C][C]0.093868[/C][/ROW]
[ROW][C]31[/C][C]0.012704[/C][C]0.1245[/C][C]0.450599[/C][/ROW]
[ROW][C]32[/C][C]0.082184[/C][C]0.8052[/C][C]0.211337[/C][/ROW]
[ROW][C]33[/C][C]-0.034283[/C][C]-0.3359[/C][C]0.36884[/C][/ROW]
[ROW][C]34[/C][C]-0.072745[/C][C]-0.7128[/C][C]0.238864[/C][/ROW]
[ROW][C]35[/C][C]-0.029683[/C][C]-0.2908[/C][C]0.385902[/C][/ROW]
[ROW][C]36[/C][C]0.046098[/C][C]0.4517[/C][C]0.326266[/C][/ROW]
[ROW][C]37[/C][C]-0.012535[/C][C]-0.1228[/C][C]0.451253[/C][/ROW]
[ROW][C]38[/C][C]0.028673[/C][C]0.2809[/C][C]0.389682[/C][/ROW]
[ROW][C]39[/C][C]0.008444[/C][C]0.0827[/C][C]0.467117[/C][/ROW]
[ROW][C]40[/C][C]0.028135[/C][C]0.2757[/C][C]0.391699[/C][/ROW]
[ROW][C]41[/C][C]-0.044528[/C][C]-0.4363[/C][C]0.331804[/C][/ROW]
[ROW][C]42[/C][C]0.103792[/C][C]1.017[/C][C]0.155867[/C][/ROW]
[ROW][C]43[/C][C]-0.120892[/C][C]-1.1845[/C][C]0.11957[/C][/ROW]
[ROW][C]44[/C][C]-0.018403[/C][C]-0.1803[/C][C]0.428644[/C][/ROW]
[ROW][C]45[/C][C]0.061993[/C][C]0.6074[/C][C]0.272507[/C][/ROW]
[ROW][C]46[/C][C]-0.013083[/C][C]-0.1282[/C][C]0.449136[/C][/ROW]
[ROW][C]47[/C][C]-0.069816[/C][C]-0.6841[/C][C]0.247796[/C][/ROW]
[ROW][C]48[/C][C]-0.067315[/C][C]-0.6596[/C][C]0.255561[/C][/ROW]
[/TABLE]
Source: https://freestatistics.org/blog/index.php?pk=41521&T=2

Globally Unique Identifier (entire table): ba.freestatistics.org/blog/index.php?pk=41521&T=2

As an alternative you can also use a QR Code:  

The GUIDs for individual cells are displayed in the table below:

Partial Autocorrelation Function
Time lag kPACF(k)T-STATP-value
10.2608642.55590.00608
2-0.274871-2.69320.004177
3-0.203033-1.98930.024757
4-0.23322-2.28510.012255
50.1106581.08420.140492
60.006480.06350.474753
7-0.112656-1.10380.13622
8-0.32032-3.13850.001128
9-0.101334-0.99290.161634
10-0.204992-2.00850.023699
110.189661.85830.033097
120.6742986.60670
13-0.207006-2.02820.022654
140.1635381.60230.056183
150.0885940.8680.193768
160.0909780.89140.187471
17-0.084132-0.82430.205899
18-0.038687-0.37910.352741
190.0331520.32480.373011
20-0.109445-1.07230.143128
21-0.082-0.80340.211855
220.0111680.10940.456547
23-0.150196-1.47160.072198
240.067170.65810.256017
250.0280890.27520.391872
26-0.123774-1.21270.114104
27-0.077299-0.75740.225341
28-0.015027-0.14720.441627
29-0.026783-0.26240.396782
30-0.135411-1.32680.093868
310.0127040.12450.450599
320.0821840.80520.211337
33-0.034283-0.33590.36884
34-0.072745-0.71280.238864
35-0.029683-0.29080.385902
360.0460980.45170.326266
37-0.012535-0.12280.451253
380.0286730.28090.389682
390.0084440.08270.467117
400.0281350.27570.391699
41-0.044528-0.43630.331804
420.1037921.0170.155867
43-0.120892-1.18450.11957
44-0.018403-0.18030.428644
450.0619930.60740.272507
46-0.013083-0.12820.449136
47-0.069816-0.68410.247796
48-0.067315-0.65960.255561


Parameters (Session):
par1 = 48 ; par2 = 1 ; par3 = 1 ; par4 = 0 ; par5 = 12 ;
Parameters (R input):
par1 = 48 ; par2 = 1 ; par3 = 1 ; par4 = 0 ; par5 = 12 ;
R code (references can be found in the software module):
if (par1 == 'Default') {
par1 = 10*log10(length(x))
} else {
par1 <- as.numeric(par1)
}
par2 <- as.numeric(par2)
par3 <- as.numeric(par3)
par4 <- as.numeric(par4)
par5 <- as.numeric(par5)
if (par2 == 0) {
x <- log(x)
} else {
x <- (x ^ par2 - 1) / par2
}
if (par3 > 0) x <- diff(x,lag=1,difference=par3)
if (par4 > 0) x <- diff(x,lag=par5,difference=par4)
bitmap(file='pic1.png')
racf <- acf(x,par1,main='Autocorrelation',xlab='lags',ylab='ACF')
dev.off()
bitmap(file='pic2.png')
rpacf <- pacf(x,par1,main='Partial Autocorrelation',xlab='lags',ylab='PACF')
dev.off()
(myacf <- c(racf$acf))
(mypacf <- c(rpacf$acf))
lengthx <- length(x)
sqrtn <- sqrt(lengthx)
load(file='createtable')
a<-table.start()
a<-table.row.start(a)
a<-table.element(a,'Autocorrelation Function',4,TRUE)
a<-table.row.end(a)
a<-table.row.start(a)
a<-table.element(a,'Time lag k',header=TRUE)
a<-table.element(a,hyperlink('basics.htm','ACF(k)','click here for more information about the Autocorrelation Function'),header=TRUE)
a<-table.element(a,'T-STAT',header=TRUE)
a<-table.element(a,'P-value',header=TRUE)
a<-table.row.end(a)
for (i in 2:(par1+1)) {
a<-table.row.start(a)
a<-table.element(a,i-1,header=TRUE)
a<-table.element(a,round(myacf[i],6))
mytstat <- myacf[i]*sqrtn
a<-table.element(a,round(mytstat,4))
a<-table.element(a,round(1-pt(abs(mytstat),lengthx),6))
a<-table.row.end(a)
}
a<-table.end(a)
table.save(a,file='mytable.tab')
a<-table.start()
a<-table.row.start(a)
a<-table.element(a,'Partial Autocorrelation Function',4,TRUE)
a<-table.row.end(a)
a<-table.row.start(a)
a<-table.element(a,'Time lag k',header=TRUE)
a<-table.element(a,hyperlink('basics.htm','PACF(k)','click here for more information about the Partial Autocorrelation Function'),header=TRUE)
a<-table.element(a,'T-STAT',header=TRUE)
a<-table.element(a,'P-value',header=TRUE)
a<-table.row.end(a)
for (i in 1:par1) {
a<-table.row.start(a)
a<-table.element(a,i,header=TRUE)
a<-table.element(a,round(mypacf[i],6))
mytstat <- mypacf[i]*sqrtn
a<-table.element(a,round(mytstat,4))
a<-table.element(a,round(1-pt(abs(mytstat),lengthx),6))
a<-table.row.end(a)
}
a<-table.end(a)
table.save(a,file='mytable1.tab')