Free Statistics

of Irreproducible Research!

Author's title

Author*Unverified author*
R Software Modulerwasp_autocorrelation.wasp
Title produced by software(Partial) Autocorrelation Function
Date of computationWed, 03 Jun 2009 12:00:57 -0600
Cite this page as followsStatistical Computations at FreeStatistics.org, Office for Research Development and Education, URL https://freestatistics.org/blog/index.php?v=date/2009/Jun/03/t1244052101q4dgzoxk41rz77a.htm/, Retrieved Sat, 11 May 2024 11:03:14 +0000
Statistical Computations at FreeStatistics.org, Office for Research Development and Education, URL https://freestatistics.org/blog/index.php?pk=41518, Retrieved Sat, 11 May 2024 11:03:14 +0000
QR Codes:

Original text written by user:
IsPrivate?No (this computation is public)
User-defined keywords
Estimated Impact157
Family? (F = Feedback message, R = changed R code, M = changed R Module, P = changed Parameters, D = changed Data)
-     [Central Tendency] [Opgave 5, centrum...] [2009-06-03 10:09:36] [ed8b9fd07c098e603d2759fe8bdf1d0e]
- RMP     [(Partial) Autocorrelation Function] [opgave 6bis oefen...] [2009-06-03 18:00:57] [ef3a18d597c5c4b11c910aafede28e07] [Current]
Feedback Forum

Post a new message
Dataseries X:
41
39
50
40
43
38
44
35
39
35
29
49
50
59
63
32
47
53
60
57
52
70
90
74
62
55
84
94
70
108
139
120
97
126
149
158
124
140
109
114
77
120
133
110
92
97
78
99
107
112
90
98
125
155
190
236
189
174
178
136
161
171
149
184
155
276
224
213
279
268
287
238
213
257
293
212
246
353
339
308
247
257
322
298
273
312
249
286
279
309
401
309
328
353
354
327
324
285
243
241
287
355
460
364
487
452
391
500
451
375
372
302
316
398
394
431
431


Summary of computational transaction
Raw Inputview raw input (R code)
Raw Outputview raw output of R engine
Computing time1 seconds
R Server'Gwilym Jenkins' @ 72.249.127.135

\begin{tabular}{lllllllll}
\hline
Summary of computational transaction \tabularnewline
Raw Input & view raw input (R code)  \tabularnewline
Raw Output & view raw output of R engine  \tabularnewline
Computing time & 1 seconds \tabularnewline
R Server & 'Gwilym Jenkins' @ 72.249.127.135 \tabularnewline
\hline
\end{tabular}
%Source: https://freestatistics.org/blog/index.php?pk=41518&T=0

[TABLE]
[ROW][C]Summary of computational transaction[/C][/ROW]
[ROW][C]Raw Input[/C][C]view raw input (R code) [/C][/ROW]
[ROW][C]Raw Output[/C][C]view raw output of R engine [/C][/ROW]
[ROW][C]Computing time[/C][C]1 seconds[/C][/ROW]
[ROW][C]R Server[/C][C]'Gwilym Jenkins' @ 72.249.127.135[/C][/ROW]
[/TABLE]
Source: https://freestatistics.org/blog/index.php?pk=41518&T=0

Globally Unique Identifier (entire table): ba.freestatistics.org/blog/index.php?pk=41518&T=0

As an alternative you can also use a QR Code:  

The GUIDs for individual cells are displayed in the table below:

Summary of computational transaction
Raw Inputview raw input (R code)
Raw Outputview raw output of R engine
Computing time1 seconds
R Server'Gwilym Jenkins' @ 72.249.127.135


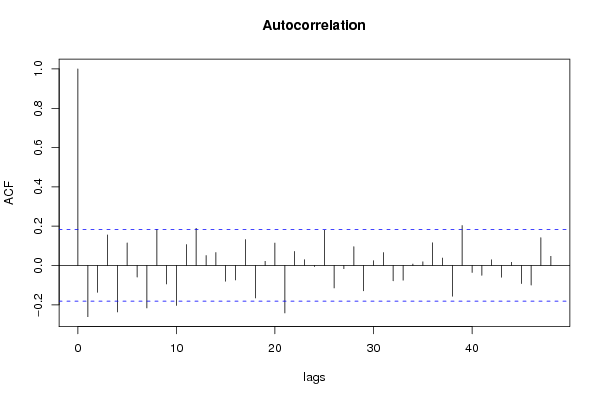
Autocorrelation Function
Time lag kACF(k)T-STATP-value
1-0.260508-2.80580.002944
2-0.136572-1.47090.07201
30.155221.67180.048633
4-0.236712-2.54950.006047
50.1143431.23150.110311
6-0.059128-0.63680.262747
7-0.216179-2.32830.010814
80.1833821.97510.025317
9-0.093745-1.00970.157379
10-0.203214-2.18870.015312
110.1061151.14290.127719
120.1893052.03890.021868
130.0501040.53960.295241
140.0657190.70780.24024
15-0.080153-0.86330.194885
16-0.073423-0.79080.215341
170.131671.41810.079417
18-0.165402-1.78140.03873
190.0209980.22620.410738
200.1137621.22530.11148
21-0.241543-2.60150.005246
220.0714650.76970.221522
230.0296380.31920.375069
24-0.005623-0.06060.475905
250.1789231.92710.028209
26-0.114134-1.22930.110731
27-0.016394-0.17660.430076
280.0953261.02670.153351
29-0.129298-1.39260.083204
300.0243790.26260.396676
310.065420.70460.241237
32-0.078184-0.84210.200741
33-0.075262-0.81060.20963
340.0069140.07450.470384
350.0184870.19910.421263
360.1152541.24130.108495
370.0373580.40240.344079
38-0.156297-1.68340.047497
390.2029372.18570.015423
40-0.035722-0.38470.350568
41-0.05016-0.54020.295032
420.0287470.30960.378704
43-0.059948-0.64570.259888
440.0162970.17550.430487
45-0.092236-0.99340.161288
46-0.099895-1.07590.142101
470.1413571.52250.065307
480.0466320.50220.308225

\begin{tabular}{lllllllll}
\hline
Autocorrelation Function \tabularnewline
Time lag k & ACF(k) & T-STAT & P-value \tabularnewline
1 & -0.260508 & -2.8058 & 0.002944 \tabularnewline
2 & -0.136572 & -1.4709 & 0.07201 \tabularnewline
3 & 0.15522 & 1.6718 & 0.048633 \tabularnewline
4 & -0.236712 & -2.5495 & 0.006047 \tabularnewline
5 & 0.114343 & 1.2315 & 0.110311 \tabularnewline
6 & -0.059128 & -0.6368 & 0.262747 \tabularnewline
7 & -0.216179 & -2.3283 & 0.010814 \tabularnewline
8 & 0.183382 & 1.9751 & 0.025317 \tabularnewline
9 & -0.093745 & -1.0097 & 0.157379 \tabularnewline
10 & -0.203214 & -2.1887 & 0.015312 \tabularnewline
11 & 0.106115 & 1.1429 & 0.127719 \tabularnewline
12 & 0.189305 & 2.0389 & 0.021868 \tabularnewline
13 & 0.050104 & 0.5396 & 0.295241 \tabularnewline
14 & 0.065719 & 0.7078 & 0.24024 \tabularnewline
15 & -0.080153 & -0.8633 & 0.194885 \tabularnewline
16 & -0.073423 & -0.7908 & 0.215341 \tabularnewline
17 & 0.13167 & 1.4181 & 0.079417 \tabularnewline
18 & -0.165402 & -1.7814 & 0.03873 \tabularnewline
19 & 0.020998 & 0.2262 & 0.410738 \tabularnewline
20 & 0.113762 & 1.2253 & 0.11148 \tabularnewline
21 & -0.241543 & -2.6015 & 0.005246 \tabularnewline
22 & 0.071465 & 0.7697 & 0.221522 \tabularnewline
23 & 0.029638 & 0.3192 & 0.375069 \tabularnewline
24 & -0.005623 & -0.0606 & 0.475905 \tabularnewline
25 & 0.178923 & 1.9271 & 0.028209 \tabularnewline
26 & -0.114134 & -1.2293 & 0.110731 \tabularnewline
27 & -0.016394 & -0.1766 & 0.430076 \tabularnewline
28 & 0.095326 & 1.0267 & 0.153351 \tabularnewline
29 & -0.129298 & -1.3926 & 0.083204 \tabularnewline
30 & 0.024379 & 0.2626 & 0.396676 \tabularnewline
31 & 0.06542 & 0.7046 & 0.241237 \tabularnewline
32 & -0.078184 & -0.8421 & 0.200741 \tabularnewline
33 & -0.075262 & -0.8106 & 0.20963 \tabularnewline
34 & 0.006914 & 0.0745 & 0.470384 \tabularnewline
35 & 0.018487 & 0.1991 & 0.421263 \tabularnewline
36 & 0.115254 & 1.2413 & 0.108495 \tabularnewline
37 & 0.037358 & 0.4024 & 0.344079 \tabularnewline
38 & -0.156297 & -1.6834 & 0.047497 \tabularnewline
39 & 0.202937 & 2.1857 & 0.015423 \tabularnewline
40 & -0.035722 & -0.3847 & 0.350568 \tabularnewline
41 & -0.05016 & -0.5402 & 0.295032 \tabularnewline
42 & 0.028747 & 0.3096 & 0.378704 \tabularnewline
43 & -0.059948 & -0.6457 & 0.259888 \tabularnewline
44 & 0.016297 & 0.1755 & 0.430487 \tabularnewline
45 & -0.092236 & -0.9934 & 0.161288 \tabularnewline
46 & -0.099895 & -1.0759 & 0.142101 \tabularnewline
47 & 0.141357 & 1.5225 & 0.065307 \tabularnewline
48 & 0.046632 & 0.5022 & 0.308225 \tabularnewline
\hline
\end{tabular}
%Source: https://freestatistics.org/blog/index.php?pk=41518&T=1

[TABLE]
[ROW][C]Autocorrelation Function[/C][/ROW]
[ROW][C]Time lag k[/C][C]ACF(k)[/C][C]T-STAT[/C][C]P-value[/C][/ROW]
[ROW][C]1[/C][C]-0.260508[/C][C]-2.8058[/C][C]0.002944[/C][/ROW]
[ROW][C]2[/C][C]-0.136572[/C][C]-1.4709[/C][C]0.07201[/C][/ROW]
[ROW][C]3[/C][C]0.15522[/C][C]1.6718[/C][C]0.048633[/C][/ROW]
[ROW][C]4[/C][C]-0.236712[/C][C]-2.5495[/C][C]0.006047[/C][/ROW]
[ROW][C]5[/C][C]0.114343[/C][C]1.2315[/C][C]0.110311[/C][/ROW]
[ROW][C]6[/C][C]-0.059128[/C][C]-0.6368[/C][C]0.262747[/C][/ROW]
[ROW][C]7[/C][C]-0.216179[/C][C]-2.3283[/C][C]0.010814[/C][/ROW]
[ROW][C]8[/C][C]0.183382[/C][C]1.9751[/C][C]0.025317[/C][/ROW]
[ROW][C]9[/C][C]-0.093745[/C][C]-1.0097[/C][C]0.157379[/C][/ROW]
[ROW][C]10[/C][C]-0.203214[/C][C]-2.1887[/C][C]0.015312[/C][/ROW]
[ROW][C]11[/C][C]0.106115[/C][C]1.1429[/C][C]0.127719[/C][/ROW]
[ROW][C]12[/C][C]0.189305[/C][C]2.0389[/C][C]0.021868[/C][/ROW]
[ROW][C]13[/C][C]0.050104[/C][C]0.5396[/C][C]0.295241[/C][/ROW]
[ROW][C]14[/C][C]0.065719[/C][C]0.7078[/C][C]0.24024[/C][/ROW]
[ROW][C]15[/C][C]-0.080153[/C][C]-0.8633[/C][C]0.194885[/C][/ROW]
[ROW][C]16[/C][C]-0.073423[/C][C]-0.7908[/C][C]0.215341[/C][/ROW]
[ROW][C]17[/C][C]0.13167[/C][C]1.4181[/C][C]0.079417[/C][/ROW]
[ROW][C]18[/C][C]-0.165402[/C][C]-1.7814[/C][C]0.03873[/C][/ROW]
[ROW][C]19[/C][C]0.020998[/C][C]0.2262[/C][C]0.410738[/C][/ROW]
[ROW][C]20[/C][C]0.113762[/C][C]1.2253[/C][C]0.11148[/C][/ROW]
[ROW][C]21[/C][C]-0.241543[/C][C]-2.6015[/C][C]0.005246[/C][/ROW]
[ROW][C]22[/C][C]0.071465[/C][C]0.7697[/C][C]0.221522[/C][/ROW]
[ROW][C]23[/C][C]0.029638[/C][C]0.3192[/C][C]0.375069[/C][/ROW]
[ROW][C]24[/C][C]-0.005623[/C][C]-0.0606[/C][C]0.475905[/C][/ROW]
[ROW][C]25[/C][C]0.178923[/C][C]1.9271[/C][C]0.028209[/C][/ROW]
[ROW][C]26[/C][C]-0.114134[/C][C]-1.2293[/C][C]0.110731[/C][/ROW]
[ROW][C]27[/C][C]-0.016394[/C][C]-0.1766[/C][C]0.430076[/C][/ROW]
[ROW][C]28[/C][C]0.095326[/C][C]1.0267[/C][C]0.153351[/C][/ROW]
[ROW][C]29[/C][C]-0.129298[/C][C]-1.3926[/C][C]0.083204[/C][/ROW]
[ROW][C]30[/C][C]0.024379[/C][C]0.2626[/C][C]0.396676[/C][/ROW]
[ROW][C]31[/C][C]0.06542[/C][C]0.7046[/C][C]0.241237[/C][/ROW]
[ROW][C]32[/C][C]-0.078184[/C][C]-0.8421[/C][C]0.200741[/C][/ROW]
[ROW][C]33[/C][C]-0.075262[/C][C]-0.8106[/C][C]0.20963[/C][/ROW]
[ROW][C]34[/C][C]0.006914[/C][C]0.0745[/C][C]0.470384[/C][/ROW]
[ROW][C]35[/C][C]0.018487[/C][C]0.1991[/C][C]0.421263[/C][/ROW]
[ROW][C]36[/C][C]0.115254[/C][C]1.2413[/C][C]0.108495[/C][/ROW]
[ROW][C]37[/C][C]0.037358[/C][C]0.4024[/C][C]0.344079[/C][/ROW]
[ROW][C]38[/C][C]-0.156297[/C][C]-1.6834[/C][C]0.047497[/C][/ROW]
[ROW][C]39[/C][C]0.202937[/C][C]2.1857[/C][C]0.015423[/C][/ROW]
[ROW][C]40[/C][C]-0.035722[/C][C]-0.3847[/C][C]0.350568[/C][/ROW]
[ROW][C]41[/C][C]-0.05016[/C][C]-0.5402[/C][C]0.295032[/C][/ROW]
[ROW][C]42[/C][C]0.028747[/C][C]0.3096[/C][C]0.378704[/C][/ROW]
[ROW][C]43[/C][C]-0.059948[/C][C]-0.6457[/C][C]0.259888[/C][/ROW]
[ROW][C]44[/C][C]0.016297[/C][C]0.1755[/C][C]0.430487[/C][/ROW]
[ROW][C]45[/C][C]-0.092236[/C][C]-0.9934[/C][C]0.161288[/C][/ROW]
[ROW][C]46[/C][C]-0.099895[/C][C]-1.0759[/C][C]0.142101[/C][/ROW]
[ROW][C]47[/C][C]0.141357[/C][C]1.5225[/C][C]0.065307[/C][/ROW]
[ROW][C]48[/C][C]0.046632[/C][C]0.5022[/C][C]0.308225[/C][/ROW]
[/TABLE]
Source: https://freestatistics.org/blog/index.php?pk=41518&T=1

Globally Unique Identifier (entire table): ba.freestatistics.org/blog/index.php?pk=41518&T=1

As an alternative you can also use a QR Code:  

The GUIDs for individual cells are displayed in the table below:

Autocorrelation Function
Time lag kACF(k)T-STATP-value
1-0.260508-2.80580.002944
2-0.136572-1.47090.07201
30.155221.67180.048633
4-0.236712-2.54950.006047
50.1143431.23150.110311
6-0.059128-0.63680.262747
7-0.216179-2.32830.010814
80.1833821.97510.025317
9-0.093745-1.00970.157379
10-0.203214-2.18870.015312
110.1061151.14290.127719
120.1893052.03890.021868
130.0501040.53960.295241
140.0657190.70780.24024
15-0.080153-0.86330.194885
16-0.073423-0.79080.215341
170.131671.41810.079417
18-0.165402-1.78140.03873
190.0209980.22620.410738
200.1137621.22530.11148
21-0.241543-2.60150.005246
220.0714650.76970.221522
230.0296380.31920.375069
24-0.005623-0.06060.475905
250.1789231.92710.028209
26-0.114134-1.22930.110731
27-0.016394-0.17660.430076
280.0953261.02670.153351
29-0.129298-1.39260.083204
300.0243790.26260.396676
310.065420.70460.241237
32-0.078184-0.84210.200741
33-0.075262-0.81060.20963
340.0069140.07450.470384
350.0184870.19910.421263
360.1152541.24130.108495
370.0373580.40240.344079
38-0.156297-1.68340.047497
390.2029372.18570.015423
40-0.035722-0.38470.350568
41-0.05016-0.54020.295032
420.0287470.30960.378704
43-0.059948-0.64570.259888
440.0162970.17550.430487
45-0.092236-0.99340.161288
46-0.099895-1.07590.142101
470.1413571.52250.065307
480.0466320.50220.308225


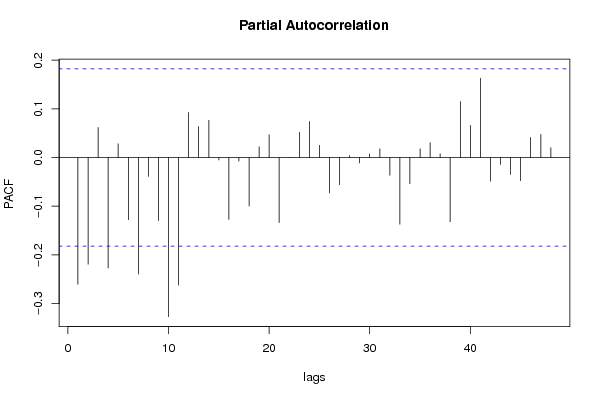
Partial Autocorrelation Function
Time lag kPACF(k)T-STATP-value
1-0.260508-2.80580.002944
2-0.21932-2.36220.009917
30.0616530.6640.253998
4-0.227082-2.44570.007979
50.0280830.30250.381422
6-0.127917-1.37770.085473
7-0.239425-2.57870.005584
8-0.038615-0.41590.339127
9-0.129656-1.39640.082624
10-0.327097-3.52290.000306
11-0.262047-2.82230.002806
120.0926350.99770.160248
130.0635820.68480.247419
140.0763230.8220.206376
15-0.005136-0.05530.47799
16-0.127184-1.36980.086695
17-0.007286-0.07850.468795
18-0.099439-1.0710.143197
190.0219070.23590.406947
200.046710.50310.307929
21-0.133746-1.44050.076211
22-0.000123-0.00130.499471
230.051910.55910.288589
240.0737440.79420.214337
250.0250320.26960.393974
26-0.072797-0.78410.217304
27-0.055973-0.60280.273895
280.0038260.04120.483601
29-0.011063-0.11920.452679
300.0070080.07550.469981
310.0178840.19260.423799
32-0.036659-0.39480.346848
33-0.136981-1.47530.071416
34-0.053821-0.57970.281631
350.0178540.19230.423926
360.0304260.32770.371867
370.0075880.08170.467505
38-0.131954-1.42120.078973
390.114981.23840.109038
400.0658360.70910.239849
410.1630931.75660.040815
42-0.048729-0.52480.300353
43-0.014194-0.15290.439384
44-0.034722-0.3740.354557
45-0.047542-0.5120.304796
460.0413490.44530.328453
470.0474070.51060.305306
480.0202720.21830.413775

\begin{tabular}{lllllllll}
\hline
Partial Autocorrelation Function \tabularnewline
Time lag k & PACF(k) & T-STAT & P-value \tabularnewline
1 & -0.260508 & -2.8058 & 0.002944 \tabularnewline
2 & -0.21932 & -2.3622 & 0.009917 \tabularnewline
3 & 0.061653 & 0.664 & 0.253998 \tabularnewline
4 & -0.227082 & -2.4457 & 0.007979 \tabularnewline
5 & 0.028083 & 0.3025 & 0.381422 \tabularnewline
6 & -0.127917 & -1.3777 & 0.085473 \tabularnewline
7 & -0.239425 & -2.5787 & 0.005584 \tabularnewline
8 & -0.038615 & -0.4159 & 0.339127 \tabularnewline
9 & -0.129656 & -1.3964 & 0.082624 \tabularnewline
10 & -0.327097 & -3.5229 & 0.000306 \tabularnewline
11 & -0.262047 & -2.8223 & 0.002806 \tabularnewline
12 & 0.092635 & 0.9977 & 0.160248 \tabularnewline
13 & 0.063582 & 0.6848 & 0.247419 \tabularnewline
14 & 0.076323 & 0.822 & 0.206376 \tabularnewline
15 & -0.005136 & -0.0553 & 0.47799 \tabularnewline
16 & -0.127184 & -1.3698 & 0.086695 \tabularnewline
17 & -0.007286 & -0.0785 & 0.468795 \tabularnewline
18 & -0.099439 & -1.071 & 0.143197 \tabularnewline
19 & 0.021907 & 0.2359 & 0.406947 \tabularnewline
20 & 0.04671 & 0.5031 & 0.307929 \tabularnewline
21 & -0.133746 & -1.4405 & 0.076211 \tabularnewline
22 & -0.000123 & -0.0013 & 0.499471 \tabularnewline
23 & 0.05191 & 0.5591 & 0.288589 \tabularnewline
24 & 0.073744 & 0.7942 & 0.214337 \tabularnewline
25 & 0.025032 & 0.2696 & 0.393974 \tabularnewline
26 & -0.072797 & -0.7841 & 0.217304 \tabularnewline
27 & -0.055973 & -0.6028 & 0.273895 \tabularnewline
28 & 0.003826 & 0.0412 & 0.483601 \tabularnewline
29 & -0.011063 & -0.1192 & 0.452679 \tabularnewline
30 & 0.007008 & 0.0755 & 0.469981 \tabularnewline
31 & 0.017884 & 0.1926 & 0.423799 \tabularnewline
32 & -0.036659 & -0.3948 & 0.346848 \tabularnewline
33 & -0.136981 & -1.4753 & 0.071416 \tabularnewline
34 & -0.053821 & -0.5797 & 0.281631 \tabularnewline
35 & 0.017854 & 0.1923 & 0.423926 \tabularnewline
36 & 0.030426 & 0.3277 & 0.371867 \tabularnewline
37 & 0.007588 & 0.0817 & 0.467505 \tabularnewline
38 & -0.131954 & -1.4212 & 0.078973 \tabularnewline
39 & 0.11498 & 1.2384 & 0.109038 \tabularnewline
40 & 0.065836 & 0.7091 & 0.239849 \tabularnewline
41 & 0.163093 & 1.7566 & 0.040815 \tabularnewline
42 & -0.048729 & -0.5248 & 0.300353 \tabularnewline
43 & -0.014194 & -0.1529 & 0.439384 \tabularnewline
44 & -0.034722 & -0.374 & 0.354557 \tabularnewline
45 & -0.047542 & -0.512 & 0.304796 \tabularnewline
46 & 0.041349 & 0.4453 & 0.328453 \tabularnewline
47 & 0.047407 & 0.5106 & 0.305306 \tabularnewline
48 & 0.020272 & 0.2183 & 0.413775 \tabularnewline
\hline
\end{tabular}
%Source: https://freestatistics.org/blog/index.php?pk=41518&T=2

[TABLE]
[ROW][C]Partial Autocorrelation Function[/C][/ROW]
[ROW][C]Time lag k[/C][C]PACF(k)[/C][C]T-STAT[/C][C]P-value[/C][/ROW]
[ROW][C]1[/C][C]-0.260508[/C][C]-2.8058[/C][C]0.002944[/C][/ROW]
[ROW][C]2[/C][C]-0.21932[/C][C]-2.3622[/C][C]0.009917[/C][/ROW]
[ROW][C]3[/C][C]0.061653[/C][C]0.664[/C][C]0.253998[/C][/ROW]
[ROW][C]4[/C][C]-0.227082[/C][C]-2.4457[/C][C]0.007979[/C][/ROW]
[ROW][C]5[/C][C]0.028083[/C][C]0.3025[/C][C]0.381422[/C][/ROW]
[ROW][C]6[/C][C]-0.127917[/C][C]-1.3777[/C][C]0.085473[/C][/ROW]
[ROW][C]7[/C][C]-0.239425[/C][C]-2.5787[/C][C]0.005584[/C][/ROW]
[ROW][C]8[/C][C]-0.038615[/C][C]-0.4159[/C][C]0.339127[/C][/ROW]
[ROW][C]9[/C][C]-0.129656[/C][C]-1.3964[/C][C]0.082624[/C][/ROW]
[ROW][C]10[/C][C]-0.327097[/C][C]-3.5229[/C][C]0.000306[/C][/ROW]
[ROW][C]11[/C][C]-0.262047[/C][C]-2.8223[/C][C]0.002806[/C][/ROW]
[ROW][C]12[/C][C]0.092635[/C][C]0.9977[/C][C]0.160248[/C][/ROW]
[ROW][C]13[/C][C]0.063582[/C][C]0.6848[/C][C]0.247419[/C][/ROW]
[ROW][C]14[/C][C]0.076323[/C][C]0.822[/C][C]0.206376[/C][/ROW]
[ROW][C]15[/C][C]-0.005136[/C][C]-0.0553[/C][C]0.47799[/C][/ROW]
[ROW][C]16[/C][C]-0.127184[/C][C]-1.3698[/C][C]0.086695[/C][/ROW]
[ROW][C]17[/C][C]-0.007286[/C][C]-0.0785[/C][C]0.468795[/C][/ROW]
[ROW][C]18[/C][C]-0.099439[/C][C]-1.071[/C][C]0.143197[/C][/ROW]
[ROW][C]19[/C][C]0.021907[/C][C]0.2359[/C][C]0.406947[/C][/ROW]
[ROW][C]20[/C][C]0.04671[/C][C]0.5031[/C][C]0.307929[/C][/ROW]
[ROW][C]21[/C][C]-0.133746[/C][C]-1.4405[/C][C]0.076211[/C][/ROW]
[ROW][C]22[/C][C]-0.000123[/C][C]-0.0013[/C][C]0.499471[/C][/ROW]
[ROW][C]23[/C][C]0.05191[/C][C]0.5591[/C][C]0.288589[/C][/ROW]
[ROW][C]24[/C][C]0.073744[/C][C]0.7942[/C][C]0.214337[/C][/ROW]
[ROW][C]25[/C][C]0.025032[/C][C]0.2696[/C][C]0.393974[/C][/ROW]
[ROW][C]26[/C][C]-0.072797[/C][C]-0.7841[/C][C]0.217304[/C][/ROW]
[ROW][C]27[/C][C]-0.055973[/C][C]-0.6028[/C][C]0.273895[/C][/ROW]
[ROW][C]28[/C][C]0.003826[/C][C]0.0412[/C][C]0.483601[/C][/ROW]
[ROW][C]29[/C][C]-0.011063[/C][C]-0.1192[/C][C]0.452679[/C][/ROW]
[ROW][C]30[/C][C]0.007008[/C][C]0.0755[/C][C]0.469981[/C][/ROW]
[ROW][C]31[/C][C]0.017884[/C][C]0.1926[/C][C]0.423799[/C][/ROW]
[ROW][C]32[/C][C]-0.036659[/C][C]-0.3948[/C][C]0.346848[/C][/ROW]
[ROW][C]33[/C][C]-0.136981[/C][C]-1.4753[/C][C]0.071416[/C][/ROW]
[ROW][C]34[/C][C]-0.053821[/C][C]-0.5797[/C][C]0.281631[/C][/ROW]
[ROW][C]35[/C][C]0.017854[/C][C]0.1923[/C][C]0.423926[/C][/ROW]
[ROW][C]36[/C][C]0.030426[/C][C]0.3277[/C][C]0.371867[/C][/ROW]
[ROW][C]37[/C][C]0.007588[/C][C]0.0817[/C][C]0.467505[/C][/ROW]
[ROW][C]38[/C][C]-0.131954[/C][C]-1.4212[/C][C]0.078973[/C][/ROW]
[ROW][C]39[/C][C]0.11498[/C][C]1.2384[/C][C]0.109038[/C][/ROW]
[ROW][C]40[/C][C]0.065836[/C][C]0.7091[/C][C]0.239849[/C][/ROW]
[ROW][C]41[/C][C]0.163093[/C][C]1.7566[/C][C]0.040815[/C][/ROW]
[ROW][C]42[/C][C]-0.048729[/C][C]-0.5248[/C][C]0.300353[/C][/ROW]
[ROW][C]43[/C][C]-0.014194[/C][C]-0.1529[/C][C]0.439384[/C][/ROW]
[ROW][C]44[/C][C]-0.034722[/C][C]-0.374[/C][C]0.354557[/C][/ROW]
[ROW][C]45[/C][C]-0.047542[/C][C]-0.512[/C][C]0.304796[/C][/ROW]
[ROW][C]46[/C][C]0.041349[/C][C]0.4453[/C][C]0.328453[/C][/ROW]
[ROW][C]47[/C][C]0.047407[/C][C]0.5106[/C][C]0.305306[/C][/ROW]
[ROW][C]48[/C][C]0.020272[/C][C]0.2183[/C][C]0.413775[/C][/ROW]
[/TABLE]
Source: https://freestatistics.org/blog/index.php?pk=41518&T=2

Globally Unique Identifier (entire table): ba.freestatistics.org/blog/index.php?pk=41518&T=2

As an alternative you can also use a QR Code:  

The GUIDs for individual cells are displayed in the table below:

Partial Autocorrelation Function
Time lag kPACF(k)T-STATP-value
1-0.260508-2.80580.002944
2-0.21932-2.36220.009917
30.0616530.6640.253998
4-0.227082-2.44570.007979
50.0280830.30250.381422
6-0.127917-1.37770.085473
7-0.239425-2.57870.005584
8-0.038615-0.41590.339127
9-0.129656-1.39640.082624
10-0.327097-3.52290.000306
11-0.262047-2.82230.002806
120.0926350.99770.160248
130.0635820.68480.247419
140.0763230.8220.206376
15-0.005136-0.05530.47799
16-0.127184-1.36980.086695
17-0.007286-0.07850.468795
18-0.099439-1.0710.143197
190.0219070.23590.406947
200.046710.50310.307929
21-0.133746-1.44050.076211
22-0.000123-0.00130.499471
230.051910.55910.288589
240.0737440.79420.214337
250.0250320.26960.393974
26-0.072797-0.78410.217304
27-0.055973-0.60280.273895
280.0038260.04120.483601
29-0.011063-0.11920.452679
300.0070080.07550.469981
310.0178840.19260.423799
32-0.036659-0.39480.346848
33-0.136981-1.47530.071416
34-0.053821-0.57970.281631
350.0178540.19230.423926
360.0304260.32770.371867
370.0075880.08170.467505
38-0.131954-1.42120.078973
390.114981.23840.109038
400.0658360.70910.239849
410.1630931.75660.040815
42-0.048729-0.52480.300353
43-0.014194-0.15290.439384
44-0.034722-0.3740.354557
45-0.047542-0.5120.304796
460.0413490.44530.328453
470.0474070.51060.305306
480.0202720.21830.413775


Parameters (Session):
par1 = 48 ; par2 = 1 ; par3 = 1 ; par4 = 0 ; par5 = 12 ;
Parameters (R input):
par1 = 48 ; par2 = 1 ; par3 = 1 ; par4 = 0 ; par5 = 12 ;
R code (references can be found in the software module):
if (par1 == 'Default') {
par1 = 10*log10(length(x))
} else {
par1 <- as.numeric(par1)
}
par2 <- as.numeric(par2)
par3 <- as.numeric(par3)
par4 <- as.numeric(par4)
par5 <- as.numeric(par5)
if (par2 == 0) {
x <- log(x)
} else {
x <- (x ^ par2 - 1) / par2
}
if (par3 > 0) x <- diff(x,lag=1,difference=par3)
if (par4 > 0) x <- diff(x,lag=par5,difference=par4)
bitmap(file='pic1.png')
racf <- acf(x,par1,main='Autocorrelation',xlab='lags',ylab='ACF')
dev.off()
bitmap(file='pic2.png')
rpacf <- pacf(x,par1,main='Partial Autocorrelation',xlab='lags',ylab='PACF')
dev.off()
(myacf <- c(racf$acf))
(mypacf <- c(rpacf$acf))
lengthx <- length(x)
sqrtn <- sqrt(lengthx)
load(file='createtable')
a<-table.start()
a<-table.row.start(a)
a<-table.element(a,'Autocorrelation Function',4,TRUE)
a<-table.row.end(a)
a<-table.row.start(a)
a<-table.element(a,'Time lag k',header=TRUE)
a<-table.element(a,hyperlink('basics.htm','ACF(k)','click here for more information about the Autocorrelation Function'),header=TRUE)
a<-table.element(a,'T-STAT',header=TRUE)
a<-table.element(a,'P-value',header=TRUE)
a<-table.row.end(a)
for (i in 2:(par1+1)) {
a<-table.row.start(a)
a<-table.element(a,i-1,header=TRUE)
a<-table.element(a,round(myacf[i],6))
mytstat <- myacf[i]*sqrtn
a<-table.element(a,round(mytstat,4))
a<-table.element(a,round(1-pt(abs(mytstat),lengthx),6))
a<-table.row.end(a)
}
a<-table.end(a)
table.save(a,file='mytable.tab')
a<-table.start()
a<-table.row.start(a)
a<-table.element(a,'Partial Autocorrelation Function',4,TRUE)
a<-table.row.end(a)
a<-table.row.start(a)
a<-table.element(a,'Time lag k',header=TRUE)
a<-table.element(a,hyperlink('basics.htm','PACF(k)','click here for more information about the Partial Autocorrelation Function'),header=TRUE)
a<-table.element(a,'T-STAT',header=TRUE)
a<-table.element(a,'P-value',header=TRUE)
a<-table.row.end(a)
for (i in 1:par1) {
a<-table.row.start(a)
a<-table.element(a,i,header=TRUE)
a<-table.element(a,round(mypacf[i],6))
mytstat <- mypacf[i]*sqrtn
a<-table.element(a,round(mytstat,4))
a<-table.element(a,round(1-pt(abs(mytstat),lengthx),6))
a<-table.row.end(a)
}
a<-table.end(a)
table.save(a,file='mytable1.tab')