Free Statistics

of Irreproducible Research!

Author's title

Author*Unverified author*
R Software Modulerwasp_autocorrelation.wasp
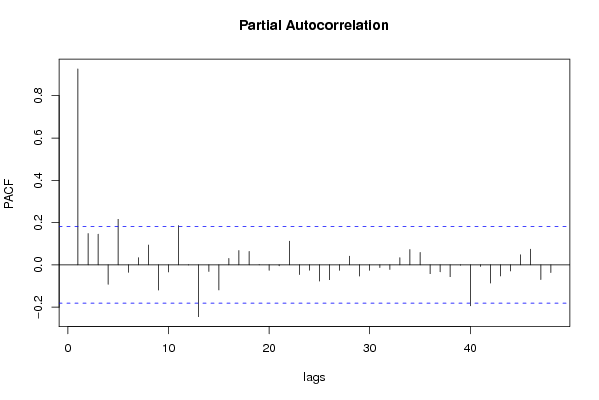
Title produced by software(Partial) Autocorrelation Function
Date of computationWed, 03 Jun 2009 11:59:02 -0600
Cite this page as followsStatistical Computations at FreeStatistics.org, Office for Research Development and Education, URL https://freestatistics.org/blog/index.php?v=date/2009/Jun/03/t1244051992qrgfrva163ac5kd.htm/, Retrieved Sun, 12 May 2024 04:16:36 +0000
Statistical Computations at FreeStatistics.org, Office for Research Development and Education, URL https://freestatistics.org/blog/index.php?pk=41516, Retrieved Sun, 12 May 2024 04:16:36 +0000
QR Codes:

Original text written by user:
IsPrivate?No (this computation is public)
User-defined keywords
Estimated Impact157
Family? (F = Feedback message, R = changed R code, M = changed R Module, P = changed Parameters, D = changed Data)
-     [Central Tendency] [Opgave 5, centrum...] [2009-06-03 10:09:36] [ed8b9fd07c098e603d2759fe8bdf1d0e]
- RMP     [(Partial) Autocorrelation Function] [opgave 6bis oefen...] [2009-06-03 17:59:02] [ef3a18d597c5c4b11c910aafede28e07] [Current]
Feedback Forum

Post a new message
Dataseries X:
41
39
50
40
43
38
44
35
39
35
29
49
50
59
63
32
47
53
60
57
52
70
90
74
62
55
84
94
70
108
139
120
97
126
149
158
124
140
109
114
77
120
133
110
92
97
78
99
107
112
90
98
125
155
190
236
189
174
178
136
161
171
149
184
155
276
224
213
279
268
287
238
213
257
293
212
246
353
339
308
247
257
322
298
273
312
249
286
279
309
401
309
328
353
354
327
324
285
243
241
287
355
460
364
487
452
391
500
451
375
372
302
316
398
394
431
431


Summary of computational transaction
Raw Inputview raw input (R code)
Raw Outputview raw output of R engine
Computing time1 seconds
R Server'Gwilym Jenkins' @ 72.249.127.135

\begin{tabular}{lllllllll}
\hline
Summary of computational transaction \tabularnewline
Raw Input & view raw input (R code)  \tabularnewline
Raw Output & view raw output of R engine  \tabularnewline
Computing time & 1 seconds \tabularnewline
R Server & 'Gwilym Jenkins' @ 72.249.127.135 \tabularnewline
\hline
\end{tabular}
%Source: https://freestatistics.org/blog/index.php?pk=41516&T=0

[TABLE]
[ROW][C]Summary of computational transaction[/C][/ROW]
[ROW][C]Raw Input[/C][C]view raw input (R code) [/C][/ROW]
[ROW][C]Raw Output[/C][C]view raw output of R engine [/C][/ROW]
[ROW][C]Computing time[/C][C]1 seconds[/C][/ROW]
[ROW][C]R Server[/C][C]'Gwilym Jenkins' @ 72.249.127.135[/C][/ROW]
[/TABLE]
Source: https://freestatistics.org/blog/index.php?pk=41516&T=0

Globally Unique Identifier (entire table): ba.freestatistics.org/blog/index.php?pk=41516&T=0

As an alternative you can also use a QR Code:  

The GUIDs for individual cells are displayed in the table below:

Summary of computational transaction
Raw Inputview raw input (R code)
Raw Outputview raw output of R engine
Computing time1 seconds
R Server'Gwilym Jenkins' @ 72.249.127.135


Autocorrelation Function
Time lag kACF(k)T-STATP-value
10.92672810.02410
20.8797159.51560
30.8517719.21330
40.805698.71490
50.7941048.58950
60.7714258.34420
70.7461528.07090
80.7416318.0220
90.7081977.66030
100.6772757.32590
110.679757.35260
120.6645297.1880
130.6245186.75520
140.5945766.43130
150.54555.90050
160.5144845.5650
170.5002155.41070
180.4779675.170
190.4728415.11461e-06
200.4595864.97121e-06
210.4286614.63675e-06
220.4234264.586e-06
230.4084754.41831.1e-05
240.3886054.20342.6e-05
250.3707944.01075.4e-05
260.3355143.62910.000211
270.302463.27160.000703
280.2827373.05830.00138
290.2542622.75030.003451
300.2410432.60730.005157
310.2320362.50980.006723
320.2063532.23210.013758
330.1912122.06830.020409
340.1827241.97650.025228
350.171951.85990.032704
360.1676221.81310.036189
370.149281.61470.054534
380.1203331.30160.097805
390.100641.08860.139286
400.0578470.62570.266362
410.0283620.30680.379778
420.011440.12370.450865
43-0.017918-0.19380.423327
44-0.039018-0.4220.336883
45-0.058358-0.63120.264559
46-0.07128-0.7710.221127
47-0.082058-0.88760.18829
48-0.104057-1.12550.131331

\begin{tabular}{lllllllll}
\hline
Autocorrelation Function \tabularnewline
Time lag k & ACF(k) & T-STAT & P-value \tabularnewline
1 & 0.926728 & 10.0241 & 0 \tabularnewline
2 & 0.879715 & 9.5156 & 0 \tabularnewline
3 & 0.851771 & 9.2133 & 0 \tabularnewline
4 & 0.80569 & 8.7149 & 0 \tabularnewline
5 & 0.794104 & 8.5895 & 0 \tabularnewline
6 & 0.771425 & 8.3442 & 0 \tabularnewline
7 & 0.746152 & 8.0709 & 0 \tabularnewline
8 & 0.741631 & 8.022 & 0 \tabularnewline
9 & 0.708197 & 7.6603 & 0 \tabularnewline
10 & 0.677275 & 7.3259 & 0 \tabularnewline
11 & 0.67975 & 7.3526 & 0 \tabularnewline
12 & 0.664529 & 7.188 & 0 \tabularnewline
13 & 0.624518 & 6.7552 & 0 \tabularnewline
14 & 0.594576 & 6.4313 & 0 \tabularnewline
15 & 0.5455 & 5.9005 & 0 \tabularnewline
16 & 0.514484 & 5.565 & 0 \tabularnewline
17 & 0.500215 & 5.4107 & 0 \tabularnewline
18 & 0.477967 & 5.17 & 0 \tabularnewline
19 & 0.472841 & 5.1146 & 1e-06 \tabularnewline
20 & 0.459586 & 4.9712 & 1e-06 \tabularnewline
21 & 0.428661 & 4.6367 & 5e-06 \tabularnewline
22 & 0.423426 & 4.58 & 6e-06 \tabularnewline
23 & 0.408475 & 4.4183 & 1.1e-05 \tabularnewline
24 & 0.388605 & 4.2034 & 2.6e-05 \tabularnewline
25 & 0.370794 & 4.0107 & 5.4e-05 \tabularnewline
26 & 0.335514 & 3.6291 & 0.000211 \tabularnewline
27 & 0.30246 & 3.2716 & 0.000703 \tabularnewline
28 & 0.282737 & 3.0583 & 0.00138 \tabularnewline
29 & 0.254262 & 2.7503 & 0.003451 \tabularnewline
30 & 0.241043 & 2.6073 & 0.005157 \tabularnewline
31 & 0.232036 & 2.5098 & 0.006723 \tabularnewline
32 & 0.206353 & 2.2321 & 0.013758 \tabularnewline
33 & 0.191212 & 2.0683 & 0.020409 \tabularnewline
34 & 0.182724 & 1.9765 & 0.025228 \tabularnewline
35 & 0.17195 & 1.8599 & 0.032704 \tabularnewline
36 & 0.167622 & 1.8131 & 0.036189 \tabularnewline
37 & 0.14928 & 1.6147 & 0.054534 \tabularnewline
38 & 0.120333 & 1.3016 & 0.097805 \tabularnewline
39 & 0.10064 & 1.0886 & 0.139286 \tabularnewline
40 & 0.057847 & 0.6257 & 0.266362 \tabularnewline
41 & 0.028362 & 0.3068 & 0.379778 \tabularnewline
42 & 0.01144 & 0.1237 & 0.450865 \tabularnewline
43 & -0.017918 & -0.1938 & 0.423327 \tabularnewline
44 & -0.039018 & -0.422 & 0.336883 \tabularnewline
45 & -0.058358 & -0.6312 & 0.264559 \tabularnewline
46 & -0.07128 & -0.771 & 0.221127 \tabularnewline
47 & -0.082058 & -0.8876 & 0.18829 \tabularnewline
48 & -0.104057 & -1.1255 & 0.131331 \tabularnewline
\hline
\end{tabular}
%Source: https://freestatistics.org/blog/index.php?pk=41516&T=1

[TABLE]
[ROW][C]Autocorrelation Function[/C][/ROW]
[ROW][C]Time lag k[/C][C]ACF(k)[/C][C]T-STAT[/C][C]P-value[/C][/ROW]
[ROW][C]1[/C][C]0.926728[/C][C]10.0241[/C][C]0[/C][/ROW]
[ROW][C]2[/C][C]0.879715[/C][C]9.5156[/C][C]0[/C][/ROW]
[ROW][C]3[/C][C]0.851771[/C][C]9.2133[/C][C]0[/C][/ROW]
[ROW][C]4[/C][C]0.80569[/C][C]8.7149[/C][C]0[/C][/ROW]
[ROW][C]5[/C][C]0.794104[/C][C]8.5895[/C][C]0[/C][/ROW]
[ROW][C]6[/C][C]0.771425[/C][C]8.3442[/C][C]0[/C][/ROW]
[ROW][C]7[/C][C]0.746152[/C][C]8.0709[/C][C]0[/C][/ROW]
[ROW][C]8[/C][C]0.741631[/C][C]8.022[/C][C]0[/C][/ROW]
[ROW][C]9[/C][C]0.708197[/C][C]7.6603[/C][C]0[/C][/ROW]
[ROW][C]10[/C][C]0.677275[/C][C]7.3259[/C][C]0[/C][/ROW]
[ROW][C]11[/C][C]0.67975[/C][C]7.3526[/C][C]0[/C][/ROW]
[ROW][C]12[/C][C]0.664529[/C][C]7.188[/C][C]0[/C][/ROW]
[ROW][C]13[/C][C]0.624518[/C][C]6.7552[/C][C]0[/C][/ROW]
[ROW][C]14[/C][C]0.594576[/C][C]6.4313[/C][C]0[/C][/ROW]
[ROW][C]15[/C][C]0.5455[/C][C]5.9005[/C][C]0[/C][/ROW]
[ROW][C]16[/C][C]0.514484[/C][C]5.565[/C][C]0[/C][/ROW]
[ROW][C]17[/C][C]0.500215[/C][C]5.4107[/C][C]0[/C][/ROW]
[ROW][C]18[/C][C]0.477967[/C][C]5.17[/C][C]0[/C][/ROW]
[ROW][C]19[/C][C]0.472841[/C][C]5.1146[/C][C]1e-06[/C][/ROW]
[ROW][C]20[/C][C]0.459586[/C][C]4.9712[/C][C]1e-06[/C][/ROW]
[ROW][C]21[/C][C]0.428661[/C][C]4.6367[/C][C]5e-06[/C][/ROW]
[ROW][C]22[/C][C]0.423426[/C][C]4.58[/C][C]6e-06[/C][/ROW]
[ROW][C]23[/C][C]0.408475[/C][C]4.4183[/C][C]1.1e-05[/C][/ROW]
[ROW][C]24[/C][C]0.388605[/C][C]4.2034[/C][C]2.6e-05[/C][/ROW]
[ROW][C]25[/C][C]0.370794[/C][C]4.0107[/C][C]5.4e-05[/C][/ROW]
[ROW][C]26[/C][C]0.335514[/C][C]3.6291[/C][C]0.000211[/C][/ROW]
[ROW][C]27[/C][C]0.30246[/C][C]3.2716[/C][C]0.000703[/C][/ROW]
[ROW][C]28[/C][C]0.282737[/C][C]3.0583[/C][C]0.00138[/C][/ROW]
[ROW][C]29[/C][C]0.254262[/C][C]2.7503[/C][C]0.003451[/C][/ROW]
[ROW][C]30[/C][C]0.241043[/C][C]2.6073[/C][C]0.005157[/C][/ROW]
[ROW][C]31[/C][C]0.232036[/C][C]2.5098[/C][C]0.006723[/C][/ROW]
[ROW][C]32[/C][C]0.206353[/C][C]2.2321[/C][C]0.013758[/C][/ROW]
[ROW][C]33[/C][C]0.191212[/C][C]2.0683[/C][C]0.020409[/C][/ROW]
[ROW][C]34[/C][C]0.182724[/C][C]1.9765[/C][C]0.025228[/C][/ROW]
[ROW][C]35[/C][C]0.17195[/C][C]1.8599[/C][C]0.032704[/C][/ROW]
[ROW][C]36[/C][C]0.167622[/C][C]1.8131[/C][C]0.036189[/C][/ROW]
[ROW][C]37[/C][C]0.14928[/C][C]1.6147[/C][C]0.054534[/C][/ROW]
[ROW][C]38[/C][C]0.120333[/C][C]1.3016[/C][C]0.097805[/C][/ROW]
[ROW][C]39[/C][C]0.10064[/C][C]1.0886[/C][C]0.139286[/C][/ROW]
[ROW][C]40[/C][C]0.057847[/C][C]0.6257[/C][C]0.266362[/C][/ROW]
[ROW][C]41[/C][C]0.028362[/C][C]0.3068[/C][C]0.379778[/C][/ROW]
[ROW][C]42[/C][C]0.01144[/C][C]0.1237[/C][C]0.450865[/C][/ROW]
[ROW][C]43[/C][C]-0.017918[/C][C]-0.1938[/C][C]0.423327[/C][/ROW]
[ROW][C]44[/C][C]-0.039018[/C][C]-0.422[/C][C]0.336883[/C][/ROW]
[ROW][C]45[/C][C]-0.058358[/C][C]-0.6312[/C][C]0.264559[/C][/ROW]
[ROW][C]46[/C][C]-0.07128[/C][C]-0.771[/C][C]0.221127[/C][/ROW]
[ROW][C]47[/C][C]-0.082058[/C][C]-0.8876[/C][C]0.18829[/C][/ROW]
[ROW][C]48[/C][C]-0.104057[/C][C]-1.1255[/C][C]0.131331[/C][/ROW]
[/TABLE]
Source: https://freestatistics.org/blog/index.php?pk=41516&T=1

Globally Unique Identifier (entire table): ba.freestatistics.org/blog/index.php?pk=41516&T=1

As an alternative you can also use a QR Code:  

The GUIDs for individual cells are displayed in the table below:

Autocorrelation Function
Time lag kACF(k)T-STATP-value
10.92672810.02410
20.8797159.51560
30.8517719.21330
40.805698.71490
50.7941048.58950
60.7714258.34420
70.7461528.07090
80.7416318.0220
90.7081977.66030
100.6772757.32590
110.679757.35260
120.6645297.1880
130.6245186.75520
140.5945766.43130
150.54555.90050
160.5144845.5650
170.5002155.41070
180.4779675.170
190.4728415.11461e-06
200.4595864.97121e-06
210.4286614.63675e-06
220.4234264.586e-06
230.4084754.41831.1e-05
240.3886054.20342.6e-05
250.3707944.01075.4e-05
260.3355143.62910.000211
270.302463.27160.000703
280.2827373.05830.00138
290.2542622.75030.003451
300.2410432.60730.005157
310.2320362.50980.006723
320.2063532.23210.013758
330.1912122.06830.020409
340.1827241.97650.025228
350.171951.85990.032704
360.1676221.81310.036189
370.149281.61470.054534
380.1203331.30160.097805
390.100641.08860.139286
400.0578470.62570.266362
410.0283620.30680.379778
420.011440.12370.450865
43-0.017918-0.19380.423327
44-0.039018-0.4220.336883
45-0.058358-0.63120.264559
46-0.07128-0.7710.221127
47-0.082058-0.88760.18829
48-0.104057-1.12550.131331


Partial Autocorrelation Function
Time lag kPACF(k)T-STATP-value
10.92672810.02410
20.1479711.60050.056087
30.1449791.56820.059769
4-0.091862-0.99360.161224
50.2152282.3280.010814
6-0.03521-0.38080.352003
70.0340390.36820.3567
80.0937281.01380.15638
9-0.119307-1.29050.099711
10-0.033423-0.36150.35918
110.1861242.01320.023192
12-0.000196-0.00210.499155
13-0.245025-2.65040.004577
14-0.031346-0.33910.367588
15-0.11873-1.28430.100795
160.0305120.330.37098
170.0676390.73160.23293
180.0637540.68960.245905
190.0005680.00610.497553
20-0.025782-0.27890.390416
21-0.004458-0.04820.480812
220.1121231.21280.113826
23-0.04566-0.49390.311154
24-0.02505-0.2710.393451
25-0.076501-0.82750.204822
26-0.070168-0.7590.224694
27-0.025917-0.28030.389857
280.0408580.44190.329672
29-0.052838-0.57150.284369
30-0.025653-0.27750.39095
31-0.012758-0.1380.445238
32-0.021978-0.23770.406252
330.0340360.36820.35671
340.0725240.78450.217176
350.0585350.63320.263934
36-0.041656-0.45060.326565
37-0.032932-0.35620.361162
38-0.05613-0.60710.272467
39-0.001336-0.01450.494246
40-0.193876-2.09710.01907
41-0.007421-0.08030.468078
42-0.085922-0.92940.1773
43-0.052645-0.56940.285072
44-0.029003-0.31370.377149
450.0477610.51660.3032
460.0740780.80130.212299
47-0.06935-0.75010.22734
48-0.036518-0.3950.346778

\begin{tabular}{lllllllll}
\hline
Partial Autocorrelation Function \tabularnewline
Time lag k & PACF(k) & T-STAT & P-value \tabularnewline
1 & 0.926728 & 10.0241 & 0 \tabularnewline
2 & 0.147971 & 1.6005 & 0.056087 \tabularnewline
3 & 0.144979 & 1.5682 & 0.059769 \tabularnewline
4 & -0.091862 & -0.9936 & 0.161224 \tabularnewline
5 & 0.215228 & 2.328 & 0.010814 \tabularnewline
6 & -0.03521 & -0.3808 & 0.352003 \tabularnewline
7 & 0.034039 & 0.3682 & 0.3567 \tabularnewline
8 & 0.093728 & 1.0138 & 0.15638 \tabularnewline
9 & -0.119307 & -1.2905 & 0.099711 \tabularnewline
10 & -0.033423 & -0.3615 & 0.35918 \tabularnewline
11 & 0.186124 & 2.0132 & 0.023192 \tabularnewline
12 & -0.000196 & -0.0021 & 0.499155 \tabularnewline
13 & -0.245025 & -2.6504 & 0.004577 \tabularnewline
14 & -0.031346 & -0.3391 & 0.367588 \tabularnewline
15 & -0.11873 & -1.2843 & 0.100795 \tabularnewline
16 & 0.030512 & 0.33 & 0.37098 \tabularnewline
17 & 0.067639 & 0.7316 & 0.23293 \tabularnewline
18 & 0.063754 & 0.6896 & 0.245905 \tabularnewline
19 & 0.000568 & 0.0061 & 0.497553 \tabularnewline
20 & -0.025782 & -0.2789 & 0.390416 \tabularnewline
21 & -0.004458 & -0.0482 & 0.480812 \tabularnewline
22 & 0.112123 & 1.2128 & 0.113826 \tabularnewline
23 & -0.04566 & -0.4939 & 0.311154 \tabularnewline
24 & -0.02505 & -0.271 & 0.393451 \tabularnewline
25 & -0.076501 & -0.8275 & 0.204822 \tabularnewline
26 & -0.070168 & -0.759 & 0.224694 \tabularnewline
27 & -0.025917 & -0.2803 & 0.389857 \tabularnewline
28 & 0.040858 & 0.4419 & 0.329672 \tabularnewline
29 & -0.052838 & -0.5715 & 0.284369 \tabularnewline
30 & -0.025653 & -0.2775 & 0.39095 \tabularnewline
31 & -0.012758 & -0.138 & 0.445238 \tabularnewline
32 & -0.021978 & -0.2377 & 0.406252 \tabularnewline
33 & 0.034036 & 0.3682 & 0.35671 \tabularnewline
34 & 0.072524 & 0.7845 & 0.217176 \tabularnewline
35 & 0.058535 & 0.6332 & 0.263934 \tabularnewline
36 & -0.041656 & -0.4506 & 0.326565 \tabularnewline
37 & -0.032932 & -0.3562 & 0.361162 \tabularnewline
38 & -0.05613 & -0.6071 & 0.272467 \tabularnewline
39 & -0.001336 & -0.0145 & 0.494246 \tabularnewline
40 & -0.193876 & -2.0971 & 0.01907 \tabularnewline
41 & -0.007421 & -0.0803 & 0.468078 \tabularnewline
42 & -0.085922 & -0.9294 & 0.1773 \tabularnewline
43 & -0.052645 & -0.5694 & 0.285072 \tabularnewline
44 & -0.029003 & -0.3137 & 0.377149 \tabularnewline
45 & 0.047761 & 0.5166 & 0.3032 \tabularnewline
46 & 0.074078 & 0.8013 & 0.212299 \tabularnewline
47 & -0.06935 & -0.7501 & 0.22734 \tabularnewline
48 & -0.036518 & -0.395 & 0.346778 \tabularnewline
\hline
\end{tabular}
%Source: https://freestatistics.org/blog/index.php?pk=41516&T=2

[TABLE]
[ROW][C]Partial Autocorrelation Function[/C][/ROW]
[ROW][C]Time lag k[/C][C]PACF(k)[/C][C]T-STAT[/C][C]P-value[/C][/ROW]
[ROW][C]1[/C][C]0.926728[/C][C]10.0241[/C][C]0[/C][/ROW]
[ROW][C]2[/C][C]0.147971[/C][C]1.6005[/C][C]0.056087[/C][/ROW]
[ROW][C]3[/C][C]0.144979[/C][C]1.5682[/C][C]0.059769[/C][/ROW]
[ROW][C]4[/C][C]-0.091862[/C][C]-0.9936[/C][C]0.161224[/C][/ROW]
[ROW][C]5[/C][C]0.215228[/C][C]2.328[/C][C]0.010814[/C][/ROW]
[ROW][C]6[/C][C]-0.03521[/C][C]-0.3808[/C][C]0.352003[/C][/ROW]
[ROW][C]7[/C][C]0.034039[/C][C]0.3682[/C][C]0.3567[/C][/ROW]
[ROW][C]8[/C][C]0.093728[/C][C]1.0138[/C][C]0.15638[/C][/ROW]
[ROW][C]9[/C][C]-0.119307[/C][C]-1.2905[/C][C]0.099711[/C][/ROW]
[ROW][C]10[/C][C]-0.033423[/C][C]-0.3615[/C][C]0.35918[/C][/ROW]
[ROW][C]11[/C][C]0.186124[/C][C]2.0132[/C][C]0.023192[/C][/ROW]
[ROW][C]12[/C][C]-0.000196[/C][C]-0.0021[/C][C]0.499155[/C][/ROW]
[ROW][C]13[/C][C]-0.245025[/C][C]-2.6504[/C][C]0.004577[/C][/ROW]
[ROW][C]14[/C][C]-0.031346[/C][C]-0.3391[/C][C]0.367588[/C][/ROW]
[ROW][C]15[/C][C]-0.11873[/C][C]-1.2843[/C][C]0.100795[/C][/ROW]
[ROW][C]16[/C][C]0.030512[/C][C]0.33[/C][C]0.37098[/C][/ROW]
[ROW][C]17[/C][C]0.067639[/C][C]0.7316[/C][C]0.23293[/C][/ROW]
[ROW][C]18[/C][C]0.063754[/C][C]0.6896[/C][C]0.245905[/C][/ROW]
[ROW][C]19[/C][C]0.000568[/C][C]0.0061[/C][C]0.497553[/C][/ROW]
[ROW][C]20[/C][C]-0.025782[/C][C]-0.2789[/C][C]0.390416[/C][/ROW]
[ROW][C]21[/C][C]-0.004458[/C][C]-0.0482[/C][C]0.480812[/C][/ROW]
[ROW][C]22[/C][C]0.112123[/C][C]1.2128[/C][C]0.113826[/C][/ROW]
[ROW][C]23[/C][C]-0.04566[/C][C]-0.4939[/C][C]0.311154[/C][/ROW]
[ROW][C]24[/C][C]-0.02505[/C][C]-0.271[/C][C]0.393451[/C][/ROW]
[ROW][C]25[/C][C]-0.076501[/C][C]-0.8275[/C][C]0.204822[/C][/ROW]
[ROW][C]26[/C][C]-0.070168[/C][C]-0.759[/C][C]0.224694[/C][/ROW]
[ROW][C]27[/C][C]-0.025917[/C][C]-0.2803[/C][C]0.389857[/C][/ROW]
[ROW][C]28[/C][C]0.040858[/C][C]0.4419[/C][C]0.329672[/C][/ROW]
[ROW][C]29[/C][C]-0.052838[/C][C]-0.5715[/C][C]0.284369[/C][/ROW]
[ROW][C]30[/C][C]-0.025653[/C][C]-0.2775[/C][C]0.39095[/C][/ROW]
[ROW][C]31[/C][C]-0.012758[/C][C]-0.138[/C][C]0.445238[/C][/ROW]
[ROW][C]32[/C][C]-0.021978[/C][C]-0.2377[/C][C]0.406252[/C][/ROW]
[ROW][C]33[/C][C]0.034036[/C][C]0.3682[/C][C]0.35671[/C][/ROW]
[ROW][C]34[/C][C]0.072524[/C][C]0.7845[/C][C]0.217176[/C][/ROW]
[ROW][C]35[/C][C]0.058535[/C][C]0.6332[/C][C]0.263934[/C][/ROW]
[ROW][C]36[/C][C]-0.041656[/C][C]-0.4506[/C][C]0.326565[/C][/ROW]
[ROW][C]37[/C][C]-0.032932[/C][C]-0.3562[/C][C]0.361162[/C][/ROW]
[ROW][C]38[/C][C]-0.05613[/C][C]-0.6071[/C][C]0.272467[/C][/ROW]
[ROW][C]39[/C][C]-0.001336[/C][C]-0.0145[/C][C]0.494246[/C][/ROW]
[ROW][C]40[/C][C]-0.193876[/C][C]-2.0971[/C][C]0.01907[/C][/ROW]
[ROW][C]41[/C][C]-0.007421[/C][C]-0.0803[/C][C]0.468078[/C][/ROW]
[ROW][C]42[/C][C]-0.085922[/C][C]-0.9294[/C][C]0.1773[/C][/ROW]
[ROW][C]43[/C][C]-0.052645[/C][C]-0.5694[/C][C]0.285072[/C][/ROW]
[ROW][C]44[/C][C]-0.029003[/C][C]-0.3137[/C][C]0.377149[/C][/ROW]
[ROW][C]45[/C][C]0.047761[/C][C]0.5166[/C][C]0.3032[/C][/ROW]
[ROW][C]46[/C][C]0.074078[/C][C]0.8013[/C][C]0.212299[/C][/ROW]
[ROW][C]47[/C][C]-0.06935[/C][C]-0.7501[/C][C]0.22734[/C][/ROW]
[ROW][C]48[/C][C]-0.036518[/C][C]-0.395[/C][C]0.346778[/C][/ROW]
[/TABLE]
Source: https://freestatistics.org/blog/index.php?pk=41516&T=2

Globally Unique Identifier (entire table): ba.freestatistics.org/blog/index.php?pk=41516&T=2

As an alternative you can also use a QR Code:  

The GUIDs for individual cells are displayed in the table below:

Partial Autocorrelation Function
Time lag kPACF(k)T-STATP-value
10.92672810.02410
20.1479711.60050.056087
30.1449791.56820.059769
4-0.091862-0.99360.161224
50.2152282.3280.010814
6-0.03521-0.38080.352003
70.0340390.36820.3567
80.0937281.01380.15638
9-0.119307-1.29050.099711
10-0.033423-0.36150.35918
110.1861242.01320.023192
12-0.000196-0.00210.499155
13-0.245025-2.65040.004577
14-0.031346-0.33910.367588
15-0.11873-1.28430.100795
160.0305120.330.37098
170.0676390.73160.23293
180.0637540.68960.245905
190.0005680.00610.497553
20-0.025782-0.27890.390416
21-0.004458-0.04820.480812
220.1121231.21280.113826
23-0.04566-0.49390.311154
24-0.02505-0.2710.393451
25-0.076501-0.82750.204822
26-0.070168-0.7590.224694
27-0.025917-0.28030.389857
280.0408580.44190.329672
29-0.052838-0.57150.284369
30-0.025653-0.27750.39095
31-0.012758-0.1380.445238
32-0.021978-0.23770.406252
330.0340360.36820.35671
340.0725240.78450.217176
350.0585350.63320.263934
36-0.041656-0.45060.326565
37-0.032932-0.35620.361162
38-0.05613-0.60710.272467
39-0.001336-0.01450.494246
40-0.193876-2.09710.01907
41-0.007421-0.08030.468078
42-0.085922-0.92940.1773
43-0.052645-0.56940.285072
44-0.029003-0.31370.377149
450.0477610.51660.3032
460.0740780.80130.212299
47-0.06935-0.75010.22734
48-0.036518-0.3950.346778


Parameters (Session):
par1 = 48 ; par2 = 1 ; par3 = 0 ; par4 = 0 ; par5 = 12 ;
Parameters (R input):
par1 = 48 ; par2 = 1 ; par3 = 0 ; par4 = 0 ; par5 = 12 ;
R code (references can be found in the software module):
if (par1 == 'Default') {
par1 = 10*log10(length(x))
} else {
par1 <- as.numeric(par1)
}
par2 <- as.numeric(par2)
par3 <- as.numeric(par3)
par4 <- as.numeric(par4)
par5 <- as.numeric(par5)
if (par2 == 0) {
x <- log(x)
} else {
x <- (x ^ par2 - 1) / par2
}
if (par3 > 0) x <- diff(x,lag=1,difference=par3)
if (par4 > 0) x <- diff(x,lag=par5,difference=par4)
bitmap(file='pic1.png')
racf <- acf(x,par1,main='Autocorrelation',xlab='lags',ylab='ACF')
dev.off()
bitmap(file='pic2.png')
rpacf <- pacf(x,par1,main='Partial Autocorrelation',xlab='lags',ylab='PACF')
dev.off()
(myacf <- c(racf$acf))
(mypacf <- c(rpacf$acf))
lengthx <- length(x)
sqrtn <- sqrt(lengthx)
load(file='createtable')
a<-table.start()
a<-table.row.start(a)
a<-table.element(a,'Autocorrelation Function',4,TRUE)
a<-table.row.end(a)
a<-table.row.start(a)
a<-table.element(a,'Time lag k',header=TRUE)
a<-table.element(a,hyperlink('basics.htm','ACF(k)','click here for more information about the Autocorrelation Function'),header=TRUE)
a<-table.element(a,'T-STAT',header=TRUE)
a<-table.element(a,'P-value',header=TRUE)
a<-table.row.end(a)
for (i in 2:(par1+1)) {
a<-table.row.start(a)
a<-table.element(a,i-1,header=TRUE)
a<-table.element(a,round(myacf[i],6))
mytstat <- myacf[i]*sqrtn
a<-table.element(a,round(mytstat,4))
a<-table.element(a,round(1-pt(abs(mytstat),lengthx),6))
a<-table.row.end(a)
}
a<-table.end(a)
table.save(a,file='mytable.tab')
a<-table.start()
a<-table.row.start(a)
a<-table.element(a,'Partial Autocorrelation Function',4,TRUE)
a<-table.row.end(a)
a<-table.row.start(a)
a<-table.element(a,'Time lag k',header=TRUE)
a<-table.element(a,hyperlink('basics.htm','PACF(k)','click here for more information about the Partial Autocorrelation Function'),header=TRUE)
a<-table.element(a,'T-STAT',header=TRUE)
a<-table.element(a,'P-value',header=TRUE)
a<-table.row.end(a)
for (i in 1:par1) {
a<-table.row.start(a)
a<-table.element(a,i,header=TRUE)
a<-table.element(a,round(mypacf[i],6))
mytstat <- mypacf[i]*sqrtn
a<-table.element(a,round(mytstat,4))
a<-table.element(a,round(1-pt(abs(mytstat),lengthx),6))
a<-table.row.end(a)
}
a<-table.end(a)
table.save(a,file='mytable1.tab')