Free Statistics

of Irreproducible Research!

Author's title

Author*Unverified author*
R Software Modulerwasp_smp.wasp
Title produced by softwareStandard Deviation-Mean Plot
Date of computationWed, 03 Jun 2009 05:42:04 -0600
Cite this page as followsStatistical Computations at FreeStatistics.org, Office for Research Development and Education, URL https://freestatistics.org/blog/index.php?v=date/2009/Jun/03/t1244029361zey2tthbkieni5t.htm/, Retrieved Sun, 12 May 2024 01:13:36 +0000
Statistical Computations at FreeStatistics.org, Office for Research Development and Education, URL https://freestatistics.org/blog/index.php?pk=41460, Retrieved Sun, 12 May 2024 01:13:36 +0000
QR Codes:

Original text written by user:
IsPrivate?No (this computation is public)
User-defined keywords
Estimated Impact102
Family? (F = Feedback message, R = changed R code, M = changed R Module, P = changed Parameters, D = changed Data)
-       [Standard Deviation-Mean Plot] [Opgave 8, oefenin...] [2009-06-03 11:42:04] [ef3a18d597c5c4b11c910aafede28e07] [Current]
Feedback Forum

Post a new message
Dataseries X:
41
39
50
40
43
38
44
35
39
35
29
49
50
59
63
32
47
53
60
57
52
70
90
74
62
55
84
94
70
108
139
120
97
126
149
158
124
140
109
114
77
120
133
110
92
97
78
99
107
112
90
98
125
155
190
236
189
174
178
136
161
171
149
184
155
276
224
213
279
268
287
238
213
257
293
212
246
353
339
308
247
257
322
298
273
312
249
286
279
309
401
309
328
353
354
327
324
285
243
241
287
355
460
364
487
452
391
500
451
375
372
302
316
398
394
431
431


Summary of computational transaction
Raw Inputview raw input (R code)
Raw Outputview raw output of R engine
Computing time1 seconds
R Server'Gwilym Jenkins' @ 72.249.127.135

\begin{tabular}{lllllllll}
\hline
Summary of computational transaction \tabularnewline
Raw Input & view raw input (R code)  \tabularnewline
Raw Output & view raw output of R engine  \tabularnewline
Computing time & 1 seconds \tabularnewline
R Server & 'Gwilym Jenkins' @ 72.249.127.135 \tabularnewline
\hline
\end{tabular}
%Source: https://freestatistics.org/blog/index.php?pk=41460&T=0

[TABLE]
[ROW][C]Summary of computational transaction[/C][/ROW]
[ROW][C]Raw Input[/C][C]view raw input (R code) [/C][/ROW]
[ROW][C]Raw Output[/C][C]view raw output of R engine [/C][/ROW]
[ROW][C]Computing time[/C][C]1 seconds[/C][/ROW]
[ROW][C]R Server[/C][C]'Gwilym Jenkins' @ 72.249.127.135[/C][/ROW]
[/TABLE]
Source: https://freestatistics.org/blog/index.php?pk=41460&T=0

Globally Unique Identifier (entire table): ba.freestatistics.org/blog/index.php?pk=41460&T=0

As an alternative you can also use a QR Code:  

The GUIDs for individual cells are displayed in the table below:

Summary of computational transaction
Raw Inputview raw input (R code)
Raw Outputview raw output of R engine
Computing time1 seconds
R Server'Gwilym Jenkins' @ 72.249.127.135


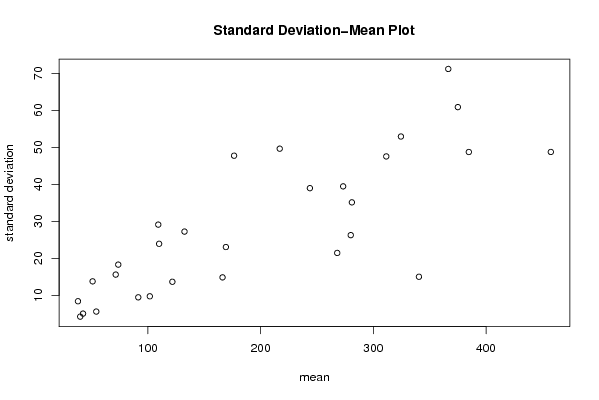
Standard Deviation-Mean Plot
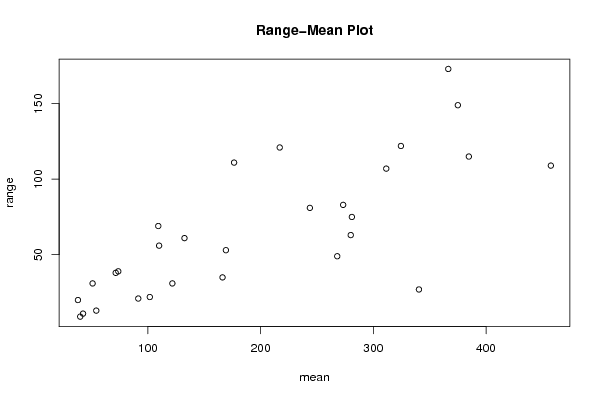
SectionMeanStandard DeviationRange
142.55.0662280511902211
2404.242640687119289
3388.4063468086123320
45113.784048752090231
554.255.6199051000291213
671.515.609825965290838
773.7518.300728582946339
8109.2529.113284482059669
9132.527.233557730613761
10121.7513.671747023210631
1111023.930454794396856
1291.59.4692484742278621
13101.759.7425184971169922
14176.547.73887304912111
15169.2523.056091024571653
16166.2514.863265679744435
1721749.6319789383149121
1826821.463146709340349
19243.7538.96472763923881
20311.547.5429630264389107
2128135.128336140500675
2228026.267851073127463
23324.552.924474489597122
24340.515.022205785658327
25273.2539.449334595148783
26366.571.182863106228173
27457.548.7476495159852109
2837560.8659729788875149
29384.7548.7399562303182115

\begin{tabular}{lllllllll}
\hline
Standard Deviation-Mean Plot \tabularnewline
Section & Mean & Standard Deviation & Range \tabularnewline
1 & 42.5 & 5.06622805119022 & 11 \tabularnewline
2 & 40 & 4.24264068711928 & 9 \tabularnewline
3 & 38 & 8.40634680861233 & 20 \tabularnewline
4 & 51 & 13.7840487520902 & 31 \tabularnewline
5 & 54.25 & 5.61990510002912 & 13 \tabularnewline
6 & 71.5 & 15.6098259652908 & 38 \tabularnewline
7 & 73.75 & 18.3007285829463 & 39 \tabularnewline
8 & 109.25 & 29.1132844820596 & 69 \tabularnewline
9 & 132.5 & 27.2335577306137 & 61 \tabularnewline
10 & 121.75 & 13.6717470232106 & 31 \tabularnewline
11 & 110 & 23.9304547943968 & 56 \tabularnewline
12 & 91.5 & 9.46924847422786 & 21 \tabularnewline
13 & 101.75 & 9.74251849711699 & 22 \tabularnewline
14 & 176.5 & 47.73887304912 & 111 \tabularnewline
15 & 169.25 & 23.0560910245716 & 53 \tabularnewline
16 & 166.25 & 14.8632656797444 & 35 \tabularnewline
17 & 217 & 49.6319789383149 & 121 \tabularnewline
18 & 268 & 21.4631467093403 & 49 \tabularnewline
19 & 243.75 & 38.964727639238 & 81 \tabularnewline
20 & 311.5 & 47.5429630264389 & 107 \tabularnewline
21 & 281 & 35.1283361405006 & 75 \tabularnewline
22 & 280 & 26.2678510731274 & 63 \tabularnewline
23 & 324.5 & 52.924474489597 & 122 \tabularnewline
24 & 340.5 & 15.0222057856583 & 27 \tabularnewline
25 & 273.25 & 39.4493345951487 & 83 \tabularnewline
26 & 366.5 & 71.182863106228 & 173 \tabularnewline
27 & 457.5 & 48.7476495159852 & 109 \tabularnewline
28 & 375 & 60.8659729788875 & 149 \tabularnewline
29 & 384.75 & 48.7399562303182 & 115 \tabularnewline
\hline
\end{tabular}
%Source: https://freestatistics.org/blog/index.php?pk=41460&T=1

[TABLE]
[ROW][C]Standard Deviation-Mean Plot[/C][/ROW]
[ROW][C]Section[/C][C]Mean[/C][C]Standard Deviation[/C][C]Range[/C][/ROW]
[ROW][C]1[/C][C]42.5[/C][C]5.06622805119022[/C][C]11[/C][/ROW]
[ROW][C]2[/C][C]40[/C][C]4.24264068711928[/C][C]9[/C][/ROW]
[ROW][C]3[/C][C]38[/C][C]8.40634680861233[/C][C]20[/C][/ROW]
[ROW][C]4[/C][C]51[/C][C]13.7840487520902[/C][C]31[/C][/ROW]
[ROW][C]5[/C][C]54.25[/C][C]5.61990510002912[/C][C]13[/C][/ROW]
[ROW][C]6[/C][C]71.5[/C][C]15.6098259652908[/C][C]38[/C][/ROW]
[ROW][C]7[/C][C]73.75[/C][C]18.3007285829463[/C][C]39[/C][/ROW]
[ROW][C]8[/C][C]109.25[/C][C]29.1132844820596[/C][C]69[/C][/ROW]
[ROW][C]9[/C][C]132.5[/C][C]27.2335577306137[/C][C]61[/C][/ROW]
[ROW][C]10[/C][C]121.75[/C][C]13.6717470232106[/C][C]31[/C][/ROW]
[ROW][C]11[/C][C]110[/C][C]23.9304547943968[/C][C]56[/C][/ROW]
[ROW][C]12[/C][C]91.5[/C][C]9.46924847422786[/C][C]21[/C][/ROW]
[ROW][C]13[/C][C]101.75[/C][C]9.74251849711699[/C][C]22[/C][/ROW]
[ROW][C]14[/C][C]176.5[/C][C]47.73887304912[/C][C]111[/C][/ROW]
[ROW][C]15[/C][C]169.25[/C][C]23.0560910245716[/C][C]53[/C][/ROW]
[ROW][C]16[/C][C]166.25[/C][C]14.8632656797444[/C][C]35[/C][/ROW]
[ROW][C]17[/C][C]217[/C][C]49.6319789383149[/C][C]121[/C][/ROW]
[ROW][C]18[/C][C]268[/C][C]21.4631467093403[/C][C]49[/C][/ROW]
[ROW][C]19[/C][C]243.75[/C][C]38.964727639238[/C][C]81[/C][/ROW]
[ROW][C]20[/C][C]311.5[/C][C]47.5429630264389[/C][C]107[/C][/ROW]
[ROW][C]21[/C][C]281[/C][C]35.1283361405006[/C][C]75[/C][/ROW]
[ROW][C]22[/C][C]280[/C][C]26.2678510731274[/C][C]63[/C][/ROW]
[ROW][C]23[/C][C]324.5[/C][C]52.924474489597[/C][C]122[/C][/ROW]
[ROW][C]24[/C][C]340.5[/C][C]15.0222057856583[/C][C]27[/C][/ROW]
[ROW][C]25[/C][C]273.25[/C][C]39.4493345951487[/C][C]83[/C][/ROW]
[ROW][C]26[/C][C]366.5[/C][C]71.182863106228[/C][C]173[/C][/ROW]
[ROW][C]27[/C][C]457.5[/C][C]48.7476495159852[/C][C]109[/C][/ROW]
[ROW][C]28[/C][C]375[/C][C]60.8659729788875[/C][C]149[/C][/ROW]
[ROW][C]29[/C][C]384.75[/C][C]48.7399562303182[/C][C]115[/C][/ROW]
[/TABLE]
Source: https://freestatistics.org/blog/index.php?pk=41460&T=1

Globally Unique Identifier (entire table): ba.freestatistics.org/blog/index.php?pk=41460&T=1

As an alternative you can also use a QR Code:  

The GUIDs for individual cells are displayed in the table below:

Standard Deviation-Mean Plot
SectionMeanStandard DeviationRange
142.55.0662280511902211
2404.242640687119289
3388.4063468086123320
45113.784048752090231
554.255.6199051000291213
671.515.609825965290838
773.7518.300728582946339
8109.2529.113284482059669
9132.527.233557730613761
10121.7513.671747023210631
1111023.930454794396856
1291.59.4692484742278621
13101.759.7425184971169922
14176.547.73887304912111
15169.2523.056091024571653
16166.2514.863265679744435
1721749.6319789383149121
1826821.463146709340349
19243.7538.96472763923881
20311.547.5429630264389107
2128135.128336140500675
2228026.267851073127463
23324.552.924474489597122
24340.515.022205785658327
25273.2539.449334595148783
26366.571.182863106228173
27457.548.7476495159852109
2837560.8659729788875149
29384.7548.7399562303182115


Regression: S.E.(k) = alpha + beta * Mean(k)
alpha5.31031908779098
beta0.118417234511755
S.D.0.0175210711376911
T-STAT6.75856136769043
p-value2.94493500097904e-07

\begin{tabular}{lllllllll}
\hline
Regression: S.E.(k) = alpha + beta * Mean(k) \tabularnewline
alpha & 5.31031908779098 \tabularnewline
beta & 0.118417234511755 \tabularnewline
S.D. & 0.0175210711376911 \tabularnewline
T-STAT & 6.75856136769043 \tabularnewline
p-value & 2.94493500097904e-07 \tabularnewline
\hline
\end{tabular}
%Source: https://freestatistics.org/blog/index.php?pk=41460&T=2

[TABLE]
[ROW][C]Regression: S.E.(k) = alpha + beta * Mean(k)[/C][/ROW]
[ROW][C]alpha[/C][C]5.31031908779098[/C][/ROW]
[ROW][C]beta[/C][C]0.118417234511755[/C][/ROW]
[ROW][C]S.D.[/C][C]0.0175210711376911[/C][/ROW]
[ROW][C]T-STAT[/C][C]6.75856136769043[/C][/ROW]
[ROW][C]p-value[/C][C]2.94493500097904e-07[/C][/ROW]
[/TABLE]
Source: https://freestatistics.org/blog/index.php?pk=41460&T=2

Globally Unique Identifier (entire table): ba.freestatistics.org/blog/index.php?pk=41460&T=2

As an alternative you can also use a QR Code:  

The GUIDs for individual cells are displayed in the table below:

Regression: S.E.(k) = alpha + beta * Mean(k)
alpha5.31031908779098
beta0.118417234511755
S.D.0.0175210711376911
T-STAT6.75856136769043
p-value2.94493500097904e-07


Regression: ln S.E.(k) = alpha + beta * ln Mean(k)
alpha-1.23184308619977
beta0.860215036497359
S.D.0.105720773816344
T-STAT8.13666988468797
p-value9.69500129041493e-09
Lambda0.139784963502641

\begin{tabular}{lllllllll}
\hline
Regression: ln S.E.(k) = alpha + beta * ln Mean(k) \tabularnewline
alpha & -1.23184308619977 \tabularnewline
beta & 0.860215036497359 \tabularnewline
S.D. & 0.105720773816344 \tabularnewline
T-STAT & 8.13666988468797 \tabularnewline
p-value & 9.69500129041493e-09 \tabularnewline
Lambda & 0.139784963502641 \tabularnewline
\hline
\end{tabular}
%Source: https://freestatistics.org/blog/index.php?pk=41460&T=3

[TABLE]
[ROW][C]Regression: ln S.E.(k) = alpha + beta * ln Mean(k)[/C][/ROW]
[ROW][C]alpha[/C][C]-1.23184308619977[/C][/ROW]
[ROW][C]beta[/C][C]0.860215036497359[/C][/ROW]
[ROW][C]S.D.[/C][C]0.105720773816344[/C][/ROW]
[ROW][C]T-STAT[/C][C]8.13666988468797[/C][/ROW]
[ROW][C]p-value[/C][C]9.69500129041493e-09[/C][/ROW]
[ROW][C]Lambda[/C][C]0.139784963502641[/C][/ROW]
[/TABLE]
Source: https://freestatistics.org/blog/index.php?pk=41460&T=3

Globally Unique Identifier (entire table): ba.freestatistics.org/blog/index.php?pk=41460&T=3

As an alternative you can also use a QR Code:  

The GUIDs for individual cells are displayed in the table below:

Regression: ln S.E.(k) = alpha + beta * ln Mean(k)
alpha-1.23184308619977
beta0.860215036497359
S.D.0.105720773816344
T-STAT8.13666988468797
p-value9.69500129041493e-09
Lambda0.139784963502641


Parameters (Session):
par1 = 12 ;
Parameters (R input):
par1 = 4 ;
R code (references can be found in the software module):
par1 <- as.numeric(par1)
(n <- length(x))
(np <- floor(n / par1))
arr <- array(NA,dim=c(par1,np))
j <- 0
k <- 1
for (i in 1:(np*par1))
{
j = j + 1
arr[j,k] <- x[i]
if (j == par1) {
j = 0
k=k+1
}
}
arr
arr.mean <- array(NA,dim=np)
arr.sd <- array(NA,dim=np)
arr.range <- array(NA,dim=np)
for (j in 1:np)
{
arr.mean[j] <- mean(arr[,j],na.rm=TRUE)
arr.sd[j] <- sd(arr[,j],na.rm=TRUE)
arr.range[j] <- max(arr[,j],na.rm=TRUE) - min(arr[,j],na.rm=TRUE)
}
arr.mean
arr.sd
arr.range
(lm1 <- lm(arr.sd~arr.mean))
(lnlm1 <- lm(log(arr.sd)~log(arr.mean)))
(lm2 <- lm(arr.range~arr.mean))
bitmap(file='test1.png')
plot(arr.mean,arr.sd,main='Standard Deviation-Mean Plot',xlab='mean',ylab='standard deviation')
dev.off()
bitmap(file='test2.png')
plot(arr.mean,arr.range,main='Range-Mean Plot',xlab='mean',ylab='range')
dev.off()
load(file='createtable')
a<-table.start()
a<-table.row.start(a)
a<-table.element(a,'Standard Deviation-Mean Plot',4,TRUE)
a<-table.row.end(a)
a<-table.row.start(a)
a<-table.element(a,'Section',header=TRUE)
a<-table.element(a,'Mean',header=TRUE)
a<-table.element(a,'Standard Deviation',header=TRUE)
a<-table.element(a,'Range',header=TRUE)
a<-table.row.end(a)
for (j in 1:np) {
a<-table.row.start(a)
a<-table.element(a,j,header=TRUE)
a<-table.element(a,arr.mean[j])
a<-table.element(a,arr.sd[j] )
a<-table.element(a,arr.range[j] )
a<-table.row.end(a)
}
a<-table.end(a)
table.save(a,file='mytable.tab')
a<-table.start()
a<-table.row.start(a)
a<-table.element(a,'Regression: S.E.(k) = alpha + beta * Mean(k)',2,TRUE)
a<-table.row.end(a)
a<-table.row.start(a)
a<-table.element(a,'alpha',header=TRUE)
a<-table.element(a,lm1$coefficients[[1]])
a<-table.row.end(a)
a<-table.row.start(a)
a<-table.element(a,'beta',header=TRUE)
a<-table.element(a,lm1$coefficients[[2]])
a<-table.row.end(a)
a<-table.row.start(a)
a<-table.element(a,'S.D.',header=TRUE)
a<-table.element(a,summary(lm1)$coefficients[2,2])
a<-table.row.end(a)
a<-table.row.start(a)
a<-table.element(a,'T-STAT',header=TRUE)
a<-table.element(a,summary(lm1)$coefficients[2,3])
a<-table.row.end(a)
a<-table.row.start(a)
a<-table.element(a,'p-value',header=TRUE)
a<-table.element(a,summary(lm1)$coefficients[2,4])
a<-table.row.end(a)
a<-table.end(a)
table.save(a,file='mytable1.tab')
a<-table.start()
a<-table.row.start(a)
a<-table.element(a,'Regression: ln S.E.(k) = alpha + beta * ln Mean(k)',2,TRUE)
a<-table.row.end(a)
a<-table.row.start(a)
a<-table.element(a,'alpha',header=TRUE)
a<-table.element(a,lnlm1$coefficients[[1]])
a<-table.row.end(a)
a<-table.row.start(a)
a<-table.element(a,'beta',header=TRUE)
a<-table.element(a,lnlm1$coefficients[[2]])
a<-table.row.end(a)
a<-table.row.start(a)
a<-table.element(a,'S.D.',header=TRUE)
a<-table.element(a,summary(lnlm1)$coefficients[2,2])
a<-table.row.end(a)
a<-table.row.start(a)
a<-table.element(a,'T-STAT',header=TRUE)
a<-table.element(a,summary(lnlm1)$coefficients[2,3])
a<-table.row.end(a)
a<-table.row.start(a)
a<-table.element(a,'p-value',header=TRUE)
a<-table.element(a,summary(lnlm1)$coefficients[2,4])
a<-table.row.end(a)
a<-table.row.start(a)
a<-table.element(a,'Lambda',header=TRUE)
a<-table.element(a,1-lnlm1$coefficients[[2]])
a<-table.row.end(a)
a<-table.end(a)
table.save(a,file='mytable2.tab')