Free Statistics

of Irreproducible Research!

Author's title

Author*Unverified author*
R Software Modulerwasp_autocorrelation.wasp
Title produced by software(Partial) Autocorrelation Function
Date of computationWed, 03 Jun 2009 01:46:35 -0600
Cite this page as followsStatistical Computations at FreeStatistics.org, Office for Research Development and Education, URL https://freestatistics.org/blog/index.php?v=date/2009/Jun/03/t1244015261ja9q27pia9jmavi.htm/, Retrieved Sat, 11 May 2024 19:41:04 +0000
Statistical Computations at FreeStatistics.org, Office for Research Development and Education, URL https://freestatistics.org/blog/index.php?pk=41409, Retrieved Sat, 11 May 2024 19:41:04 +0000
QR Codes:

Original text written by user:
IsPrivate?No (this computation is public)
User-defined keywords(Partial) Autocorrelation Function met trend datareeks jonge werkzoekenden onder de 25 jaar in Vlaanderen
Estimated Impact152
Family? (F = Feedback message, R = changed R code, M = changed R Module, P = changed Parameters, D = changed Data)
-     [Blocked Bootstrap Plot - Central Tendency] [blocked bootstrap...] [2009-06-03 06:30:22] [af2e14e160e92cc9abbae03c4f4c84fa]
- RMP   [(Partial) Autocorrelation Function] [(Partial) Autocor...] [2009-06-03 07:42:52] [af2e14e160e92cc9abbae03c4f4c84fa]
-   P       [(Partial) Autocorrelation Function] [(Partial) Autocor...] [2009-06-03 07:46:35] [bddbb8640adbf7d76f1766fd0c9aa6ca] [Current]
Feedback Forum

Post a new message
Dataseries X:
51772
48439
45716
43851
41622
45180
72550
77681
71177
63390
57386
56765
55772
53605
50338
47314
44596
47029
72490
78086
71058
63276
56918
55170
52980
50466
48553
46307
43796
45642
70765
75685
69220
62898
56011
54148
46626
46018
42408
42483
40113
41381
62348
63611
58389
46175
40555
37909
37866
34418
31736
29533
27604
30575
51345
52455
43367
37077
33016
33117
32279
30369
28983
27864
24591
29528
46549
47932
41584
37295
34666
36773
39591
39833


Summary of computational transaction
Raw Inputview raw input (R code)
Raw Outputview raw output of R engine
Computing time1 seconds
R Server'George Udny Yule' @ 72.249.76.132

\begin{tabular}{lllllllll}
\hline
Summary of computational transaction \tabularnewline
Raw Input & view raw input (R code)  \tabularnewline
Raw Output & view raw output of R engine  \tabularnewline
Computing time & 1 seconds \tabularnewline
R Server & 'George Udny Yule' @ 72.249.76.132 \tabularnewline
\hline
\end{tabular}
%Source: https://freestatistics.org/blog/index.php?pk=41409&T=0

[TABLE]
[ROW][C]Summary of computational transaction[/C][/ROW]
[ROW][C]Raw Input[/C][C]view raw input (R code) [/C][/ROW]
[ROW][C]Raw Output[/C][C]view raw output of R engine [/C][/ROW]
[ROW][C]Computing time[/C][C]1 seconds[/C][/ROW]
[ROW][C]R Server[/C][C]'George Udny Yule' @ 72.249.76.132[/C][/ROW]
[/TABLE]
Source: https://freestatistics.org/blog/index.php?pk=41409&T=0

Globally Unique Identifier (entire table): ba.freestatistics.org/blog/index.php?pk=41409&T=0

As an alternative you can also use a QR Code:  

The GUIDs for individual cells are displayed in the table below:

Summary of computational transaction
Raw Inputview raw input (R code)
Raw Outputview raw output of R engine
Computing time1 seconds
R Server'George Udny Yule' @ 72.249.76.132


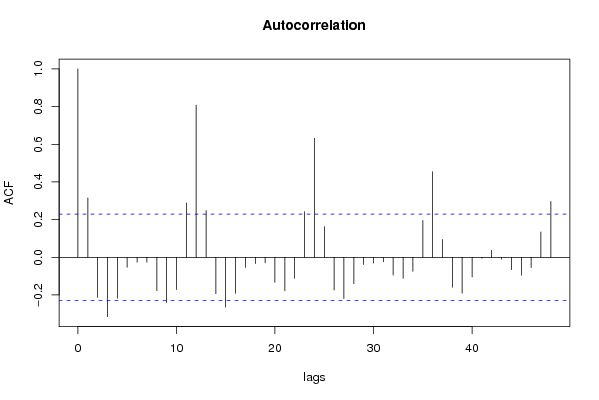
Autocorrelation Function
Time lag kACF(k)T-STATP-value
10.3150242.69160.004406
2-0.212959-1.81950.036466
3-0.315318-2.69410.004376
4-0.217411-1.85760.033632
5-0.053493-0.4570.324497
6-0.026196-0.22380.411762
7-0.026138-0.22330.411954
8-0.177464-1.51630.066887
9-0.239993-2.05050.021953
10-0.171423-1.46460.073656
110.2886392.46610.008003
120.8077076.90110
130.2479272.11830.018777
14-0.19325-1.65110.051504
15-0.264254-2.25780.013475
16-0.191127-1.6330.053389
17-0.05392-0.46070.323196
18-0.033485-0.28610.387806
19-0.029625-0.25310.400445
20-0.132963-1.1360.129829
21-0.178377-1.5240.065908
22-0.11186-0.95570.171182
230.2417862.06580.021198
240.6318775.39880
250.1622831.38650.0849
26-0.173906-1.48590.070812
27-0.219272-1.87350.032504
28-0.141049-1.20510.116024
29-0.038624-0.330.371172
30-0.031033-0.26510.395823
31-0.024052-0.20550.418875
32-0.094689-0.8090.210565
33-0.112-0.95690.17088
34-0.074589-0.63730.262966
350.1954831.67020.04958
360.454733.88520.000111
370.0944730.80720.211092
38-0.158947-1.3580.089316
39-0.190621-1.62870.053846
40-0.105019-0.89730.186259
41-0.004688-0.04010.484081
420.0367420.31390.377236
43-0.010162-0.08680.465525
44-0.066247-0.5660.286559
45-0.094931-0.81110.209974
46-0.054588-0.46640.32116
470.1347661.15140.126655
480.2967372.53530.006688

\begin{tabular}{lllllllll}
\hline
Autocorrelation Function \tabularnewline
Time lag k & ACF(k) & T-STAT & P-value \tabularnewline
1 & 0.315024 & 2.6916 & 0.004406 \tabularnewline
2 & -0.212959 & -1.8195 & 0.036466 \tabularnewline
3 & -0.315318 & -2.6941 & 0.004376 \tabularnewline
4 & -0.217411 & -1.8576 & 0.033632 \tabularnewline
5 & -0.053493 & -0.457 & 0.324497 \tabularnewline
6 & -0.026196 & -0.2238 & 0.411762 \tabularnewline
7 & -0.026138 & -0.2233 & 0.411954 \tabularnewline
8 & -0.177464 & -1.5163 & 0.066887 \tabularnewline
9 & -0.239993 & -2.0505 & 0.021953 \tabularnewline
10 & -0.171423 & -1.4646 & 0.073656 \tabularnewline
11 & 0.288639 & 2.4661 & 0.008003 \tabularnewline
12 & 0.807707 & 6.9011 & 0 \tabularnewline
13 & 0.247927 & 2.1183 & 0.018777 \tabularnewline
14 & -0.19325 & -1.6511 & 0.051504 \tabularnewline
15 & -0.264254 & -2.2578 & 0.013475 \tabularnewline
16 & -0.191127 & -1.633 & 0.053389 \tabularnewline
17 & -0.05392 & -0.4607 & 0.323196 \tabularnewline
18 & -0.033485 & -0.2861 & 0.387806 \tabularnewline
19 & -0.029625 & -0.2531 & 0.400445 \tabularnewline
20 & -0.132963 & -1.136 & 0.129829 \tabularnewline
21 & -0.178377 & -1.524 & 0.065908 \tabularnewline
22 & -0.11186 & -0.9557 & 0.171182 \tabularnewline
23 & 0.241786 & 2.0658 & 0.021198 \tabularnewline
24 & 0.631877 & 5.3988 & 0 \tabularnewline
25 & 0.162283 & 1.3865 & 0.0849 \tabularnewline
26 & -0.173906 & -1.4859 & 0.070812 \tabularnewline
27 & -0.219272 & -1.8735 & 0.032504 \tabularnewline
28 & -0.141049 & -1.2051 & 0.116024 \tabularnewline
29 & -0.038624 & -0.33 & 0.371172 \tabularnewline
30 & -0.031033 & -0.2651 & 0.395823 \tabularnewline
31 & -0.024052 & -0.2055 & 0.418875 \tabularnewline
32 & -0.094689 & -0.809 & 0.210565 \tabularnewline
33 & -0.112 & -0.9569 & 0.17088 \tabularnewline
34 & -0.074589 & -0.6373 & 0.262966 \tabularnewline
35 & 0.195483 & 1.6702 & 0.04958 \tabularnewline
36 & 0.45473 & 3.8852 & 0.000111 \tabularnewline
37 & 0.094473 & 0.8072 & 0.211092 \tabularnewline
38 & -0.158947 & -1.358 & 0.089316 \tabularnewline
39 & -0.190621 & -1.6287 & 0.053846 \tabularnewline
40 & -0.105019 & -0.8973 & 0.186259 \tabularnewline
41 & -0.004688 & -0.0401 & 0.484081 \tabularnewline
42 & 0.036742 & 0.3139 & 0.377236 \tabularnewline
43 & -0.010162 & -0.0868 & 0.465525 \tabularnewline
44 & -0.066247 & -0.566 & 0.286559 \tabularnewline
45 & -0.094931 & -0.8111 & 0.209974 \tabularnewline
46 & -0.054588 & -0.4664 & 0.32116 \tabularnewline
47 & 0.134766 & 1.1514 & 0.126655 \tabularnewline
48 & 0.296737 & 2.5353 & 0.006688 \tabularnewline
\hline
\end{tabular}
%Source: https://freestatistics.org/blog/index.php?pk=41409&T=1

[TABLE]
[ROW][C]Autocorrelation Function[/C][/ROW]
[ROW][C]Time lag k[/C][C]ACF(k)[/C][C]T-STAT[/C][C]P-value[/C][/ROW]
[ROW][C]1[/C][C]0.315024[/C][C]2.6916[/C][C]0.004406[/C][/ROW]
[ROW][C]2[/C][C]-0.212959[/C][C]-1.8195[/C][C]0.036466[/C][/ROW]
[ROW][C]3[/C][C]-0.315318[/C][C]-2.6941[/C][C]0.004376[/C][/ROW]
[ROW][C]4[/C][C]-0.217411[/C][C]-1.8576[/C][C]0.033632[/C][/ROW]
[ROW][C]5[/C][C]-0.053493[/C][C]-0.457[/C][C]0.324497[/C][/ROW]
[ROW][C]6[/C][C]-0.026196[/C][C]-0.2238[/C][C]0.411762[/C][/ROW]
[ROW][C]7[/C][C]-0.026138[/C][C]-0.2233[/C][C]0.411954[/C][/ROW]
[ROW][C]8[/C][C]-0.177464[/C][C]-1.5163[/C][C]0.066887[/C][/ROW]
[ROW][C]9[/C][C]-0.239993[/C][C]-2.0505[/C][C]0.021953[/C][/ROW]
[ROW][C]10[/C][C]-0.171423[/C][C]-1.4646[/C][C]0.073656[/C][/ROW]
[ROW][C]11[/C][C]0.288639[/C][C]2.4661[/C][C]0.008003[/C][/ROW]
[ROW][C]12[/C][C]0.807707[/C][C]6.9011[/C][C]0[/C][/ROW]
[ROW][C]13[/C][C]0.247927[/C][C]2.1183[/C][C]0.018777[/C][/ROW]
[ROW][C]14[/C][C]-0.19325[/C][C]-1.6511[/C][C]0.051504[/C][/ROW]
[ROW][C]15[/C][C]-0.264254[/C][C]-2.2578[/C][C]0.013475[/C][/ROW]
[ROW][C]16[/C][C]-0.191127[/C][C]-1.633[/C][C]0.053389[/C][/ROW]
[ROW][C]17[/C][C]-0.05392[/C][C]-0.4607[/C][C]0.323196[/C][/ROW]
[ROW][C]18[/C][C]-0.033485[/C][C]-0.2861[/C][C]0.387806[/C][/ROW]
[ROW][C]19[/C][C]-0.029625[/C][C]-0.2531[/C][C]0.400445[/C][/ROW]
[ROW][C]20[/C][C]-0.132963[/C][C]-1.136[/C][C]0.129829[/C][/ROW]
[ROW][C]21[/C][C]-0.178377[/C][C]-1.524[/C][C]0.065908[/C][/ROW]
[ROW][C]22[/C][C]-0.11186[/C][C]-0.9557[/C][C]0.171182[/C][/ROW]
[ROW][C]23[/C][C]0.241786[/C][C]2.0658[/C][C]0.021198[/C][/ROW]
[ROW][C]24[/C][C]0.631877[/C][C]5.3988[/C][C]0[/C][/ROW]
[ROW][C]25[/C][C]0.162283[/C][C]1.3865[/C][C]0.0849[/C][/ROW]
[ROW][C]26[/C][C]-0.173906[/C][C]-1.4859[/C][C]0.070812[/C][/ROW]
[ROW][C]27[/C][C]-0.219272[/C][C]-1.8735[/C][C]0.032504[/C][/ROW]
[ROW][C]28[/C][C]-0.141049[/C][C]-1.2051[/C][C]0.116024[/C][/ROW]
[ROW][C]29[/C][C]-0.038624[/C][C]-0.33[/C][C]0.371172[/C][/ROW]
[ROW][C]30[/C][C]-0.031033[/C][C]-0.2651[/C][C]0.395823[/C][/ROW]
[ROW][C]31[/C][C]-0.024052[/C][C]-0.2055[/C][C]0.418875[/C][/ROW]
[ROW][C]32[/C][C]-0.094689[/C][C]-0.809[/C][C]0.210565[/C][/ROW]
[ROW][C]33[/C][C]-0.112[/C][C]-0.9569[/C][C]0.17088[/C][/ROW]
[ROW][C]34[/C][C]-0.074589[/C][C]-0.6373[/C][C]0.262966[/C][/ROW]
[ROW][C]35[/C][C]0.195483[/C][C]1.6702[/C][C]0.04958[/C][/ROW]
[ROW][C]36[/C][C]0.45473[/C][C]3.8852[/C][C]0.000111[/C][/ROW]
[ROW][C]37[/C][C]0.094473[/C][C]0.8072[/C][C]0.211092[/C][/ROW]
[ROW][C]38[/C][C]-0.158947[/C][C]-1.358[/C][C]0.089316[/C][/ROW]
[ROW][C]39[/C][C]-0.190621[/C][C]-1.6287[/C][C]0.053846[/C][/ROW]
[ROW][C]40[/C][C]-0.105019[/C][C]-0.8973[/C][C]0.186259[/C][/ROW]
[ROW][C]41[/C][C]-0.004688[/C][C]-0.0401[/C][C]0.484081[/C][/ROW]
[ROW][C]42[/C][C]0.036742[/C][C]0.3139[/C][C]0.377236[/C][/ROW]
[ROW][C]43[/C][C]-0.010162[/C][C]-0.0868[/C][C]0.465525[/C][/ROW]
[ROW][C]44[/C][C]-0.066247[/C][C]-0.566[/C][C]0.286559[/C][/ROW]
[ROW][C]45[/C][C]-0.094931[/C][C]-0.8111[/C][C]0.209974[/C][/ROW]
[ROW][C]46[/C][C]-0.054588[/C][C]-0.4664[/C][C]0.32116[/C][/ROW]
[ROW][C]47[/C][C]0.134766[/C][C]1.1514[/C][C]0.126655[/C][/ROW]
[ROW][C]48[/C][C]0.296737[/C][C]2.5353[/C][C]0.006688[/C][/ROW]
[/TABLE]
Source: https://freestatistics.org/blog/index.php?pk=41409&T=1

Globally Unique Identifier (entire table): ba.freestatistics.org/blog/index.php?pk=41409&T=1

As an alternative you can also use a QR Code:  

The GUIDs for individual cells are displayed in the table below:

Autocorrelation Function
Time lag kACF(k)T-STATP-value
10.3150242.69160.004406
2-0.212959-1.81950.036466
3-0.315318-2.69410.004376
4-0.217411-1.85760.033632
5-0.053493-0.4570.324497
6-0.026196-0.22380.411762
7-0.026138-0.22330.411954
8-0.177464-1.51630.066887
9-0.239993-2.05050.021953
10-0.171423-1.46460.073656
110.2886392.46610.008003
120.8077076.90110
130.2479272.11830.018777
14-0.19325-1.65110.051504
15-0.264254-2.25780.013475
16-0.191127-1.6330.053389
17-0.05392-0.46070.323196
18-0.033485-0.28610.387806
19-0.029625-0.25310.400445
20-0.132963-1.1360.129829
21-0.178377-1.5240.065908
22-0.11186-0.95570.171182
230.2417862.06580.021198
240.6318775.39880
250.1622831.38650.0849
26-0.173906-1.48590.070812
27-0.219272-1.87350.032504
28-0.141049-1.20510.116024
29-0.038624-0.330.371172
30-0.031033-0.26510.395823
31-0.024052-0.20550.418875
32-0.094689-0.8090.210565
33-0.112-0.95690.17088
34-0.074589-0.63730.262966
350.1954831.67020.04958
360.454733.88520.000111
370.0944730.80720.211092
38-0.158947-1.3580.089316
39-0.190621-1.62870.053846
40-0.105019-0.89730.186259
41-0.004688-0.04010.484081
420.0367420.31390.377236
43-0.010162-0.08680.465525
44-0.066247-0.5660.286559
45-0.094931-0.81110.209974
46-0.054588-0.46640.32116
470.1347661.15140.126655
480.2967372.53530.006688


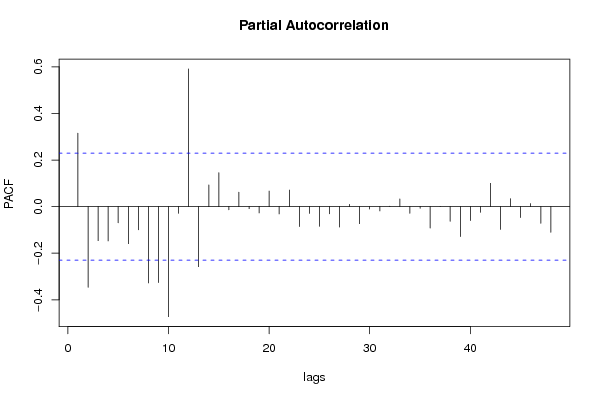
Partial Autocorrelation Function
Time lag kPACF(k)T-STATP-value
10.3150242.69160.004406
2-0.346596-2.96130.002065
3-0.146101-1.24830.107957
4-0.147239-1.2580.106198
5-0.069749-0.59590.276531
6-0.159369-1.36160.088748
7-0.099859-0.85320.19817
8-0.327948-2.8020.003249
9-0.326188-2.7870.003389
10-0.472421-4.03646.6e-05
11-0.028683-0.24510.403546
120.5908255.0482e-06
13-0.258199-2.2060.015264
140.0928110.7930.215181
150.1453761.24210.109089
16-0.013815-0.1180.453181
170.0620620.53030.298773
18-0.008925-0.07630.469713
19-0.027283-0.23310.408165
200.0668470.57110.284828
21-0.03136-0.26790.39475
220.0709280.6060.273194
23-0.085727-0.73250.233119
24-0.029627-0.25310.400437
25-0.084813-0.72460.235495
26-0.031182-0.26640.395333
27-0.087861-0.75070.227629
280.009520.08130.467697
29-0.073551-0.62840.265846
30-0.010542-0.09010.464238
31-0.0188-0.16060.436415
320.0016910.01440.494256
330.0328980.28110.389722
34-0.028778-0.24590.403233
35-0.007624-0.06510.474119
36-0.09208-0.78670.216994
370.0005490.00470.498136
38-0.063343-0.54120.295008
39-0.128506-1.0980.137917
40-0.060064-0.51320.304686
41-0.024797-0.21190.416402
420.1000130.85450.197808
43-0.097962-0.8370.202665
440.0338460.28920.38663
45-0.046998-0.40160.344594
460.0129280.11050.456174
47-0.071937-0.61460.270356
48-0.110555-0.94460.173994

\begin{tabular}{lllllllll}
\hline
Partial Autocorrelation Function \tabularnewline
Time lag k & PACF(k) & T-STAT & P-value \tabularnewline
1 & 0.315024 & 2.6916 & 0.004406 \tabularnewline
2 & -0.346596 & -2.9613 & 0.002065 \tabularnewline
3 & -0.146101 & -1.2483 & 0.107957 \tabularnewline
4 & -0.147239 & -1.258 & 0.106198 \tabularnewline
5 & -0.069749 & -0.5959 & 0.276531 \tabularnewline
6 & -0.159369 & -1.3616 & 0.088748 \tabularnewline
7 & -0.099859 & -0.8532 & 0.19817 \tabularnewline
8 & -0.327948 & -2.802 & 0.003249 \tabularnewline
9 & -0.326188 & -2.787 & 0.003389 \tabularnewline
10 & -0.472421 & -4.0364 & 6.6e-05 \tabularnewline
11 & -0.028683 & -0.2451 & 0.403546 \tabularnewline
12 & 0.590825 & 5.048 & 2e-06 \tabularnewline
13 & -0.258199 & -2.206 & 0.015264 \tabularnewline
14 & 0.092811 & 0.793 & 0.215181 \tabularnewline
15 & 0.145376 & 1.2421 & 0.109089 \tabularnewline
16 & -0.013815 & -0.118 & 0.453181 \tabularnewline
17 & 0.062062 & 0.5303 & 0.298773 \tabularnewline
18 & -0.008925 & -0.0763 & 0.469713 \tabularnewline
19 & -0.027283 & -0.2331 & 0.408165 \tabularnewline
20 & 0.066847 & 0.5711 & 0.284828 \tabularnewline
21 & -0.03136 & -0.2679 & 0.39475 \tabularnewline
22 & 0.070928 & 0.606 & 0.273194 \tabularnewline
23 & -0.085727 & -0.7325 & 0.233119 \tabularnewline
24 & -0.029627 & -0.2531 & 0.400437 \tabularnewline
25 & -0.084813 & -0.7246 & 0.235495 \tabularnewline
26 & -0.031182 & -0.2664 & 0.395333 \tabularnewline
27 & -0.087861 & -0.7507 & 0.227629 \tabularnewline
28 & 0.00952 & 0.0813 & 0.467697 \tabularnewline
29 & -0.073551 & -0.6284 & 0.265846 \tabularnewline
30 & -0.010542 & -0.0901 & 0.464238 \tabularnewline
31 & -0.0188 & -0.1606 & 0.436415 \tabularnewline
32 & 0.001691 & 0.0144 & 0.494256 \tabularnewline
33 & 0.032898 & 0.2811 & 0.389722 \tabularnewline
34 & -0.028778 & -0.2459 & 0.403233 \tabularnewline
35 & -0.007624 & -0.0651 & 0.474119 \tabularnewline
36 & -0.09208 & -0.7867 & 0.216994 \tabularnewline
37 & 0.000549 & 0.0047 & 0.498136 \tabularnewline
38 & -0.063343 & -0.5412 & 0.295008 \tabularnewline
39 & -0.128506 & -1.098 & 0.137917 \tabularnewline
40 & -0.060064 & -0.5132 & 0.304686 \tabularnewline
41 & -0.024797 & -0.2119 & 0.416402 \tabularnewline
42 & 0.100013 & 0.8545 & 0.197808 \tabularnewline
43 & -0.097962 & -0.837 & 0.202665 \tabularnewline
44 & 0.033846 & 0.2892 & 0.38663 \tabularnewline
45 & -0.046998 & -0.4016 & 0.344594 \tabularnewline
46 & 0.012928 & 0.1105 & 0.456174 \tabularnewline
47 & -0.071937 & -0.6146 & 0.270356 \tabularnewline
48 & -0.110555 & -0.9446 & 0.173994 \tabularnewline
\hline
\end{tabular}
%Source: https://freestatistics.org/blog/index.php?pk=41409&T=2

[TABLE]
[ROW][C]Partial Autocorrelation Function[/C][/ROW]
[ROW][C]Time lag k[/C][C]PACF(k)[/C][C]T-STAT[/C][C]P-value[/C][/ROW]
[ROW][C]1[/C][C]0.315024[/C][C]2.6916[/C][C]0.004406[/C][/ROW]
[ROW][C]2[/C][C]-0.346596[/C][C]-2.9613[/C][C]0.002065[/C][/ROW]
[ROW][C]3[/C][C]-0.146101[/C][C]-1.2483[/C][C]0.107957[/C][/ROW]
[ROW][C]4[/C][C]-0.147239[/C][C]-1.258[/C][C]0.106198[/C][/ROW]
[ROW][C]5[/C][C]-0.069749[/C][C]-0.5959[/C][C]0.276531[/C][/ROW]
[ROW][C]6[/C][C]-0.159369[/C][C]-1.3616[/C][C]0.088748[/C][/ROW]
[ROW][C]7[/C][C]-0.099859[/C][C]-0.8532[/C][C]0.19817[/C][/ROW]
[ROW][C]8[/C][C]-0.327948[/C][C]-2.802[/C][C]0.003249[/C][/ROW]
[ROW][C]9[/C][C]-0.326188[/C][C]-2.787[/C][C]0.003389[/C][/ROW]
[ROW][C]10[/C][C]-0.472421[/C][C]-4.0364[/C][C]6.6e-05[/C][/ROW]
[ROW][C]11[/C][C]-0.028683[/C][C]-0.2451[/C][C]0.403546[/C][/ROW]
[ROW][C]12[/C][C]0.590825[/C][C]5.048[/C][C]2e-06[/C][/ROW]
[ROW][C]13[/C][C]-0.258199[/C][C]-2.206[/C][C]0.015264[/C][/ROW]
[ROW][C]14[/C][C]0.092811[/C][C]0.793[/C][C]0.215181[/C][/ROW]
[ROW][C]15[/C][C]0.145376[/C][C]1.2421[/C][C]0.109089[/C][/ROW]
[ROW][C]16[/C][C]-0.013815[/C][C]-0.118[/C][C]0.453181[/C][/ROW]
[ROW][C]17[/C][C]0.062062[/C][C]0.5303[/C][C]0.298773[/C][/ROW]
[ROW][C]18[/C][C]-0.008925[/C][C]-0.0763[/C][C]0.469713[/C][/ROW]
[ROW][C]19[/C][C]-0.027283[/C][C]-0.2331[/C][C]0.408165[/C][/ROW]
[ROW][C]20[/C][C]0.066847[/C][C]0.5711[/C][C]0.284828[/C][/ROW]
[ROW][C]21[/C][C]-0.03136[/C][C]-0.2679[/C][C]0.39475[/C][/ROW]
[ROW][C]22[/C][C]0.070928[/C][C]0.606[/C][C]0.273194[/C][/ROW]
[ROW][C]23[/C][C]-0.085727[/C][C]-0.7325[/C][C]0.233119[/C][/ROW]
[ROW][C]24[/C][C]-0.029627[/C][C]-0.2531[/C][C]0.400437[/C][/ROW]
[ROW][C]25[/C][C]-0.084813[/C][C]-0.7246[/C][C]0.235495[/C][/ROW]
[ROW][C]26[/C][C]-0.031182[/C][C]-0.2664[/C][C]0.395333[/C][/ROW]
[ROW][C]27[/C][C]-0.087861[/C][C]-0.7507[/C][C]0.227629[/C][/ROW]
[ROW][C]28[/C][C]0.00952[/C][C]0.0813[/C][C]0.467697[/C][/ROW]
[ROW][C]29[/C][C]-0.073551[/C][C]-0.6284[/C][C]0.265846[/C][/ROW]
[ROW][C]30[/C][C]-0.010542[/C][C]-0.0901[/C][C]0.464238[/C][/ROW]
[ROW][C]31[/C][C]-0.0188[/C][C]-0.1606[/C][C]0.436415[/C][/ROW]
[ROW][C]32[/C][C]0.001691[/C][C]0.0144[/C][C]0.494256[/C][/ROW]
[ROW][C]33[/C][C]0.032898[/C][C]0.2811[/C][C]0.389722[/C][/ROW]
[ROW][C]34[/C][C]-0.028778[/C][C]-0.2459[/C][C]0.403233[/C][/ROW]
[ROW][C]35[/C][C]-0.007624[/C][C]-0.0651[/C][C]0.474119[/C][/ROW]
[ROW][C]36[/C][C]-0.09208[/C][C]-0.7867[/C][C]0.216994[/C][/ROW]
[ROW][C]37[/C][C]0.000549[/C][C]0.0047[/C][C]0.498136[/C][/ROW]
[ROW][C]38[/C][C]-0.063343[/C][C]-0.5412[/C][C]0.295008[/C][/ROW]
[ROW][C]39[/C][C]-0.128506[/C][C]-1.098[/C][C]0.137917[/C][/ROW]
[ROW][C]40[/C][C]-0.060064[/C][C]-0.5132[/C][C]0.304686[/C][/ROW]
[ROW][C]41[/C][C]-0.024797[/C][C]-0.2119[/C][C]0.416402[/C][/ROW]
[ROW][C]42[/C][C]0.100013[/C][C]0.8545[/C][C]0.197808[/C][/ROW]
[ROW][C]43[/C][C]-0.097962[/C][C]-0.837[/C][C]0.202665[/C][/ROW]
[ROW][C]44[/C][C]0.033846[/C][C]0.2892[/C][C]0.38663[/C][/ROW]
[ROW][C]45[/C][C]-0.046998[/C][C]-0.4016[/C][C]0.344594[/C][/ROW]
[ROW][C]46[/C][C]0.012928[/C][C]0.1105[/C][C]0.456174[/C][/ROW]
[ROW][C]47[/C][C]-0.071937[/C][C]-0.6146[/C][C]0.270356[/C][/ROW]
[ROW][C]48[/C][C]-0.110555[/C][C]-0.9446[/C][C]0.173994[/C][/ROW]
[/TABLE]
Source: https://freestatistics.org/blog/index.php?pk=41409&T=2

Globally Unique Identifier (entire table): ba.freestatistics.org/blog/index.php?pk=41409&T=2

As an alternative you can also use a QR Code:  

The GUIDs for individual cells are displayed in the table below:

Partial Autocorrelation Function
Time lag kPACF(k)T-STATP-value
10.3150242.69160.004406
2-0.346596-2.96130.002065
3-0.146101-1.24830.107957
4-0.147239-1.2580.106198
5-0.069749-0.59590.276531
6-0.159369-1.36160.088748
7-0.099859-0.85320.19817
8-0.327948-2.8020.003249
9-0.326188-2.7870.003389
10-0.472421-4.03646.6e-05
11-0.028683-0.24510.403546
120.5908255.0482e-06
13-0.258199-2.2060.015264
140.0928110.7930.215181
150.1453761.24210.109089
16-0.013815-0.1180.453181
170.0620620.53030.298773
18-0.008925-0.07630.469713
19-0.027283-0.23310.408165
200.0668470.57110.284828
21-0.03136-0.26790.39475
220.0709280.6060.273194
23-0.085727-0.73250.233119
24-0.029627-0.25310.400437
25-0.084813-0.72460.235495
26-0.031182-0.26640.395333
27-0.087861-0.75070.227629
280.009520.08130.467697
29-0.073551-0.62840.265846
30-0.010542-0.09010.464238
31-0.0188-0.16060.436415
320.0016910.01440.494256
330.0328980.28110.389722
34-0.028778-0.24590.403233
35-0.007624-0.06510.474119
36-0.09208-0.78670.216994
370.0005490.00470.498136
38-0.063343-0.54120.295008
39-0.128506-1.0980.137917
40-0.060064-0.51320.304686
41-0.024797-0.21190.416402
420.1000130.85450.197808
43-0.097962-0.8370.202665
440.0338460.28920.38663
45-0.046998-0.40160.344594
460.0129280.11050.456174
47-0.071937-0.61460.270356
48-0.110555-0.94460.173994


Parameters (Session):
par1 = 48 ; par2 = 1 ; par3 = 1 ; par4 = 0 ; par5 = 12 ;
Parameters (R input):
par1 = 48 ; par2 = 1 ; par3 = 1 ; par4 = 0 ; par5 = 12 ;
R code (references can be found in the software module):
if (par1 == 'Default') {
par1 = 10*log10(length(x))
} else {
par1 <- as.numeric(par1)
}
par2 <- as.numeric(par2)
par3 <- as.numeric(par3)
par4 <- as.numeric(par4)
par5 <- as.numeric(par5)
if (par2 == 0) {
x <- log(x)
} else {
x <- (x ^ par2 - 1) / par2
}
if (par3 > 0) x <- diff(x,lag=1,difference=par3)
if (par4 > 0) x <- diff(x,lag=par5,difference=par4)
bitmap(file='pic1.png')
racf <- acf(x,par1,main='Autocorrelation',xlab='lags',ylab='ACF')
dev.off()
bitmap(file='pic2.png')
rpacf <- pacf(x,par1,main='Partial Autocorrelation',xlab='lags',ylab='PACF')
dev.off()
(myacf <- c(racf$acf))
(mypacf <- c(rpacf$acf))
lengthx <- length(x)
sqrtn <- sqrt(lengthx)
load(file='createtable')
a<-table.start()
a<-table.row.start(a)
a<-table.element(a,'Autocorrelation Function',4,TRUE)
a<-table.row.end(a)
a<-table.row.start(a)
a<-table.element(a,'Time lag k',header=TRUE)
a<-table.element(a,hyperlink('basics.htm','ACF(k)','click here for more information about the Autocorrelation Function'),header=TRUE)
a<-table.element(a,'T-STAT',header=TRUE)
a<-table.element(a,'P-value',header=TRUE)
a<-table.row.end(a)
for (i in 2:(par1+1)) {
a<-table.row.start(a)
a<-table.element(a,i-1,header=TRUE)
a<-table.element(a,round(myacf[i],6))
mytstat <- myacf[i]*sqrtn
a<-table.element(a,round(mytstat,4))
a<-table.element(a,round(1-pt(abs(mytstat),lengthx),6))
a<-table.row.end(a)
}
a<-table.end(a)
table.save(a,file='mytable.tab')
a<-table.start()
a<-table.row.start(a)
a<-table.element(a,'Partial Autocorrelation Function',4,TRUE)
a<-table.row.end(a)
a<-table.row.start(a)
a<-table.element(a,'Time lag k',header=TRUE)
a<-table.element(a,hyperlink('basics.htm','PACF(k)','click here for more information about the Partial Autocorrelation Function'),header=TRUE)
a<-table.element(a,'T-STAT',header=TRUE)
a<-table.element(a,'P-value',header=TRUE)
a<-table.row.end(a)
for (i in 1:par1) {
a<-table.row.start(a)
a<-table.element(a,i,header=TRUE)
a<-table.element(a,round(mypacf[i],6))
mytstat <- mypacf[i]*sqrtn
a<-table.element(a,round(mytstat,4))
a<-table.element(a,round(1-pt(abs(mytstat),lengthx),6))
a<-table.row.end(a)
}
a<-table.end(a)
table.save(a,file='mytable1.tab')