Free Statistics

of Irreproducible Research!

Author's title

Author*Unverified author*
R Software Modulerwasp_autocorrelation.wasp
Title produced by software(Partial) Autocorrelation Function
Date of computationWed, 03 Jun 2009 01:42:52 -0600
Cite this page as followsStatistical Computations at FreeStatistics.org, Office for Research Development and Education, URL https://freestatistics.org/blog/index.php?v=date/2009/Jun/03/t12440150901sw9gavpqaawgaz.htm/, Retrieved Sun, 12 May 2024 02:46:32 +0000
Statistical Computations at FreeStatistics.org, Office for Research Development and Education, URL https://freestatistics.org/blog/index.php?pk=41408, Retrieved Sun, 12 May 2024 02:46:32 +0000
QR Codes:

Original text written by user:
IsPrivate?No (this computation is public)
User-defined keywords(Partial) Autocorrelation Function datareeks aantal jonge werkzoekenden onder de 25 jaar in Vlaanderen
Estimated Impact176
Family? (F = Feedback message, R = changed R code, M = changed R Module, P = changed Parameters, D = changed Data)
-     [Blocked Bootstrap Plot - Central Tendency] [blocked bootstrap...] [2009-06-03 06:30:22] [af2e14e160e92cc9abbae03c4f4c84fa]
- RMP     [(Partial) Autocorrelation Function] [(Partial) Autocor...] [2009-06-03 07:42:52] [bddbb8640adbf7d76f1766fd0c9aa6ca] [Current]
-   P       [(Partial) Autocorrelation Function] [(Partial) Autocor...] [2009-06-03 07:46:35] [af2e14e160e92cc9abbae03c4f4c84fa]
- RMPD      [Variability] [spreidingsmaten s...] [2009-06-03 08:08:49] [af2e14e160e92cc9abbae03c4f4c84fa]
Feedback Forum

Post a new message
Dataseries X:
51772
48439
45716
43851
41622
45180
72550
77681
71177
63390
57386
56765
55772
53605
50338
47314
44596
47029
72490
78086
71058
63276
56918
55170
52980
50466
48553
46307
43796
45642
70765
75685
69220
62898
56011
54148
46626
46018
42408
42483
40113
41381
62348
63611
58389
46175
40555
37909
37866
34418
31736
29533
27604
30575
51345
52455
43367
37077
33016
33117
32279
30369
28983
27864
24591
29528
46549
47932
41584
37295
34666
36773
39591
39833


Summary of computational transaction
Raw Inputview raw input (R code)
Raw Outputview raw output of R engine
Computing time1 seconds
R Server'George Udny Yule' @ 72.249.76.132

\begin{tabular}{lllllllll}
\hline
Summary of computational transaction \tabularnewline
Raw Input & view raw input (R code)  \tabularnewline
Raw Output & view raw output of R engine  \tabularnewline
Computing time & 1 seconds \tabularnewline
R Server & 'George Udny Yule' @ 72.249.76.132 \tabularnewline
\hline
\end{tabular}
%Source: https://freestatistics.org/blog/index.php?pk=41408&T=0

[TABLE]
[ROW][C]Summary of computational transaction[/C][/ROW]
[ROW][C]Raw Input[/C][C]view raw input (R code) [/C][/ROW]
[ROW][C]Raw Output[/C][C]view raw output of R engine [/C][/ROW]
[ROW][C]Computing time[/C][C]1 seconds[/C][/ROW]
[ROW][C]R Server[/C][C]'George Udny Yule' @ 72.249.76.132[/C][/ROW]
[/TABLE]
Source: https://freestatistics.org/blog/index.php?pk=41408&T=0

Globally Unique Identifier (entire table): ba.freestatistics.org/blog/index.php?pk=41408&T=0

As an alternative you can also use a QR Code:  

The GUIDs for individual cells are displayed in the table below:

Summary of computational transaction
Raw Inputview raw input (R code)
Raw Outputview raw output of R engine
Computing time1 seconds
R Server'George Udny Yule' @ 72.249.76.132


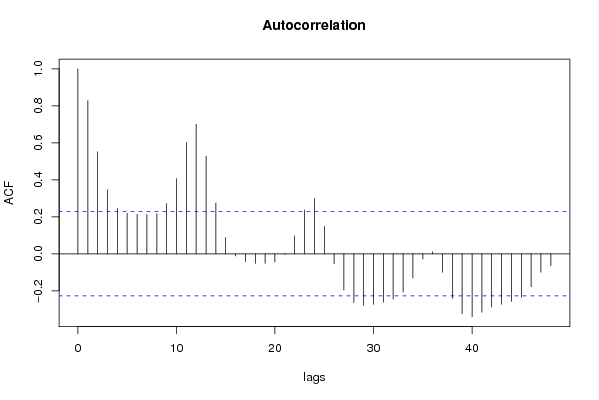
Autocorrelation Function
Time lag kACF(k)T-STATP-value
10.8286727.12850
20.5520914.74935e-06
30.3460132.97650.001969
40.2450572.10810.019206
50.2194381.88770.031495
60.2134341.8360.035185
70.2121141.82470.036043
80.2168481.86540.033045
90.2718772.33880.011025
100.4062223.49450.000403
110.6015915.17511e-06
120.7004066.02510
130.5284154.54561e-05
140.2745752.3620.010405
150.0869350.74780.228461
16-0.011252-0.09680.461575
17-0.041967-0.3610.359558
18-0.05137-0.44190.329924
19-0.05134-0.44160.330018
20-0.044013-0.37860.35303
21-0.003573-0.03070.48778
220.0967110.83190.204061
230.2372472.04090.022415
240.2980182.56360.006194
250.1483271.2760.10298
26-0.053261-0.45820.324086
27-0.195983-1.68590.048013
28-0.262792-2.26060.013362
29-0.277948-2.3910.009673
30-0.272863-2.34730.010795
31-0.261368-2.24840.013765
32-0.24421-2.10080.019534
33-0.206961-1.78030.039562
34-0.131398-1.13030.130994
35-0.027539-0.23690.406694
360.0108470.09330.462954
37-0.099353-0.85470.197746
38-0.240836-2.07180.020887
39-0.323043-2.77890.003455
40-0.339907-2.9240.002292
41-0.316249-2.72050.00406
42-0.287137-2.470.007907
43-0.272208-2.34160.010947
44-0.257313-2.21350.014973
45-0.234694-2.01890.023559
46-0.177955-1.53080.065038
47-0.099701-0.85770.196924
48-0.064565-0.55540.290146

\begin{tabular}{lllllllll}
\hline
Autocorrelation Function \tabularnewline
Time lag k & ACF(k) & T-STAT & P-value \tabularnewline
1 & 0.828672 & 7.1285 & 0 \tabularnewline
2 & 0.552091 & 4.7493 & 5e-06 \tabularnewline
3 & 0.346013 & 2.9765 & 0.001969 \tabularnewline
4 & 0.245057 & 2.1081 & 0.019206 \tabularnewline
5 & 0.219438 & 1.8877 & 0.031495 \tabularnewline
6 & 0.213434 & 1.836 & 0.035185 \tabularnewline
7 & 0.212114 & 1.8247 & 0.036043 \tabularnewline
8 & 0.216848 & 1.8654 & 0.033045 \tabularnewline
9 & 0.271877 & 2.3388 & 0.011025 \tabularnewline
10 & 0.406222 & 3.4945 & 0.000403 \tabularnewline
11 & 0.601591 & 5.1751 & 1e-06 \tabularnewline
12 & 0.700406 & 6.0251 & 0 \tabularnewline
13 & 0.528415 & 4.5456 & 1e-05 \tabularnewline
14 & 0.274575 & 2.362 & 0.010405 \tabularnewline
15 & 0.086935 & 0.7478 & 0.228461 \tabularnewline
16 & -0.011252 & -0.0968 & 0.461575 \tabularnewline
17 & -0.041967 & -0.361 & 0.359558 \tabularnewline
18 & -0.05137 & -0.4419 & 0.329924 \tabularnewline
19 & -0.05134 & -0.4416 & 0.330018 \tabularnewline
20 & -0.044013 & -0.3786 & 0.35303 \tabularnewline
21 & -0.003573 & -0.0307 & 0.48778 \tabularnewline
22 & 0.096711 & 0.8319 & 0.204061 \tabularnewline
23 & 0.237247 & 2.0409 & 0.022415 \tabularnewline
24 & 0.298018 & 2.5636 & 0.006194 \tabularnewline
25 & 0.148327 & 1.276 & 0.10298 \tabularnewline
26 & -0.053261 & -0.4582 & 0.324086 \tabularnewline
27 & -0.195983 & -1.6859 & 0.048013 \tabularnewline
28 & -0.262792 & -2.2606 & 0.013362 \tabularnewline
29 & -0.277948 & -2.391 & 0.009673 \tabularnewline
30 & -0.272863 & -2.3473 & 0.010795 \tabularnewline
31 & -0.261368 & -2.2484 & 0.013765 \tabularnewline
32 & -0.24421 & -2.1008 & 0.019534 \tabularnewline
33 & -0.206961 & -1.7803 & 0.039562 \tabularnewline
34 & -0.131398 & -1.1303 & 0.130994 \tabularnewline
35 & -0.027539 & -0.2369 & 0.406694 \tabularnewline
36 & 0.010847 & 0.0933 & 0.462954 \tabularnewline
37 & -0.099353 & -0.8547 & 0.197746 \tabularnewline
38 & -0.240836 & -2.0718 & 0.020887 \tabularnewline
39 & -0.323043 & -2.7789 & 0.003455 \tabularnewline
40 & -0.339907 & -2.924 & 0.002292 \tabularnewline
41 & -0.316249 & -2.7205 & 0.00406 \tabularnewline
42 & -0.287137 & -2.47 & 0.007907 \tabularnewline
43 & -0.272208 & -2.3416 & 0.010947 \tabularnewline
44 & -0.257313 & -2.2135 & 0.014973 \tabularnewline
45 & -0.234694 & -2.0189 & 0.023559 \tabularnewline
46 & -0.177955 & -1.5308 & 0.065038 \tabularnewline
47 & -0.099701 & -0.8577 & 0.196924 \tabularnewline
48 & -0.064565 & -0.5554 & 0.290146 \tabularnewline
\hline
\end{tabular}
%Source: https://freestatistics.org/blog/index.php?pk=41408&T=1

[TABLE]
[ROW][C]Autocorrelation Function[/C][/ROW]
[ROW][C]Time lag k[/C][C]ACF(k)[/C][C]T-STAT[/C][C]P-value[/C][/ROW]
[ROW][C]1[/C][C]0.828672[/C][C]7.1285[/C][C]0[/C][/ROW]
[ROW][C]2[/C][C]0.552091[/C][C]4.7493[/C][C]5e-06[/C][/ROW]
[ROW][C]3[/C][C]0.346013[/C][C]2.9765[/C][C]0.001969[/C][/ROW]
[ROW][C]4[/C][C]0.245057[/C][C]2.1081[/C][C]0.019206[/C][/ROW]
[ROW][C]5[/C][C]0.219438[/C][C]1.8877[/C][C]0.031495[/C][/ROW]
[ROW][C]6[/C][C]0.213434[/C][C]1.836[/C][C]0.035185[/C][/ROW]
[ROW][C]7[/C][C]0.212114[/C][C]1.8247[/C][C]0.036043[/C][/ROW]
[ROW][C]8[/C][C]0.216848[/C][C]1.8654[/C][C]0.033045[/C][/ROW]
[ROW][C]9[/C][C]0.271877[/C][C]2.3388[/C][C]0.011025[/C][/ROW]
[ROW][C]10[/C][C]0.406222[/C][C]3.4945[/C][C]0.000403[/C][/ROW]
[ROW][C]11[/C][C]0.601591[/C][C]5.1751[/C][C]1e-06[/C][/ROW]
[ROW][C]12[/C][C]0.700406[/C][C]6.0251[/C][C]0[/C][/ROW]
[ROW][C]13[/C][C]0.528415[/C][C]4.5456[/C][C]1e-05[/C][/ROW]
[ROW][C]14[/C][C]0.274575[/C][C]2.362[/C][C]0.010405[/C][/ROW]
[ROW][C]15[/C][C]0.086935[/C][C]0.7478[/C][C]0.228461[/C][/ROW]
[ROW][C]16[/C][C]-0.011252[/C][C]-0.0968[/C][C]0.461575[/C][/ROW]
[ROW][C]17[/C][C]-0.041967[/C][C]-0.361[/C][C]0.359558[/C][/ROW]
[ROW][C]18[/C][C]-0.05137[/C][C]-0.4419[/C][C]0.329924[/C][/ROW]
[ROW][C]19[/C][C]-0.05134[/C][C]-0.4416[/C][C]0.330018[/C][/ROW]
[ROW][C]20[/C][C]-0.044013[/C][C]-0.3786[/C][C]0.35303[/C][/ROW]
[ROW][C]21[/C][C]-0.003573[/C][C]-0.0307[/C][C]0.48778[/C][/ROW]
[ROW][C]22[/C][C]0.096711[/C][C]0.8319[/C][C]0.204061[/C][/ROW]
[ROW][C]23[/C][C]0.237247[/C][C]2.0409[/C][C]0.022415[/C][/ROW]
[ROW][C]24[/C][C]0.298018[/C][C]2.5636[/C][C]0.006194[/C][/ROW]
[ROW][C]25[/C][C]0.148327[/C][C]1.276[/C][C]0.10298[/C][/ROW]
[ROW][C]26[/C][C]-0.053261[/C][C]-0.4582[/C][C]0.324086[/C][/ROW]
[ROW][C]27[/C][C]-0.195983[/C][C]-1.6859[/C][C]0.048013[/C][/ROW]
[ROW][C]28[/C][C]-0.262792[/C][C]-2.2606[/C][C]0.013362[/C][/ROW]
[ROW][C]29[/C][C]-0.277948[/C][C]-2.391[/C][C]0.009673[/C][/ROW]
[ROW][C]30[/C][C]-0.272863[/C][C]-2.3473[/C][C]0.010795[/C][/ROW]
[ROW][C]31[/C][C]-0.261368[/C][C]-2.2484[/C][C]0.013765[/C][/ROW]
[ROW][C]32[/C][C]-0.24421[/C][C]-2.1008[/C][C]0.019534[/C][/ROW]
[ROW][C]33[/C][C]-0.206961[/C][C]-1.7803[/C][C]0.039562[/C][/ROW]
[ROW][C]34[/C][C]-0.131398[/C][C]-1.1303[/C][C]0.130994[/C][/ROW]
[ROW][C]35[/C][C]-0.027539[/C][C]-0.2369[/C][C]0.406694[/C][/ROW]
[ROW][C]36[/C][C]0.010847[/C][C]0.0933[/C][C]0.462954[/C][/ROW]
[ROW][C]37[/C][C]-0.099353[/C][C]-0.8547[/C][C]0.197746[/C][/ROW]
[ROW][C]38[/C][C]-0.240836[/C][C]-2.0718[/C][C]0.020887[/C][/ROW]
[ROW][C]39[/C][C]-0.323043[/C][C]-2.7789[/C][C]0.003455[/C][/ROW]
[ROW][C]40[/C][C]-0.339907[/C][C]-2.924[/C][C]0.002292[/C][/ROW]
[ROW][C]41[/C][C]-0.316249[/C][C]-2.7205[/C][C]0.00406[/C][/ROW]
[ROW][C]42[/C][C]-0.287137[/C][C]-2.47[/C][C]0.007907[/C][/ROW]
[ROW][C]43[/C][C]-0.272208[/C][C]-2.3416[/C][C]0.010947[/C][/ROW]
[ROW][C]44[/C][C]-0.257313[/C][C]-2.2135[/C][C]0.014973[/C][/ROW]
[ROW][C]45[/C][C]-0.234694[/C][C]-2.0189[/C][C]0.023559[/C][/ROW]
[ROW][C]46[/C][C]-0.177955[/C][C]-1.5308[/C][C]0.065038[/C][/ROW]
[ROW][C]47[/C][C]-0.099701[/C][C]-0.8577[/C][C]0.196924[/C][/ROW]
[ROW][C]48[/C][C]-0.064565[/C][C]-0.5554[/C][C]0.290146[/C][/ROW]
[/TABLE]
Source: https://freestatistics.org/blog/index.php?pk=41408&T=1

Globally Unique Identifier (entire table): ba.freestatistics.org/blog/index.php?pk=41408&T=1

As an alternative you can also use a QR Code:  

The GUIDs for individual cells are displayed in the table below:

Autocorrelation Function
Time lag kACF(k)T-STATP-value
10.8286727.12850
20.5520914.74935e-06
30.3460132.97650.001969
40.2450572.10810.019206
50.2194381.88770.031495
60.2134341.8360.035185
70.2121141.82470.036043
80.2168481.86540.033045
90.2718772.33880.011025
100.4062223.49450.000403
110.6015915.17511e-06
120.7004066.02510
130.5284154.54561e-05
140.2745752.3620.010405
150.0869350.74780.228461
16-0.011252-0.09680.461575
17-0.041967-0.3610.359558
18-0.05137-0.44190.329924
19-0.05134-0.44160.330018
20-0.044013-0.37860.35303
21-0.003573-0.03070.48778
220.0967110.83190.204061
230.2372472.04090.022415
240.2980182.56360.006194
250.1483271.2760.10298
26-0.053261-0.45820.324086
27-0.195983-1.68590.048013
28-0.262792-2.26060.013362
29-0.277948-2.3910.009673
30-0.272863-2.34730.010795
31-0.261368-2.24840.013765
32-0.24421-2.10080.019534
33-0.206961-1.78030.039562
34-0.131398-1.13030.130994
35-0.027539-0.23690.406694
360.0108470.09330.462954
37-0.099353-0.85470.197746
38-0.240836-2.07180.020887
39-0.323043-2.77890.003455
40-0.339907-2.9240.002292
41-0.316249-2.72050.00406
42-0.287137-2.470.007907
43-0.272208-2.34160.010947
44-0.257313-2.21350.014973
45-0.234694-2.01890.023559
46-0.177955-1.53080.065038
47-0.099701-0.85770.196924
48-0.064565-0.55540.290146


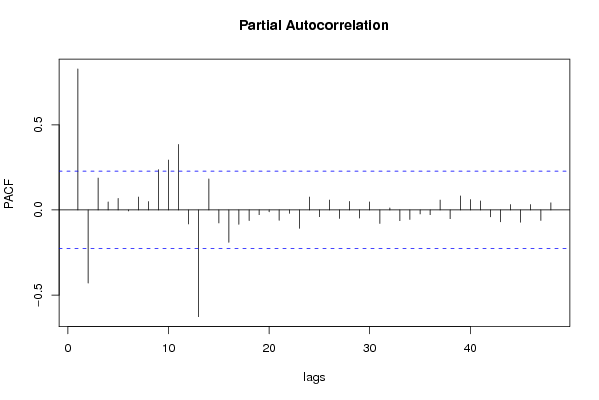
Partial Autocorrelation Function
Time lag kPACF(k)T-STATP-value
10.8286727.12850
2-0.429634-3.69590.000209
30.1878021.61550.055225
40.0471580.40570.343078
50.0679170.58420.280417
6-0.005419-0.04660.481474
70.0756210.65050.258686
80.0492570.42370.336497
90.2368992.03790.022568
100.2930052.52050.006936
110.3847613.30980.000722
12-0.082424-0.7090.240264
13-0.626985-5.39350
140.1821271.56670.060724
15-0.076344-0.65670.256695
16-0.18994-1.63390.053261
17-0.08425-0.72470.235448
18-0.062473-0.53740.296296
19-0.027808-0.23920.405799
20-0.011097-0.09550.462103
21-0.06057-0.5210.301947
22-0.019801-0.17030.432607
23-0.10776-0.9270.178474
240.0760790.65450.257422
25-0.039827-0.34260.366434
260.0578610.49770.310073
27-0.049613-0.42680.335385
280.0498380.42870.334686
29-0.047793-0.41110.341081
300.047010.40440.343544
31-0.079129-0.68070.249095
320.0118220.10170.459635
33-0.063385-0.54530.293607
34-0.05591-0.4810.315983
35-0.023751-0.20430.419333
36-0.028168-0.24230.404603
370.0584040.50240.308434
38-0.051429-0.44240.329741
390.0823220.70820.240534
400.0611180.52580.300314
410.0530460.45630.324748
42-0.040017-0.34420.36582
43-0.069461-0.59750.27599
440.0314020.27010.393906
45-0.071533-0.61540.270105
460.0313940.27010.393934
47-0.061905-0.53250.297978
480.0418770.36020.359847

\begin{tabular}{lllllllll}
\hline
Partial Autocorrelation Function \tabularnewline
Time lag k & PACF(k) & T-STAT & P-value \tabularnewline
1 & 0.828672 & 7.1285 & 0 \tabularnewline
2 & -0.429634 & -3.6959 & 0.000209 \tabularnewline
3 & 0.187802 & 1.6155 & 0.055225 \tabularnewline
4 & 0.047158 & 0.4057 & 0.343078 \tabularnewline
5 & 0.067917 & 0.5842 & 0.280417 \tabularnewline
6 & -0.005419 & -0.0466 & 0.481474 \tabularnewline
7 & 0.075621 & 0.6505 & 0.258686 \tabularnewline
8 & 0.049257 & 0.4237 & 0.336497 \tabularnewline
9 & 0.236899 & 2.0379 & 0.022568 \tabularnewline
10 & 0.293005 & 2.5205 & 0.006936 \tabularnewline
11 & 0.384761 & 3.3098 & 0.000722 \tabularnewline
12 & -0.082424 & -0.709 & 0.240264 \tabularnewline
13 & -0.626985 & -5.3935 & 0 \tabularnewline
14 & 0.182127 & 1.5667 & 0.060724 \tabularnewline
15 & -0.076344 & -0.6567 & 0.256695 \tabularnewline
16 & -0.18994 & -1.6339 & 0.053261 \tabularnewline
17 & -0.08425 & -0.7247 & 0.235448 \tabularnewline
18 & -0.062473 & -0.5374 & 0.296296 \tabularnewline
19 & -0.027808 & -0.2392 & 0.405799 \tabularnewline
20 & -0.011097 & -0.0955 & 0.462103 \tabularnewline
21 & -0.06057 & -0.521 & 0.301947 \tabularnewline
22 & -0.019801 & -0.1703 & 0.432607 \tabularnewline
23 & -0.10776 & -0.927 & 0.178474 \tabularnewline
24 & 0.076079 & 0.6545 & 0.257422 \tabularnewline
25 & -0.039827 & -0.3426 & 0.366434 \tabularnewline
26 & 0.057861 & 0.4977 & 0.310073 \tabularnewline
27 & -0.049613 & -0.4268 & 0.335385 \tabularnewline
28 & 0.049838 & 0.4287 & 0.334686 \tabularnewline
29 & -0.047793 & -0.4111 & 0.341081 \tabularnewline
30 & 0.04701 & 0.4044 & 0.343544 \tabularnewline
31 & -0.079129 & -0.6807 & 0.249095 \tabularnewline
32 & 0.011822 & 0.1017 & 0.459635 \tabularnewline
33 & -0.063385 & -0.5453 & 0.293607 \tabularnewline
34 & -0.05591 & -0.481 & 0.315983 \tabularnewline
35 & -0.023751 & -0.2043 & 0.419333 \tabularnewline
36 & -0.028168 & -0.2423 & 0.404603 \tabularnewline
37 & 0.058404 & 0.5024 & 0.308434 \tabularnewline
38 & -0.051429 & -0.4424 & 0.329741 \tabularnewline
39 & 0.082322 & 0.7082 & 0.240534 \tabularnewline
40 & 0.061118 & 0.5258 & 0.300314 \tabularnewline
41 & 0.053046 & 0.4563 & 0.324748 \tabularnewline
42 & -0.040017 & -0.3442 & 0.36582 \tabularnewline
43 & -0.069461 & -0.5975 & 0.27599 \tabularnewline
44 & 0.031402 & 0.2701 & 0.393906 \tabularnewline
45 & -0.071533 & -0.6154 & 0.270105 \tabularnewline
46 & 0.031394 & 0.2701 & 0.393934 \tabularnewline
47 & -0.061905 & -0.5325 & 0.297978 \tabularnewline
48 & 0.041877 & 0.3602 & 0.359847 \tabularnewline
\hline
\end{tabular}
%Source: https://freestatistics.org/blog/index.php?pk=41408&T=2

[TABLE]
[ROW][C]Partial Autocorrelation Function[/C][/ROW]
[ROW][C]Time lag k[/C][C]PACF(k)[/C][C]T-STAT[/C][C]P-value[/C][/ROW]
[ROW][C]1[/C][C]0.828672[/C][C]7.1285[/C][C]0[/C][/ROW]
[ROW][C]2[/C][C]-0.429634[/C][C]-3.6959[/C][C]0.000209[/C][/ROW]
[ROW][C]3[/C][C]0.187802[/C][C]1.6155[/C][C]0.055225[/C][/ROW]
[ROW][C]4[/C][C]0.047158[/C][C]0.4057[/C][C]0.343078[/C][/ROW]
[ROW][C]5[/C][C]0.067917[/C][C]0.5842[/C][C]0.280417[/C][/ROW]
[ROW][C]6[/C][C]-0.005419[/C][C]-0.0466[/C][C]0.481474[/C][/ROW]
[ROW][C]7[/C][C]0.075621[/C][C]0.6505[/C][C]0.258686[/C][/ROW]
[ROW][C]8[/C][C]0.049257[/C][C]0.4237[/C][C]0.336497[/C][/ROW]
[ROW][C]9[/C][C]0.236899[/C][C]2.0379[/C][C]0.022568[/C][/ROW]
[ROW][C]10[/C][C]0.293005[/C][C]2.5205[/C][C]0.006936[/C][/ROW]
[ROW][C]11[/C][C]0.384761[/C][C]3.3098[/C][C]0.000722[/C][/ROW]
[ROW][C]12[/C][C]-0.082424[/C][C]-0.709[/C][C]0.240264[/C][/ROW]
[ROW][C]13[/C][C]-0.626985[/C][C]-5.3935[/C][C]0[/C][/ROW]
[ROW][C]14[/C][C]0.182127[/C][C]1.5667[/C][C]0.060724[/C][/ROW]
[ROW][C]15[/C][C]-0.076344[/C][C]-0.6567[/C][C]0.256695[/C][/ROW]
[ROW][C]16[/C][C]-0.18994[/C][C]-1.6339[/C][C]0.053261[/C][/ROW]
[ROW][C]17[/C][C]-0.08425[/C][C]-0.7247[/C][C]0.235448[/C][/ROW]
[ROW][C]18[/C][C]-0.062473[/C][C]-0.5374[/C][C]0.296296[/C][/ROW]
[ROW][C]19[/C][C]-0.027808[/C][C]-0.2392[/C][C]0.405799[/C][/ROW]
[ROW][C]20[/C][C]-0.011097[/C][C]-0.0955[/C][C]0.462103[/C][/ROW]
[ROW][C]21[/C][C]-0.06057[/C][C]-0.521[/C][C]0.301947[/C][/ROW]
[ROW][C]22[/C][C]-0.019801[/C][C]-0.1703[/C][C]0.432607[/C][/ROW]
[ROW][C]23[/C][C]-0.10776[/C][C]-0.927[/C][C]0.178474[/C][/ROW]
[ROW][C]24[/C][C]0.076079[/C][C]0.6545[/C][C]0.257422[/C][/ROW]
[ROW][C]25[/C][C]-0.039827[/C][C]-0.3426[/C][C]0.366434[/C][/ROW]
[ROW][C]26[/C][C]0.057861[/C][C]0.4977[/C][C]0.310073[/C][/ROW]
[ROW][C]27[/C][C]-0.049613[/C][C]-0.4268[/C][C]0.335385[/C][/ROW]
[ROW][C]28[/C][C]0.049838[/C][C]0.4287[/C][C]0.334686[/C][/ROW]
[ROW][C]29[/C][C]-0.047793[/C][C]-0.4111[/C][C]0.341081[/C][/ROW]
[ROW][C]30[/C][C]0.04701[/C][C]0.4044[/C][C]0.343544[/C][/ROW]
[ROW][C]31[/C][C]-0.079129[/C][C]-0.6807[/C][C]0.249095[/C][/ROW]
[ROW][C]32[/C][C]0.011822[/C][C]0.1017[/C][C]0.459635[/C][/ROW]
[ROW][C]33[/C][C]-0.063385[/C][C]-0.5453[/C][C]0.293607[/C][/ROW]
[ROW][C]34[/C][C]-0.05591[/C][C]-0.481[/C][C]0.315983[/C][/ROW]
[ROW][C]35[/C][C]-0.023751[/C][C]-0.2043[/C][C]0.419333[/C][/ROW]
[ROW][C]36[/C][C]-0.028168[/C][C]-0.2423[/C][C]0.404603[/C][/ROW]
[ROW][C]37[/C][C]0.058404[/C][C]0.5024[/C][C]0.308434[/C][/ROW]
[ROW][C]38[/C][C]-0.051429[/C][C]-0.4424[/C][C]0.329741[/C][/ROW]
[ROW][C]39[/C][C]0.082322[/C][C]0.7082[/C][C]0.240534[/C][/ROW]
[ROW][C]40[/C][C]0.061118[/C][C]0.5258[/C][C]0.300314[/C][/ROW]
[ROW][C]41[/C][C]0.053046[/C][C]0.4563[/C][C]0.324748[/C][/ROW]
[ROW][C]42[/C][C]-0.040017[/C][C]-0.3442[/C][C]0.36582[/C][/ROW]
[ROW][C]43[/C][C]-0.069461[/C][C]-0.5975[/C][C]0.27599[/C][/ROW]
[ROW][C]44[/C][C]0.031402[/C][C]0.2701[/C][C]0.393906[/C][/ROW]
[ROW][C]45[/C][C]-0.071533[/C][C]-0.6154[/C][C]0.270105[/C][/ROW]
[ROW][C]46[/C][C]0.031394[/C][C]0.2701[/C][C]0.393934[/C][/ROW]
[ROW][C]47[/C][C]-0.061905[/C][C]-0.5325[/C][C]0.297978[/C][/ROW]
[ROW][C]48[/C][C]0.041877[/C][C]0.3602[/C][C]0.359847[/C][/ROW]
[/TABLE]
Source: https://freestatistics.org/blog/index.php?pk=41408&T=2

Globally Unique Identifier (entire table): ba.freestatistics.org/blog/index.php?pk=41408&T=2

As an alternative you can also use a QR Code:  

The GUIDs for individual cells are displayed in the table below:

Partial Autocorrelation Function
Time lag kPACF(k)T-STATP-value
10.8286727.12850
2-0.429634-3.69590.000209
30.1878021.61550.055225
40.0471580.40570.343078
50.0679170.58420.280417
6-0.005419-0.04660.481474
70.0756210.65050.258686
80.0492570.42370.336497
90.2368992.03790.022568
100.2930052.52050.006936
110.3847613.30980.000722
12-0.082424-0.7090.240264
13-0.626985-5.39350
140.1821271.56670.060724
15-0.076344-0.65670.256695
16-0.18994-1.63390.053261
17-0.08425-0.72470.235448
18-0.062473-0.53740.296296
19-0.027808-0.23920.405799
20-0.011097-0.09550.462103
21-0.06057-0.5210.301947
22-0.019801-0.17030.432607
23-0.10776-0.9270.178474
240.0760790.65450.257422
25-0.039827-0.34260.366434
260.0578610.49770.310073
27-0.049613-0.42680.335385
280.0498380.42870.334686
29-0.047793-0.41110.341081
300.047010.40440.343544
31-0.079129-0.68070.249095
320.0118220.10170.459635
33-0.063385-0.54530.293607
34-0.05591-0.4810.315983
35-0.023751-0.20430.419333
36-0.028168-0.24230.404603
370.0584040.50240.308434
38-0.051429-0.44240.329741
390.0823220.70820.240534
400.0611180.52580.300314
410.0530460.45630.324748
42-0.040017-0.34420.36582
43-0.069461-0.59750.27599
440.0314020.27010.393906
45-0.071533-0.61540.270105
460.0313940.27010.393934
47-0.061905-0.53250.297978
480.0418770.36020.359847


Parameters (Session):
par1 = 48 ; par2 = 1 ; par3 = 0 ; par4 = 0 ; par5 = 12 ;
Parameters (R input):
par1 = 48 ; par2 = 1 ; par3 = 0 ; par4 = 0 ; par5 = 12 ;
R code (references can be found in the software module):
if (par1 == 'Default') {
par1 = 10*log10(length(x))
} else {
par1 <- as.numeric(par1)
}
par2 <- as.numeric(par2)
par3 <- as.numeric(par3)
par4 <- as.numeric(par4)
par5 <- as.numeric(par5)
if (par2 == 0) {
x <- log(x)
} else {
x <- (x ^ par2 - 1) / par2
}
if (par3 > 0) x <- diff(x,lag=1,difference=par3)
if (par4 > 0) x <- diff(x,lag=par5,difference=par4)
bitmap(file='pic1.png')
racf <- acf(x,par1,main='Autocorrelation',xlab='lags',ylab='ACF')
dev.off()
bitmap(file='pic2.png')
rpacf <- pacf(x,par1,main='Partial Autocorrelation',xlab='lags',ylab='PACF')
dev.off()
(myacf <- c(racf$acf))
(mypacf <- c(rpacf$acf))
lengthx <- length(x)
sqrtn <- sqrt(lengthx)
load(file='createtable')
a<-table.start()
a<-table.row.start(a)
a<-table.element(a,'Autocorrelation Function',4,TRUE)
a<-table.row.end(a)
a<-table.row.start(a)
a<-table.element(a,'Time lag k',header=TRUE)
a<-table.element(a,hyperlink('basics.htm','ACF(k)','click here for more information about the Autocorrelation Function'),header=TRUE)
a<-table.element(a,'T-STAT',header=TRUE)
a<-table.element(a,'P-value',header=TRUE)
a<-table.row.end(a)
for (i in 2:(par1+1)) {
a<-table.row.start(a)
a<-table.element(a,i-1,header=TRUE)
a<-table.element(a,round(myacf[i],6))
mytstat <- myacf[i]*sqrtn
a<-table.element(a,round(mytstat,4))
a<-table.element(a,round(1-pt(abs(mytstat),lengthx),6))
a<-table.row.end(a)
}
a<-table.end(a)
table.save(a,file='mytable.tab')
a<-table.start()
a<-table.row.start(a)
a<-table.element(a,'Partial Autocorrelation Function',4,TRUE)
a<-table.row.end(a)
a<-table.row.start(a)
a<-table.element(a,'Time lag k',header=TRUE)
a<-table.element(a,hyperlink('basics.htm','PACF(k)','click here for more information about the Partial Autocorrelation Function'),header=TRUE)
a<-table.element(a,'T-STAT',header=TRUE)
a<-table.element(a,'P-value',header=TRUE)
a<-table.row.end(a)
for (i in 1:par1) {
a<-table.row.start(a)
a<-table.element(a,i,header=TRUE)
a<-table.element(a,round(mypacf[i],6))
mytstat <- mypacf[i]*sqrtn
a<-table.element(a,round(mytstat,4))
a<-table.element(a,round(1-pt(abs(mytstat),lengthx),6))
a<-table.row.end(a)
}
a<-table.end(a)
table.save(a,file='mytable1.tab')