Free Statistics

of Irreproducible Research!

Author's title

Author*Unverified author*
R Software Modulerwasp_autocorrelation.wasp
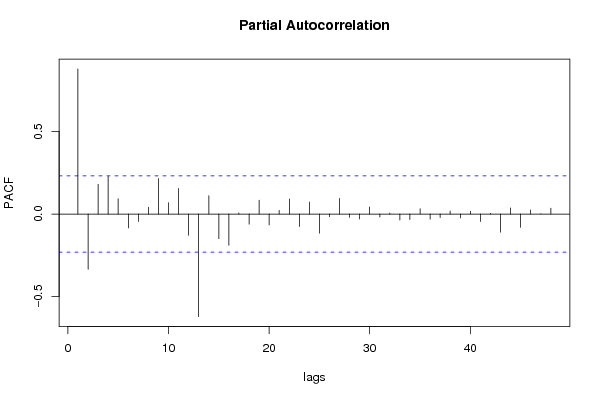
Title produced by software(Partial) Autocorrelation Function
Date of computationTue, 02 Jun 2009 11:33:47 -0600
Cite this page as followsStatistical Computations at FreeStatistics.org, Office for Research Development and Education, URL https://freestatistics.org/blog/index.php?v=date/2009/Jun/02/t1243964071d9nqpqi5uqfluyy.htm/, Retrieved Thu, 09 May 2024 20:56:18 +0000
Statistical Computations at FreeStatistics.org, Office for Research Development and Education, URL https://freestatistics.org/blog/index.php?pk=41336, Retrieved Thu, 09 May 2024 20:56:18 +0000
QR Codes:

Original text written by user:
IsPrivate?No (this computation is public)
User-defined keywords
Estimated Impact117
Family? (F = Feedback message, R = changed R code, M = changed R Module, P = changed Parameters, D = changed Data)
-     [Harrell-Davis Quantiles] [DECIELEN WERKLOZE...] [2009-06-02 16:58:24] [f4d91a94613ac4c8d4f7075ea31c5ee8]
- RMP     [(Partial) Autocorrelation Function] [AUTOCORRELATIE WE...] [2009-06-02 17:33:47] [cec0b6ecf0cab4e1552eba4b21b592a6] [Current]
Feedback Forum

Post a new message
Dataseries X:
509
501
507
569
580
578
565
547
555
562
561
555
544
537
543
594
611
613
611
594
595
591
589
584
573
567
569
621
629
628
612
595
597
593
590
580
574
573
573
620
626
620
588
566
557
561
549
532
526
511
499
555
565
542
527
510
514
517
508
493
490
469
478
528
534
518
506
502
516
528
533
536


Summary of computational transaction
Raw Inputview raw input (R code)
Raw Outputview raw output of R engine
Computing time2 seconds
R Server'Sir Ronald Aylmer Fisher' @ 193.190.124.24

\begin{tabular}{lllllllll}
\hline
Summary of computational transaction \tabularnewline
Raw Input & view raw input (R code)  \tabularnewline
Raw Output & view raw output of R engine  \tabularnewline
Computing time & 2 seconds \tabularnewline
R Server & 'Sir Ronald Aylmer Fisher' @ 193.190.124.24 \tabularnewline
\hline
\end{tabular}
%Source: https://freestatistics.org/blog/index.php?pk=41336&T=0

[TABLE]
[ROW][C]Summary of computational transaction[/C][/ROW]
[ROW][C]Raw Input[/C][C]view raw input (R code) [/C][/ROW]
[ROW][C]Raw Output[/C][C]view raw output of R engine [/C][/ROW]
[ROW][C]Computing time[/C][C]2 seconds[/C][/ROW]
[ROW][C]R Server[/C][C]'Sir Ronald Aylmer Fisher' @ 193.190.124.24[/C][/ROW]
[/TABLE]
Source: https://freestatistics.org/blog/index.php?pk=41336&T=0

Globally Unique Identifier (entire table): ba.freestatistics.org/blog/index.php?pk=41336&T=0

As an alternative you can also use a QR Code:  

The GUIDs for individual cells are displayed in the table below:

Summary of computational transaction
Raw Inputview raw input (R code)
Raw Outputview raw output of R engine
Computing time2 seconds
R Server'Sir Ronald Aylmer Fisher' @ 193.190.124.24


Autocorrelation Function
Time lag kACF(k)T-STATP-value
10.8800147.46720
20.6989485.93080
30.5625114.77315e-06
40.5156064.37512e-05
50.5253224.45751.5e-05
60.5168834.38591.9e-05
70.4620563.92071e-04
80.3912173.31960.000709
90.3750363.18230.001079
100.4130773.50510.000395
110.4838894.10595.3e-05
120.5025754.26453e-05
130.3566513.02630.001716
140.1735611.47270.072593
150.0312880.26550.395697
16-0.033481-0.28410.388577
17-0.047374-0.4020.344445
18-0.07101-0.60250.274355
19-0.119425-1.01340.157142
20-0.177185-1.50350.068547
21-0.186275-1.58060.059177
22-0.156813-1.33060.09376
23-0.105408-0.89440.187039
24-0.092983-0.7890.216354
25-0.202465-1.7180.04505
26-0.335865-2.84990.00285
27-0.425667-3.61190.000279
28-0.43683-3.70660.000205
29-0.409005-3.47050.000441
30-0.388657-3.29790.000758
31-0.388882-3.29980.000753
32-0.39824-3.37920.000588
33-0.366997-3.11410.001324
34-0.314329-2.66720.004721
35-0.248509-2.10870.019226
36-0.213771-1.81390.036929
37-0.270519-2.29540.012312
38-0.344229-2.92090.002329
39-0.379341-3.21880.000966
40-0.346557-2.94060.002201
41-0.289051-2.45270.008302
42-0.239977-2.03630.022701
43-0.222124-1.88480.031748
44-0.212782-1.80550.037587
45-0.175693-1.49080.07019
46-0.123272-1.0460.14953
47-0.0625-0.53030.298757
48-0.023254-0.19730.422068

\begin{tabular}{lllllllll}
\hline
Autocorrelation Function \tabularnewline
Time lag k & ACF(k) & T-STAT & P-value \tabularnewline
1 & 0.880014 & 7.4672 & 0 \tabularnewline
2 & 0.698948 & 5.9308 & 0 \tabularnewline
3 & 0.562511 & 4.7731 & 5e-06 \tabularnewline
4 & 0.515606 & 4.3751 & 2e-05 \tabularnewline
5 & 0.525322 & 4.4575 & 1.5e-05 \tabularnewline
6 & 0.516883 & 4.3859 & 1.9e-05 \tabularnewline
7 & 0.462056 & 3.9207 & 1e-04 \tabularnewline
8 & 0.391217 & 3.3196 & 0.000709 \tabularnewline
9 & 0.375036 & 3.1823 & 0.001079 \tabularnewline
10 & 0.413077 & 3.5051 & 0.000395 \tabularnewline
11 & 0.483889 & 4.1059 & 5.3e-05 \tabularnewline
12 & 0.502575 & 4.2645 & 3e-05 \tabularnewline
13 & 0.356651 & 3.0263 & 0.001716 \tabularnewline
14 & 0.173561 & 1.4727 & 0.072593 \tabularnewline
15 & 0.031288 & 0.2655 & 0.395697 \tabularnewline
16 & -0.033481 & -0.2841 & 0.388577 \tabularnewline
17 & -0.047374 & -0.402 & 0.344445 \tabularnewline
18 & -0.07101 & -0.6025 & 0.274355 \tabularnewline
19 & -0.119425 & -1.0134 & 0.157142 \tabularnewline
20 & -0.177185 & -1.5035 & 0.068547 \tabularnewline
21 & -0.186275 & -1.5806 & 0.059177 \tabularnewline
22 & -0.156813 & -1.3306 & 0.09376 \tabularnewline
23 & -0.105408 & -0.8944 & 0.187039 \tabularnewline
24 & -0.092983 & -0.789 & 0.216354 \tabularnewline
25 & -0.202465 & -1.718 & 0.04505 \tabularnewline
26 & -0.335865 & -2.8499 & 0.00285 \tabularnewline
27 & -0.425667 & -3.6119 & 0.000279 \tabularnewline
28 & -0.43683 & -3.7066 & 0.000205 \tabularnewline
29 & -0.409005 & -3.4705 & 0.000441 \tabularnewline
30 & -0.388657 & -3.2979 & 0.000758 \tabularnewline
31 & -0.388882 & -3.2998 & 0.000753 \tabularnewline
32 & -0.39824 & -3.3792 & 0.000588 \tabularnewline
33 & -0.366997 & -3.1141 & 0.001324 \tabularnewline
34 & -0.314329 & -2.6672 & 0.004721 \tabularnewline
35 & -0.248509 & -2.1087 & 0.019226 \tabularnewline
36 & -0.213771 & -1.8139 & 0.036929 \tabularnewline
37 & -0.270519 & -2.2954 & 0.012312 \tabularnewline
38 & -0.344229 & -2.9209 & 0.002329 \tabularnewline
39 & -0.379341 & -3.2188 & 0.000966 \tabularnewline
40 & -0.346557 & -2.9406 & 0.002201 \tabularnewline
41 & -0.289051 & -2.4527 & 0.008302 \tabularnewline
42 & -0.239977 & -2.0363 & 0.022701 \tabularnewline
43 & -0.222124 & -1.8848 & 0.031748 \tabularnewline
44 & -0.212782 & -1.8055 & 0.037587 \tabularnewline
45 & -0.175693 & -1.4908 & 0.07019 \tabularnewline
46 & -0.123272 & -1.046 & 0.14953 \tabularnewline
47 & -0.0625 & -0.5303 & 0.298757 \tabularnewline
48 & -0.023254 & -0.1973 & 0.422068 \tabularnewline
\hline
\end{tabular}
%Source: https://freestatistics.org/blog/index.php?pk=41336&T=1

[TABLE]
[ROW][C]Autocorrelation Function[/C][/ROW]
[ROW][C]Time lag k[/C][C]ACF(k)[/C][C]T-STAT[/C][C]P-value[/C][/ROW]
[ROW][C]1[/C][C]0.880014[/C][C]7.4672[/C][C]0[/C][/ROW]
[ROW][C]2[/C][C]0.698948[/C][C]5.9308[/C][C]0[/C][/ROW]
[ROW][C]3[/C][C]0.562511[/C][C]4.7731[/C][C]5e-06[/C][/ROW]
[ROW][C]4[/C][C]0.515606[/C][C]4.3751[/C][C]2e-05[/C][/ROW]
[ROW][C]5[/C][C]0.525322[/C][C]4.4575[/C][C]1.5e-05[/C][/ROW]
[ROW][C]6[/C][C]0.516883[/C][C]4.3859[/C][C]1.9e-05[/C][/ROW]
[ROW][C]7[/C][C]0.462056[/C][C]3.9207[/C][C]1e-04[/C][/ROW]
[ROW][C]8[/C][C]0.391217[/C][C]3.3196[/C][C]0.000709[/C][/ROW]
[ROW][C]9[/C][C]0.375036[/C][C]3.1823[/C][C]0.001079[/C][/ROW]
[ROW][C]10[/C][C]0.413077[/C][C]3.5051[/C][C]0.000395[/C][/ROW]
[ROW][C]11[/C][C]0.483889[/C][C]4.1059[/C][C]5.3e-05[/C][/ROW]
[ROW][C]12[/C][C]0.502575[/C][C]4.2645[/C][C]3e-05[/C][/ROW]
[ROW][C]13[/C][C]0.356651[/C][C]3.0263[/C][C]0.001716[/C][/ROW]
[ROW][C]14[/C][C]0.173561[/C][C]1.4727[/C][C]0.072593[/C][/ROW]
[ROW][C]15[/C][C]0.031288[/C][C]0.2655[/C][C]0.395697[/C][/ROW]
[ROW][C]16[/C][C]-0.033481[/C][C]-0.2841[/C][C]0.388577[/C][/ROW]
[ROW][C]17[/C][C]-0.047374[/C][C]-0.402[/C][C]0.344445[/C][/ROW]
[ROW][C]18[/C][C]-0.07101[/C][C]-0.6025[/C][C]0.274355[/C][/ROW]
[ROW][C]19[/C][C]-0.119425[/C][C]-1.0134[/C][C]0.157142[/C][/ROW]
[ROW][C]20[/C][C]-0.177185[/C][C]-1.5035[/C][C]0.068547[/C][/ROW]
[ROW][C]21[/C][C]-0.186275[/C][C]-1.5806[/C][C]0.059177[/C][/ROW]
[ROW][C]22[/C][C]-0.156813[/C][C]-1.3306[/C][C]0.09376[/C][/ROW]
[ROW][C]23[/C][C]-0.105408[/C][C]-0.8944[/C][C]0.187039[/C][/ROW]
[ROW][C]24[/C][C]-0.092983[/C][C]-0.789[/C][C]0.216354[/C][/ROW]
[ROW][C]25[/C][C]-0.202465[/C][C]-1.718[/C][C]0.04505[/C][/ROW]
[ROW][C]26[/C][C]-0.335865[/C][C]-2.8499[/C][C]0.00285[/C][/ROW]
[ROW][C]27[/C][C]-0.425667[/C][C]-3.6119[/C][C]0.000279[/C][/ROW]
[ROW][C]28[/C][C]-0.43683[/C][C]-3.7066[/C][C]0.000205[/C][/ROW]
[ROW][C]29[/C][C]-0.409005[/C][C]-3.4705[/C][C]0.000441[/C][/ROW]
[ROW][C]30[/C][C]-0.388657[/C][C]-3.2979[/C][C]0.000758[/C][/ROW]
[ROW][C]31[/C][C]-0.388882[/C][C]-3.2998[/C][C]0.000753[/C][/ROW]
[ROW][C]32[/C][C]-0.39824[/C][C]-3.3792[/C][C]0.000588[/C][/ROW]
[ROW][C]33[/C][C]-0.366997[/C][C]-3.1141[/C][C]0.001324[/C][/ROW]
[ROW][C]34[/C][C]-0.314329[/C][C]-2.6672[/C][C]0.004721[/C][/ROW]
[ROW][C]35[/C][C]-0.248509[/C][C]-2.1087[/C][C]0.019226[/C][/ROW]
[ROW][C]36[/C][C]-0.213771[/C][C]-1.8139[/C][C]0.036929[/C][/ROW]
[ROW][C]37[/C][C]-0.270519[/C][C]-2.2954[/C][C]0.012312[/C][/ROW]
[ROW][C]38[/C][C]-0.344229[/C][C]-2.9209[/C][C]0.002329[/C][/ROW]
[ROW][C]39[/C][C]-0.379341[/C][C]-3.2188[/C][C]0.000966[/C][/ROW]
[ROW][C]40[/C][C]-0.346557[/C][C]-2.9406[/C][C]0.002201[/C][/ROW]
[ROW][C]41[/C][C]-0.289051[/C][C]-2.4527[/C][C]0.008302[/C][/ROW]
[ROW][C]42[/C][C]-0.239977[/C][C]-2.0363[/C][C]0.022701[/C][/ROW]
[ROW][C]43[/C][C]-0.222124[/C][C]-1.8848[/C][C]0.031748[/C][/ROW]
[ROW][C]44[/C][C]-0.212782[/C][C]-1.8055[/C][C]0.037587[/C][/ROW]
[ROW][C]45[/C][C]-0.175693[/C][C]-1.4908[/C][C]0.07019[/C][/ROW]
[ROW][C]46[/C][C]-0.123272[/C][C]-1.046[/C][C]0.14953[/C][/ROW]
[ROW][C]47[/C][C]-0.0625[/C][C]-0.5303[/C][C]0.298757[/C][/ROW]
[ROW][C]48[/C][C]-0.023254[/C][C]-0.1973[/C][C]0.422068[/C][/ROW]
[/TABLE]
Source: https://freestatistics.org/blog/index.php?pk=41336&T=1

Globally Unique Identifier (entire table): ba.freestatistics.org/blog/index.php?pk=41336&T=1

As an alternative you can also use a QR Code:  

The GUIDs for individual cells are displayed in the table below:

Autocorrelation Function
Time lag kACF(k)T-STATP-value
10.8800147.46720
20.6989485.93080
30.5625114.77315e-06
40.5156064.37512e-05
50.5253224.45751.5e-05
60.5168834.38591.9e-05
70.4620563.92071e-04
80.3912173.31960.000709
90.3750363.18230.001079
100.4130773.50510.000395
110.4838894.10595.3e-05
120.5025754.26453e-05
130.3566513.02630.001716
140.1735611.47270.072593
150.0312880.26550.395697
16-0.033481-0.28410.388577
17-0.047374-0.4020.344445
18-0.07101-0.60250.274355
19-0.119425-1.01340.157142
20-0.177185-1.50350.068547
21-0.186275-1.58060.059177
22-0.156813-1.33060.09376
23-0.105408-0.89440.187039
24-0.092983-0.7890.216354
25-0.202465-1.7180.04505
26-0.335865-2.84990.00285
27-0.425667-3.61190.000279
28-0.43683-3.70660.000205
29-0.409005-3.47050.000441
30-0.388657-3.29790.000758
31-0.388882-3.29980.000753
32-0.39824-3.37920.000588
33-0.366997-3.11410.001324
34-0.314329-2.66720.004721
35-0.248509-2.10870.019226
36-0.213771-1.81390.036929
37-0.270519-2.29540.012312
38-0.344229-2.92090.002329
39-0.379341-3.21880.000966
40-0.346557-2.94060.002201
41-0.289051-2.45270.008302
42-0.239977-2.03630.022701
43-0.222124-1.88480.031748
44-0.212782-1.80550.037587
45-0.175693-1.49080.07019
46-0.123272-1.0460.14953
47-0.0625-0.53030.298757
48-0.023254-0.19730.422068


Partial Autocorrelation Function
Time lag kPACF(k)T-STATP-value
10.8800147.46720
2-0.334599-2.83920.002937
30.1800711.5280.065453
40.2284781.93870.028229
50.0933910.79240.215351
6-0.084048-0.71320.239022
7-0.045583-0.38680.350029
80.0410860.34860.364194
90.2149051.82350.036187
100.0684960.58120.281457
110.1555771.32010.09549
12-0.128609-1.09130.139393
13-0.622285-5.28031e-06
140.1113070.94450.174045
15-0.149112-1.26530.104929
16-0.189739-1.610.055888
170.006090.05170.479467
18-0.061294-0.52010.302295
190.0843490.71570.238237
20-0.065803-0.55840.289166
210.0225790.19160.4243
220.0914590.77610.220129
23-0.076263-0.64710.259809
240.0723490.61390.270607
25-0.116048-0.98470.164034
26-0.017014-0.14440.442808
270.0940060.79770.213842
28-0.019719-0.16730.433793
29-0.030446-0.25830.398441
300.0423490.35930.360195
31-0.018062-0.15330.439311
320.006310.05350.478723
33-0.035873-0.30440.380853
34-0.032916-0.27930.390407
350.0320420.27190.393245
36-0.030799-0.26130.397289
37-0.020928-0.17760.429775
380.0178280.15130.44009
39-0.023547-0.19980.4211
400.0166590.14140.443993
41-0.045072-0.38240.351629
420.004250.03610.485667
43-0.109838-0.9320.177223
440.0373330.31680.376163
45-0.080715-0.68490.247808
460.0251610.21350.415771
470.0006870.00580.497684
480.0358980.30460.380772

\begin{tabular}{lllllllll}
\hline
Partial Autocorrelation Function \tabularnewline
Time lag k & PACF(k) & T-STAT & P-value \tabularnewline
1 & 0.880014 & 7.4672 & 0 \tabularnewline
2 & -0.334599 & -2.8392 & 0.002937 \tabularnewline
3 & 0.180071 & 1.528 & 0.065453 \tabularnewline
4 & 0.228478 & 1.9387 & 0.028229 \tabularnewline
5 & 0.093391 & 0.7924 & 0.215351 \tabularnewline
6 & -0.084048 & -0.7132 & 0.239022 \tabularnewline
7 & -0.045583 & -0.3868 & 0.350029 \tabularnewline
8 & 0.041086 & 0.3486 & 0.364194 \tabularnewline
9 & 0.214905 & 1.8235 & 0.036187 \tabularnewline
10 & 0.068496 & 0.5812 & 0.281457 \tabularnewline
11 & 0.155577 & 1.3201 & 0.09549 \tabularnewline
12 & -0.128609 & -1.0913 & 0.139393 \tabularnewline
13 & -0.622285 & -5.2803 & 1e-06 \tabularnewline
14 & 0.111307 & 0.9445 & 0.174045 \tabularnewline
15 & -0.149112 & -1.2653 & 0.104929 \tabularnewline
16 & -0.189739 & -1.61 & 0.055888 \tabularnewline
17 & 0.00609 & 0.0517 & 0.479467 \tabularnewline
18 & -0.061294 & -0.5201 & 0.302295 \tabularnewline
19 & 0.084349 & 0.7157 & 0.238237 \tabularnewline
20 & -0.065803 & -0.5584 & 0.289166 \tabularnewline
21 & 0.022579 & 0.1916 & 0.4243 \tabularnewline
22 & 0.091459 & 0.7761 & 0.220129 \tabularnewline
23 & -0.076263 & -0.6471 & 0.259809 \tabularnewline
24 & 0.072349 & 0.6139 & 0.270607 \tabularnewline
25 & -0.116048 & -0.9847 & 0.164034 \tabularnewline
26 & -0.017014 & -0.1444 & 0.442808 \tabularnewline
27 & 0.094006 & 0.7977 & 0.213842 \tabularnewline
28 & -0.019719 & -0.1673 & 0.433793 \tabularnewline
29 & -0.030446 & -0.2583 & 0.398441 \tabularnewline
30 & 0.042349 & 0.3593 & 0.360195 \tabularnewline
31 & -0.018062 & -0.1533 & 0.439311 \tabularnewline
32 & 0.00631 & 0.0535 & 0.478723 \tabularnewline
33 & -0.035873 & -0.3044 & 0.380853 \tabularnewline
34 & -0.032916 & -0.2793 & 0.390407 \tabularnewline
35 & 0.032042 & 0.2719 & 0.393245 \tabularnewline
36 & -0.030799 & -0.2613 & 0.397289 \tabularnewline
37 & -0.020928 & -0.1776 & 0.429775 \tabularnewline
38 & 0.017828 & 0.1513 & 0.44009 \tabularnewline
39 & -0.023547 & -0.1998 & 0.4211 \tabularnewline
40 & 0.016659 & 0.1414 & 0.443993 \tabularnewline
41 & -0.045072 & -0.3824 & 0.351629 \tabularnewline
42 & 0.00425 & 0.0361 & 0.485667 \tabularnewline
43 & -0.109838 & -0.932 & 0.177223 \tabularnewline
44 & 0.037333 & 0.3168 & 0.376163 \tabularnewline
45 & -0.080715 & -0.6849 & 0.247808 \tabularnewline
46 & 0.025161 & 0.2135 & 0.415771 \tabularnewline
47 & 0.000687 & 0.0058 & 0.497684 \tabularnewline
48 & 0.035898 & 0.3046 & 0.380772 \tabularnewline
\hline
\end{tabular}
%Source: https://freestatistics.org/blog/index.php?pk=41336&T=2

[TABLE]
[ROW][C]Partial Autocorrelation Function[/C][/ROW]
[ROW][C]Time lag k[/C][C]PACF(k)[/C][C]T-STAT[/C][C]P-value[/C][/ROW]
[ROW][C]1[/C][C]0.880014[/C][C]7.4672[/C][C]0[/C][/ROW]
[ROW][C]2[/C][C]-0.334599[/C][C]-2.8392[/C][C]0.002937[/C][/ROW]
[ROW][C]3[/C][C]0.180071[/C][C]1.528[/C][C]0.065453[/C][/ROW]
[ROW][C]4[/C][C]0.228478[/C][C]1.9387[/C][C]0.028229[/C][/ROW]
[ROW][C]5[/C][C]0.093391[/C][C]0.7924[/C][C]0.215351[/C][/ROW]
[ROW][C]6[/C][C]-0.084048[/C][C]-0.7132[/C][C]0.239022[/C][/ROW]
[ROW][C]7[/C][C]-0.045583[/C][C]-0.3868[/C][C]0.350029[/C][/ROW]
[ROW][C]8[/C][C]0.041086[/C][C]0.3486[/C][C]0.364194[/C][/ROW]
[ROW][C]9[/C][C]0.214905[/C][C]1.8235[/C][C]0.036187[/C][/ROW]
[ROW][C]10[/C][C]0.068496[/C][C]0.5812[/C][C]0.281457[/C][/ROW]
[ROW][C]11[/C][C]0.155577[/C][C]1.3201[/C][C]0.09549[/C][/ROW]
[ROW][C]12[/C][C]-0.128609[/C][C]-1.0913[/C][C]0.139393[/C][/ROW]
[ROW][C]13[/C][C]-0.622285[/C][C]-5.2803[/C][C]1e-06[/C][/ROW]
[ROW][C]14[/C][C]0.111307[/C][C]0.9445[/C][C]0.174045[/C][/ROW]
[ROW][C]15[/C][C]-0.149112[/C][C]-1.2653[/C][C]0.104929[/C][/ROW]
[ROW][C]16[/C][C]-0.189739[/C][C]-1.61[/C][C]0.055888[/C][/ROW]
[ROW][C]17[/C][C]0.00609[/C][C]0.0517[/C][C]0.479467[/C][/ROW]
[ROW][C]18[/C][C]-0.061294[/C][C]-0.5201[/C][C]0.302295[/C][/ROW]
[ROW][C]19[/C][C]0.084349[/C][C]0.7157[/C][C]0.238237[/C][/ROW]
[ROW][C]20[/C][C]-0.065803[/C][C]-0.5584[/C][C]0.289166[/C][/ROW]
[ROW][C]21[/C][C]0.022579[/C][C]0.1916[/C][C]0.4243[/C][/ROW]
[ROW][C]22[/C][C]0.091459[/C][C]0.7761[/C][C]0.220129[/C][/ROW]
[ROW][C]23[/C][C]-0.076263[/C][C]-0.6471[/C][C]0.259809[/C][/ROW]
[ROW][C]24[/C][C]0.072349[/C][C]0.6139[/C][C]0.270607[/C][/ROW]
[ROW][C]25[/C][C]-0.116048[/C][C]-0.9847[/C][C]0.164034[/C][/ROW]
[ROW][C]26[/C][C]-0.017014[/C][C]-0.1444[/C][C]0.442808[/C][/ROW]
[ROW][C]27[/C][C]0.094006[/C][C]0.7977[/C][C]0.213842[/C][/ROW]
[ROW][C]28[/C][C]-0.019719[/C][C]-0.1673[/C][C]0.433793[/C][/ROW]
[ROW][C]29[/C][C]-0.030446[/C][C]-0.2583[/C][C]0.398441[/C][/ROW]
[ROW][C]30[/C][C]0.042349[/C][C]0.3593[/C][C]0.360195[/C][/ROW]
[ROW][C]31[/C][C]-0.018062[/C][C]-0.1533[/C][C]0.439311[/C][/ROW]
[ROW][C]32[/C][C]0.00631[/C][C]0.0535[/C][C]0.478723[/C][/ROW]
[ROW][C]33[/C][C]-0.035873[/C][C]-0.3044[/C][C]0.380853[/C][/ROW]
[ROW][C]34[/C][C]-0.032916[/C][C]-0.2793[/C][C]0.390407[/C][/ROW]
[ROW][C]35[/C][C]0.032042[/C][C]0.2719[/C][C]0.393245[/C][/ROW]
[ROW][C]36[/C][C]-0.030799[/C][C]-0.2613[/C][C]0.397289[/C][/ROW]
[ROW][C]37[/C][C]-0.020928[/C][C]-0.1776[/C][C]0.429775[/C][/ROW]
[ROW][C]38[/C][C]0.017828[/C][C]0.1513[/C][C]0.44009[/C][/ROW]
[ROW][C]39[/C][C]-0.023547[/C][C]-0.1998[/C][C]0.4211[/C][/ROW]
[ROW][C]40[/C][C]0.016659[/C][C]0.1414[/C][C]0.443993[/C][/ROW]
[ROW][C]41[/C][C]-0.045072[/C][C]-0.3824[/C][C]0.351629[/C][/ROW]
[ROW][C]42[/C][C]0.00425[/C][C]0.0361[/C][C]0.485667[/C][/ROW]
[ROW][C]43[/C][C]-0.109838[/C][C]-0.932[/C][C]0.177223[/C][/ROW]
[ROW][C]44[/C][C]0.037333[/C][C]0.3168[/C][C]0.376163[/C][/ROW]
[ROW][C]45[/C][C]-0.080715[/C][C]-0.6849[/C][C]0.247808[/C][/ROW]
[ROW][C]46[/C][C]0.025161[/C][C]0.2135[/C][C]0.415771[/C][/ROW]
[ROW][C]47[/C][C]0.000687[/C][C]0.0058[/C][C]0.497684[/C][/ROW]
[ROW][C]48[/C][C]0.035898[/C][C]0.3046[/C][C]0.380772[/C][/ROW]
[/TABLE]
Source: https://freestatistics.org/blog/index.php?pk=41336&T=2

Globally Unique Identifier (entire table): ba.freestatistics.org/blog/index.php?pk=41336&T=2

As an alternative you can also use a QR Code:  

The GUIDs for individual cells are displayed in the table below:

Partial Autocorrelation Function
Time lag kPACF(k)T-STATP-value
10.8800147.46720
2-0.334599-2.83920.002937
30.1800711.5280.065453
40.2284781.93870.028229
50.0933910.79240.215351
6-0.084048-0.71320.239022
7-0.045583-0.38680.350029
80.0410860.34860.364194
90.2149051.82350.036187
100.0684960.58120.281457
110.1555771.32010.09549
12-0.128609-1.09130.139393
13-0.622285-5.28031e-06
140.1113070.94450.174045
15-0.149112-1.26530.104929
16-0.189739-1.610.055888
170.006090.05170.479467
18-0.061294-0.52010.302295
190.0843490.71570.238237
20-0.065803-0.55840.289166
210.0225790.19160.4243
220.0914590.77610.220129
23-0.076263-0.64710.259809
240.0723490.61390.270607
25-0.116048-0.98470.164034
26-0.017014-0.14440.442808
270.0940060.79770.213842
28-0.019719-0.16730.433793
29-0.030446-0.25830.398441
300.0423490.35930.360195
31-0.018062-0.15330.439311
320.006310.05350.478723
33-0.035873-0.30440.380853
34-0.032916-0.27930.390407
350.0320420.27190.393245
36-0.030799-0.26130.397289
37-0.020928-0.17760.429775
380.0178280.15130.44009
39-0.023547-0.19980.4211
400.0166590.14140.443993
41-0.045072-0.38240.351629
420.004250.03610.485667
43-0.109838-0.9320.177223
440.0373330.31680.376163
45-0.080715-0.68490.247808
460.0251610.21350.415771
470.0006870.00580.497684
480.0358980.30460.380772


Parameters (Session):
par1 = 48 ; par2 = 1 ; par3 = 0 ; par4 = 0 ; par5 = 12 ;
Parameters (R input):
par1 = 48 ; par2 = 1 ; par3 = 0 ; par4 = 0 ; par5 = 12 ;
R code (references can be found in the software module):
if (par1 == 'Default') {
par1 = 10*log10(length(x))
} else {
par1 <- as.numeric(par1)
}
par2 <- as.numeric(par2)
par3 <- as.numeric(par3)
par4 <- as.numeric(par4)
par5 <- as.numeric(par5)
if (par2 == 0) {
x <- log(x)
} else {
x <- (x ^ par2 - 1) / par2
}
if (par3 > 0) x <- diff(x,lag=1,difference=par3)
if (par4 > 0) x <- diff(x,lag=par5,difference=par4)
bitmap(file='pic1.png')
racf <- acf(x,par1,main='Autocorrelation',xlab='lags',ylab='ACF')
dev.off()
bitmap(file='pic2.png')
rpacf <- pacf(x,par1,main='Partial Autocorrelation',xlab='lags',ylab='PACF')
dev.off()
(myacf <- c(racf$acf))
(mypacf <- c(rpacf$acf))
lengthx <- length(x)
sqrtn <- sqrt(lengthx)
load(file='createtable')
a<-table.start()
a<-table.row.start(a)
a<-table.element(a,'Autocorrelation Function',4,TRUE)
a<-table.row.end(a)
a<-table.row.start(a)
a<-table.element(a,'Time lag k',header=TRUE)
a<-table.element(a,hyperlink('basics.htm','ACF(k)','click here for more information about the Autocorrelation Function'),header=TRUE)
a<-table.element(a,'T-STAT',header=TRUE)
a<-table.element(a,'P-value',header=TRUE)
a<-table.row.end(a)
for (i in 2:(par1+1)) {
a<-table.row.start(a)
a<-table.element(a,i-1,header=TRUE)
a<-table.element(a,round(myacf[i],6))
mytstat <- myacf[i]*sqrtn
a<-table.element(a,round(mytstat,4))
a<-table.element(a,round(1-pt(abs(mytstat),lengthx),6))
a<-table.row.end(a)
}
a<-table.end(a)
table.save(a,file='mytable.tab')
a<-table.start()
a<-table.row.start(a)
a<-table.element(a,'Partial Autocorrelation Function',4,TRUE)
a<-table.row.end(a)
a<-table.row.start(a)
a<-table.element(a,'Time lag k',header=TRUE)
a<-table.element(a,hyperlink('basics.htm','PACF(k)','click here for more information about the Partial Autocorrelation Function'),header=TRUE)
a<-table.element(a,'T-STAT',header=TRUE)
a<-table.element(a,'P-value',header=TRUE)
a<-table.row.end(a)
for (i in 1:par1) {
a<-table.row.start(a)
a<-table.element(a,i,header=TRUE)
a<-table.element(a,round(mypacf[i],6))
mytstat <- mypacf[i]*sqrtn
a<-table.element(a,round(mytstat,4))
a<-table.element(a,round(1-pt(abs(mytstat),lengthx),6))
a<-table.row.end(a)
}
a<-table.end(a)
table.save(a,file='mytable1.tab')