Free Statistics

of Irreproducible Research!

Author's title

JUISTE REEKS Autocorrelatie trend eruit - Nieuwe geregistreerde domeinnamen...

Author*Unverified author*
R Software Modulerwasp_autocorrelation.wasp
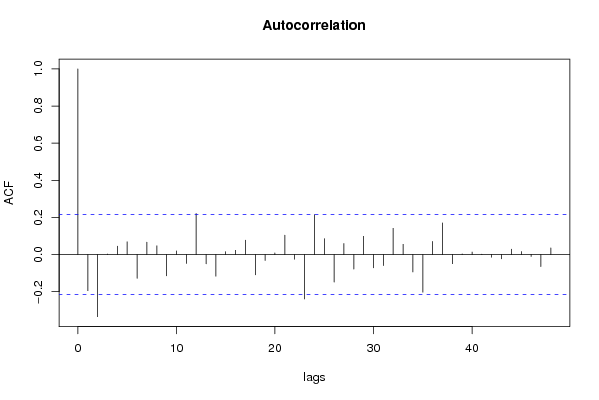
Title produced by software(Partial) Autocorrelation Function
Date of computationTue, 02 Jun 2009 08:57:07 -0600
Cite this page as followsStatistical Computations at FreeStatistics.org, Office for Research Development and Education, URL https://freestatistics.org/blog/index.php?v=date/2009/Jun/02/t1243954663odi5ob2m432avhk.htm/, Retrieved Fri, 10 May 2024 13:07:53 +0000
Statistical Computations at FreeStatistics.org, Office for Research Development and Education, URL https://freestatistics.org/blog/index.php?pk=41256, Retrieved Fri, 10 May 2024 13:07:53 +0000
QR Codes:

Original text written by user:
IsPrivate?No (this computation is public)
User-defined keywords
Estimated Impact95
Family? (F = Feedback message, R = changed R code, M = changed R Module, P = changed Parameters, D = changed Data)
-       [(Partial) Autocorrelation Function] [JUISTE REEKS Auto...] [2009-06-02 14:57:07] [d41d8cd98f00b204e9800998ecf8427e] [Current]
Feedback Forum

Post a new message
Dataseries X:
8166
7102
6047
5854
5764
5209
5616
5597
6251
7024
7237
9230
9016
8201
7630
7107
6820
6082
6019
6576
8086
8323
7842
9077
10737
10176
10416
9807
9565
10439
9115
9535
10790
11340
11196
12132
12013
12692
13330
11926
11356
11221
9999
11772
12543
14176
2924
2322
15557
13381
13145
12448
12178
11836
9815
12382
12662
12767
13136
13533
17808
15892
16830
14444
15550
15092
16364
14314
15874
17846
18504
15130
19845
18137
18898
19573
17368
18938
16713
16379
19139
21461
19796
16668


Summary of computational transaction
Raw Inputview raw input (R code)
Raw Outputview raw output of R engine
Computing time1 seconds
R Server'George Udny Yule' @ 72.249.76.132

\begin{tabular}{lllllllll}
\hline
Summary of computational transaction \tabularnewline
Raw Input & view raw input (R code)  \tabularnewline
Raw Output & view raw output of R engine  \tabularnewline
Computing time & 1 seconds \tabularnewline
R Server & 'George Udny Yule' @ 72.249.76.132 \tabularnewline
\hline
\end{tabular}
%Source: https://freestatistics.org/blog/index.php?pk=41256&T=0

[TABLE]
[ROW][C]Summary of computational transaction[/C][/ROW]
[ROW][C]Raw Input[/C][C]view raw input (R code) [/C][/ROW]
[ROW][C]Raw Output[/C][C]view raw output of R engine [/C][/ROW]
[ROW][C]Computing time[/C][C]1 seconds[/C][/ROW]
[ROW][C]R Server[/C][C]'George Udny Yule' @ 72.249.76.132[/C][/ROW]
[/TABLE]
Source: https://freestatistics.org/blog/index.php?pk=41256&T=0

Globally Unique Identifier (entire table): ba.freestatistics.org/blog/index.php?pk=41256&T=0

As an alternative you can also use a QR Code:  

The GUIDs for individual cells are displayed in the table below:

Summary of computational transaction
Raw Inputview raw input (R code)
Raw Outputview raw output of R engine
Computing time1 seconds
R Server'George Udny Yule' @ 72.249.76.132


Autocorrelation Function
Time lag kACF(k)T-STATP-value
1-0.194172-1.7690.040284
2-0.334218-3.04490.001559
30.0028990.02640.489497
40.0456470.41590.339292
50.0687210.62610.26649
6-0.127763-1.1640.123884
70.0666410.60710.272712
80.0475570.43330.332973
9-0.113966-1.03830.151077
100.0199120.18140.428244
11-0.047258-0.43050.333958
120.2214072.01710.023458
13-0.049355-0.44960.32707
14-0.116221-1.05880.146377
150.0156140.14230.443613
160.022950.20910.417449
170.0779530.71020.23979
18-0.109095-0.99390.161578
19-0.031587-0.28780.387118
200.0088780.08090.467866
210.1043290.95050.172312
22-0.024934-0.22720.41043
23-0.239046-2.17780.016129
240.2147361.95630.026894
250.085610.77990.218822
26-0.14769-1.34550.091061
270.0595430.54250.294478
28-0.078189-0.71230.239127
290.0986370.89860.185727
30-0.071103-0.64780.259457
31-0.059182-0.53920.295604
320.1415241.28930.100429
330.0557380.50780.306472
34-0.093404-0.85090.198623
35-0.20259-1.84570.034252
360.0708260.64530.260272
370.1707121.55530.061845
38-0.049291-0.44910.327277
390.0038650.03520.485998
400.0140270.12780.44931
410.0020650.01880.492516
42-0.014262-0.12990.448468
43-0.022908-0.20870.417597
440.0291470.26550.395625
450.0167040.15220.439706
46-0.009973-0.09090.46391
47-0.064513-0.58770.279152
480.0358230.32640.372484

\begin{tabular}{lllllllll}
\hline
Autocorrelation Function \tabularnewline
Time lag k & ACF(k) & T-STAT & P-value \tabularnewline
1 & -0.194172 & -1.769 & 0.040284 \tabularnewline
2 & -0.334218 & -3.0449 & 0.001559 \tabularnewline
3 & 0.002899 & 0.0264 & 0.489497 \tabularnewline
4 & 0.045647 & 0.4159 & 0.339292 \tabularnewline
5 & 0.068721 & 0.6261 & 0.26649 \tabularnewline
6 & -0.127763 & -1.164 & 0.123884 \tabularnewline
7 & 0.066641 & 0.6071 & 0.272712 \tabularnewline
8 & 0.047557 & 0.4333 & 0.332973 \tabularnewline
9 & -0.113966 & -1.0383 & 0.151077 \tabularnewline
10 & 0.019912 & 0.1814 & 0.428244 \tabularnewline
11 & -0.047258 & -0.4305 & 0.333958 \tabularnewline
12 & 0.221407 & 2.0171 & 0.023458 \tabularnewline
13 & -0.049355 & -0.4496 & 0.32707 \tabularnewline
14 & -0.116221 & -1.0588 & 0.146377 \tabularnewline
15 & 0.015614 & 0.1423 & 0.443613 \tabularnewline
16 & 0.02295 & 0.2091 & 0.417449 \tabularnewline
17 & 0.077953 & 0.7102 & 0.23979 \tabularnewline
18 & -0.109095 & -0.9939 & 0.161578 \tabularnewline
19 & -0.031587 & -0.2878 & 0.387118 \tabularnewline
20 & 0.008878 & 0.0809 & 0.467866 \tabularnewline
21 & 0.104329 & 0.9505 & 0.172312 \tabularnewline
22 & -0.024934 & -0.2272 & 0.41043 \tabularnewline
23 & -0.239046 & -2.1778 & 0.016129 \tabularnewline
24 & 0.214736 & 1.9563 & 0.026894 \tabularnewline
25 & 0.08561 & 0.7799 & 0.218822 \tabularnewline
26 & -0.14769 & -1.3455 & 0.091061 \tabularnewline
27 & 0.059543 & 0.5425 & 0.294478 \tabularnewline
28 & -0.078189 & -0.7123 & 0.239127 \tabularnewline
29 & 0.098637 & 0.8986 & 0.185727 \tabularnewline
30 & -0.071103 & -0.6478 & 0.259457 \tabularnewline
31 & -0.059182 & -0.5392 & 0.295604 \tabularnewline
32 & 0.141524 & 1.2893 & 0.100429 \tabularnewline
33 & 0.055738 & 0.5078 & 0.306472 \tabularnewline
34 & -0.093404 & -0.8509 & 0.198623 \tabularnewline
35 & -0.20259 & -1.8457 & 0.034252 \tabularnewline
36 & 0.070826 & 0.6453 & 0.260272 \tabularnewline
37 & 0.170712 & 1.5553 & 0.061845 \tabularnewline
38 & -0.049291 & -0.4491 & 0.327277 \tabularnewline
39 & 0.003865 & 0.0352 & 0.485998 \tabularnewline
40 & 0.014027 & 0.1278 & 0.44931 \tabularnewline
41 & 0.002065 & 0.0188 & 0.492516 \tabularnewline
42 & -0.014262 & -0.1299 & 0.448468 \tabularnewline
43 & -0.022908 & -0.2087 & 0.417597 \tabularnewline
44 & 0.029147 & 0.2655 & 0.395625 \tabularnewline
45 & 0.016704 & 0.1522 & 0.439706 \tabularnewline
46 & -0.009973 & -0.0909 & 0.46391 \tabularnewline
47 & -0.064513 & -0.5877 & 0.279152 \tabularnewline
48 & 0.035823 & 0.3264 & 0.372484 \tabularnewline
\hline
\end{tabular}
%Source: https://freestatistics.org/blog/index.php?pk=41256&T=1

[TABLE]
[ROW][C]Autocorrelation Function[/C][/ROW]
[ROW][C]Time lag k[/C][C]ACF(k)[/C][C]T-STAT[/C][C]P-value[/C][/ROW]
[ROW][C]1[/C][C]-0.194172[/C][C]-1.769[/C][C]0.040284[/C][/ROW]
[ROW][C]2[/C][C]-0.334218[/C][C]-3.0449[/C][C]0.001559[/C][/ROW]
[ROW][C]3[/C][C]0.002899[/C][C]0.0264[/C][C]0.489497[/C][/ROW]
[ROW][C]4[/C][C]0.045647[/C][C]0.4159[/C][C]0.339292[/C][/ROW]
[ROW][C]5[/C][C]0.068721[/C][C]0.6261[/C][C]0.26649[/C][/ROW]
[ROW][C]6[/C][C]-0.127763[/C][C]-1.164[/C][C]0.123884[/C][/ROW]
[ROW][C]7[/C][C]0.066641[/C][C]0.6071[/C][C]0.272712[/C][/ROW]
[ROW][C]8[/C][C]0.047557[/C][C]0.4333[/C][C]0.332973[/C][/ROW]
[ROW][C]9[/C][C]-0.113966[/C][C]-1.0383[/C][C]0.151077[/C][/ROW]
[ROW][C]10[/C][C]0.019912[/C][C]0.1814[/C][C]0.428244[/C][/ROW]
[ROW][C]11[/C][C]-0.047258[/C][C]-0.4305[/C][C]0.333958[/C][/ROW]
[ROW][C]12[/C][C]0.221407[/C][C]2.0171[/C][C]0.023458[/C][/ROW]
[ROW][C]13[/C][C]-0.049355[/C][C]-0.4496[/C][C]0.32707[/C][/ROW]
[ROW][C]14[/C][C]-0.116221[/C][C]-1.0588[/C][C]0.146377[/C][/ROW]
[ROW][C]15[/C][C]0.015614[/C][C]0.1423[/C][C]0.443613[/C][/ROW]
[ROW][C]16[/C][C]0.02295[/C][C]0.2091[/C][C]0.417449[/C][/ROW]
[ROW][C]17[/C][C]0.077953[/C][C]0.7102[/C][C]0.23979[/C][/ROW]
[ROW][C]18[/C][C]-0.109095[/C][C]-0.9939[/C][C]0.161578[/C][/ROW]
[ROW][C]19[/C][C]-0.031587[/C][C]-0.2878[/C][C]0.387118[/C][/ROW]
[ROW][C]20[/C][C]0.008878[/C][C]0.0809[/C][C]0.467866[/C][/ROW]
[ROW][C]21[/C][C]0.104329[/C][C]0.9505[/C][C]0.172312[/C][/ROW]
[ROW][C]22[/C][C]-0.024934[/C][C]-0.2272[/C][C]0.41043[/C][/ROW]
[ROW][C]23[/C][C]-0.239046[/C][C]-2.1778[/C][C]0.016129[/C][/ROW]
[ROW][C]24[/C][C]0.214736[/C][C]1.9563[/C][C]0.026894[/C][/ROW]
[ROW][C]25[/C][C]0.08561[/C][C]0.7799[/C][C]0.218822[/C][/ROW]
[ROW][C]26[/C][C]-0.14769[/C][C]-1.3455[/C][C]0.091061[/C][/ROW]
[ROW][C]27[/C][C]0.059543[/C][C]0.5425[/C][C]0.294478[/C][/ROW]
[ROW][C]28[/C][C]-0.078189[/C][C]-0.7123[/C][C]0.239127[/C][/ROW]
[ROW][C]29[/C][C]0.098637[/C][C]0.8986[/C][C]0.185727[/C][/ROW]
[ROW][C]30[/C][C]-0.071103[/C][C]-0.6478[/C][C]0.259457[/C][/ROW]
[ROW][C]31[/C][C]-0.059182[/C][C]-0.5392[/C][C]0.295604[/C][/ROW]
[ROW][C]32[/C][C]0.141524[/C][C]1.2893[/C][C]0.100429[/C][/ROW]
[ROW][C]33[/C][C]0.055738[/C][C]0.5078[/C][C]0.306472[/C][/ROW]
[ROW][C]34[/C][C]-0.093404[/C][C]-0.8509[/C][C]0.198623[/C][/ROW]
[ROW][C]35[/C][C]-0.20259[/C][C]-1.8457[/C][C]0.034252[/C][/ROW]
[ROW][C]36[/C][C]0.070826[/C][C]0.6453[/C][C]0.260272[/C][/ROW]
[ROW][C]37[/C][C]0.170712[/C][C]1.5553[/C][C]0.061845[/C][/ROW]
[ROW][C]38[/C][C]-0.049291[/C][C]-0.4491[/C][C]0.327277[/C][/ROW]
[ROW][C]39[/C][C]0.003865[/C][C]0.0352[/C][C]0.485998[/C][/ROW]
[ROW][C]40[/C][C]0.014027[/C][C]0.1278[/C][C]0.44931[/C][/ROW]
[ROW][C]41[/C][C]0.002065[/C][C]0.0188[/C][C]0.492516[/C][/ROW]
[ROW][C]42[/C][C]-0.014262[/C][C]-0.1299[/C][C]0.448468[/C][/ROW]
[ROW][C]43[/C][C]-0.022908[/C][C]-0.2087[/C][C]0.417597[/C][/ROW]
[ROW][C]44[/C][C]0.029147[/C][C]0.2655[/C][C]0.395625[/C][/ROW]
[ROW][C]45[/C][C]0.016704[/C][C]0.1522[/C][C]0.439706[/C][/ROW]
[ROW][C]46[/C][C]-0.009973[/C][C]-0.0909[/C][C]0.46391[/C][/ROW]
[ROW][C]47[/C][C]-0.064513[/C][C]-0.5877[/C][C]0.279152[/C][/ROW]
[ROW][C]48[/C][C]0.035823[/C][C]0.3264[/C][C]0.372484[/C][/ROW]
[/TABLE]
Source: https://freestatistics.org/blog/index.php?pk=41256&T=1

Globally Unique Identifier (entire table): ba.freestatistics.org/blog/index.php?pk=41256&T=1

As an alternative you can also use a QR Code:  

The GUIDs for individual cells are displayed in the table below:

Autocorrelation Function
Time lag kACF(k)T-STATP-value
1-0.194172-1.7690.040284
2-0.334218-3.04490.001559
30.0028990.02640.489497
40.0456470.41590.339292
50.0687210.62610.26649
6-0.127763-1.1640.123884
70.0666410.60710.272712
80.0475570.43330.332973
9-0.113966-1.03830.151077
100.0199120.18140.428244
11-0.047258-0.43050.333958
120.2214072.01710.023458
13-0.049355-0.44960.32707
14-0.116221-1.05880.146377
150.0156140.14230.443613
160.022950.20910.417449
170.0779530.71020.23979
18-0.109095-0.99390.161578
19-0.031587-0.28780.387118
200.0088780.08090.467866
210.1043290.95050.172312
22-0.024934-0.22720.41043
23-0.239046-2.17780.016129
240.2147361.95630.026894
250.085610.77990.218822
26-0.14769-1.34550.091061
270.0595430.54250.294478
28-0.078189-0.71230.239127
290.0986370.89860.185727
30-0.071103-0.64780.259457
31-0.059182-0.53920.295604
320.1415241.28930.100429
330.0557380.50780.306472
34-0.093404-0.85090.198623
35-0.20259-1.84570.034252
360.0708260.64530.260272
370.1707121.55530.061845
38-0.049291-0.44910.327277
390.0038650.03520.485998
400.0140270.12780.44931
410.0020650.01880.492516
42-0.014262-0.12990.448468
43-0.022908-0.20870.417597
440.0291470.26550.395625
450.0167040.15220.439706
46-0.009973-0.09090.46391
47-0.064513-0.58770.279152
480.0358230.32640.372484


Partial Autocorrelation Function
Time lag kPACF(k)T-STATP-value
1-0.194172-1.7690.040284
2-0.386493-3.52110.00035
3-0.198063-1.80440.037395
4-0.176495-1.60790.055822
5-0.043655-0.39770.34593
6-0.196106-1.78660.038826
7-0.009612-0.08760.465216
8-0.040588-0.36980.356248
9-0.121531-1.10720.135704
10-0.06219-0.56660.286266
11-0.173633-1.58190.058741
120.1496661.36350.088203
13-0.001103-0.010.496003
140.0447320.40750.342333
15-0.016039-0.14610.44209
160.0294920.26870.394418
170.0702310.63980.262021
18-0.027754-0.25290.400503
19-0.032292-0.29420.384671
20-0.122356-1.11470.134095
210.1124111.02410.154379
22-0.049223-0.44840.327501
23-0.226649-2.06490.021028
240.0036060.03290.486935
25-0.026541-0.24180.404765
26-0.076224-0.69440.244676
270.0552260.50310.308101
28-0.141042-1.2850.101192
290.0014690.01340.494676
30-0.046552-0.42410.336292
31-0.086791-0.79070.215686
320.0313440.28560.387964
330.1240661.13030.130804
34-0.009546-0.0870.465454
35-0.105547-0.96160.169528
36-0.129859-1.18310.120079
37-0.099246-0.90420.184261
38-0.026268-0.23930.405728
39-0.006012-0.05480.478227
400.0726980.66230.254802
410.0074910.06830.472875
420.0555970.50650.306919
430.0166670.15180.439838
440.0177450.16170.435981
45-0.007168-0.06530.474046
460.0008240.00750.497013
470.1087480.99070.162345
480.0481520.43870.331015

\begin{tabular}{lllllllll}
\hline
Partial Autocorrelation Function \tabularnewline
Time lag k & PACF(k) & T-STAT & P-value \tabularnewline
1 & -0.194172 & -1.769 & 0.040284 \tabularnewline
2 & -0.386493 & -3.5211 & 0.00035 \tabularnewline
3 & -0.198063 & -1.8044 & 0.037395 \tabularnewline
4 & -0.176495 & -1.6079 & 0.055822 \tabularnewline
5 & -0.043655 & -0.3977 & 0.34593 \tabularnewline
6 & -0.196106 & -1.7866 & 0.038826 \tabularnewline
7 & -0.009612 & -0.0876 & 0.465216 \tabularnewline
8 & -0.040588 & -0.3698 & 0.356248 \tabularnewline
9 & -0.121531 & -1.1072 & 0.135704 \tabularnewline
10 & -0.06219 & -0.5666 & 0.286266 \tabularnewline
11 & -0.173633 & -1.5819 & 0.058741 \tabularnewline
12 & 0.149666 & 1.3635 & 0.088203 \tabularnewline
13 & -0.001103 & -0.01 & 0.496003 \tabularnewline
14 & 0.044732 & 0.4075 & 0.342333 \tabularnewline
15 & -0.016039 & -0.1461 & 0.44209 \tabularnewline
16 & 0.029492 & 0.2687 & 0.394418 \tabularnewline
17 & 0.070231 & 0.6398 & 0.262021 \tabularnewline
18 & -0.027754 & -0.2529 & 0.400503 \tabularnewline
19 & -0.032292 & -0.2942 & 0.384671 \tabularnewline
20 & -0.122356 & -1.1147 & 0.134095 \tabularnewline
21 & 0.112411 & 1.0241 & 0.154379 \tabularnewline
22 & -0.049223 & -0.4484 & 0.327501 \tabularnewline
23 & -0.226649 & -2.0649 & 0.021028 \tabularnewline
24 & 0.003606 & 0.0329 & 0.486935 \tabularnewline
25 & -0.026541 & -0.2418 & 0.404765 \tabularnewline
26 & -0.076224 & -0.6944 & 0.244676 \tabularnewline
27 & 0.055226 & 0.5031 & 0.308101 \tabularnewline
28 & -0.141042 & -1.285 & 0.101192 \tabularnewline
29 & 0.001469 & 0.0134 & 0.494676 \tabularnewline
30 & -0.046552 & -0.4241 & 0.336292 \tabularnewline
31 & -0.086791 & -0.7907 & 0.215686 \tabularnewline
32 & 0.031344 & 0.2856 & 0.387964 \tabularnewline
33 & 0.124066 & 1.1303 & 0.130804 \tabularnewline
34 & -0.009546 & -0.087 & 0.465454 \tabularnewline
35 & -0.105547 & -0.9616 & 0.169528 \tabularnewline
36 & -0.129859 & -1.1831 & 0.120079 \tabularnewline
37 & -0.099246 & -0.9042 & 0.184261 \tabularnewline
38 & -0.026268 & -0.2393 & 0.405728 \tabularnewline
39 & -0.006012 & -0.0548 & 0.478227 \tabularnewline
40 & 0.072698 & 0.6623 & 0.254802 \tabularnewline
41 & 0.007491 & 0.0683 & 0.472875 \tabularnewline
42 & 0.055597 & 0.5065 & 0.306919 \tabularnewline
43 & 0.016667 & 0.1518 & 0.439838 \tabularnewline
44 & 0.017745 & 0.1617 & 0.435981 \tabularnewline
45 & -0.007168 & -0.0653 & 0.474046 \tabularnewline
46 & 0.000824 & 0.0075 & 0.497013 \tabularnewline
47 & 0.108748 & 0.9907 & 0.162345 \tabularnewline
48 & 0.048152 & 0.4387 & 0.331015 \tabularnewline
\hline
\end{tabular}
%Source: https://freestatistics.org/blog/index.php?pk=41256&T=2

[TABLE]
[ROW][C]Partial Autocorrelation Function[/C][/ROW]
[ROW][C]Time lag k[/C][C]PACF(k)[/C][C]T-STAT[/C][C]P-value[/C][/ROW]
[ROW][C]1[/C][C]-0.194172[/C][C]-1.769[/C][C]0.040284[/C][/ROW]
[ROW][C]2[/C][C]-0.386493[/C][C]-3.5211[/C][C]0.00035[/C][/ROW]
[ROW][C]3[/C][C]-0.198063[/C][C]-1.8044[/C][C]0.037395[/C][/ROW]
[ROW][C]4[/C][C]-0.176495[/C][C]-1.6079[/C][C]0.055822[/C][/ROW]
[ROW][C]5[/C][C]-0.043655[/C][C]-0.3977[/C][C]0.34593[/C][/ROW]
[ROW][C]6[/C][C]-0.196106[/C][C]-1.7866[/C][C]0.038826[/C][/ROW]
[ROW][C]7[/C][C]-0.009612[/C][C]-0.0876[/C][C]0.465216[/C][/ROW]
[ROW][C]8[/C][C]-0.040588[/C][C]-0.3698[/C][C]0.356248[/C][/ROW]
[ROW][C]9[/C][C]-0.121531[/C][C]-1.1072[/C][C]0.135704[/C][/ROW]
[ROW][C]10[/C][C]-0.06219[/C][C]-0.5666[/C][C]0.286266[/C][/ROW]
[ROW][C]11[/C][C]-0.173633[/C][C]-1.5819[/C][C]0.058741[/C][/ROW]
[ROW][C]12[/C][C]0.149666[/C][C]1.3635[/C][C]0.088203[/C][/ROW]
[ROW][C]13[/C][C]-0.001103[/C][C]-0.01[/C][C]0.496003[/C][/ROW]
[ROW][C]14[/C][C]0.044732[/C][C]0.4075[/C][C]0.342333[/C][/ROW]
[ROW][C]15[/C][C]-0.016039[/C][C]-0.1461[/C][C]0.44209[/C][/ROW]
[ROW][C]16[/C][C]0.029492[/C][C]0.2687[/C][C]0.394418[/C][/ROW]
[ROW][C]17[/C][C]0.070231[/C][C]0.6398[/C][C]0.262021[/C][/ROW]
[ROW][C]18[/C][C]-0.027754[/C][C]-0.2529[/C][C]0.400503[/C][/ROW]
[ROW][C]19[/C][C]-0.032292[/C][C]-0.2942[/C][C]0.384671[/C][/ROW]
[ROW][C]20[/C][C]-0.122356[/C][C]-1.1147[/C][C]0.134095[/C][/ROW]
[ROW][C]21[/C][C]0.112411[/C][C]1.0241[/C][C]0.154379[/C][/ROW]
[ROW][C]22[/C][C]-0.049223[/C][C]-0.4484[/C][C]0.327501[/C][/ROW]
[ROW][C]23[/C][C]-0.226649[/C][C]-2.0649[/C][C]0.021028[/C][/ROW]
[ROW][C]24[/C][C]0.003606[/C][C]0.0329[/C][C]0.486935[/C][/ROW]
[ROW][C]25[/C][C]-0.026541[/C][C]-0.2418[/C][C]0.404765[/C][/ROW]
[ROW][C]26[/C][C]-0.076224[/C][C]-0.6944[/C][C]0.244676[/C][/ROW]
[ROW][C]27[/C][C]0.055226[/C][C]0.5031[/C][C]0.308101[/C][/ROW]
[ROW][C]28[/C][C]-0.141042[/C][C]-1.285[/C][C]0.101192[/C][/ROW]
[ROW][C]29[/C][C]0.001469[/C][C]0.0134[/C][C]0.494676[/C][/ROW]
[ROW][C]30[/C][C]-0.046552[/C][C]-0.4241[/C][C]0.336292[/C][/ROW]
[ROW][C]31[/C][C]-0.086791[/C][C]-0.7907[/C][C]0.215686[/C][/ROW]
[ROW][C]32[/C][C]0.031344[/C][C]0.2856[/C][C]0.387964[/C][/ROW]
[ROW][C]33[/C][C]0.124066[/C][C]1.1303[/C][C]0.130804[/C][/ROW]
[ROW][C]34[/C][C]-0.009546[/C][C]-0.087[/C][C]0.465454[/C][/ROW]
[ROW][C]35[/C][C]-0.105547[/C][C]-0.9616[/C][C]0.169528[/C][/ROW]
[ROW][C]36[/C][C]-0.129859[/C][C]-1.1831[/C][C]0.120079[/C][/ROW]
[ROW][C]37[/C][C]-0.099246[/C][C]-0.9042[/C][C]0.184261[/C][/ROW]
[ROW][C]38[/C][C]-0.026268[/C][C]-0.2393[/C][C]0.405728[/C][/ROW]
[ROW][C]39[/C][C]-0.006012[/C][C]-0.0548[/C][C]0.478227[/C][/ROW]
[ROW][C]40[/C][C]0.072698[/C][C]0.6623[/C][C]0.254802[/C][/ROW]
[ROW][C]41[/C][C]0.007491[/C][C]0.0683[/C][C]0.472875[/C][/ROW]
[ROW][C]42[/C][C]0.055597[/C][C]0.5065[/C][C]0.306919[/C][/ROW]
[ROW][C]43[/C][C]0.016667[/C][C]0.1518[/C][C]0.439838[/C][/ROW]
[ROW][C]44[/C][C]0.017745[/C][C]0.1617[/C][C]0.435981[/C][/ROW]
[ROW][C]45[/C][C]-0.007168[/C][C]-0.0653[/C][C]0.474046[/C][/ROW]
[ROW][C]46[/C][C]0.000824[/C][C]0.0075[/C][C]0.497013[/C][/ROW]
[ROW][C]47[/C][C]0.108748[/C][C]0.9907[/C][C]0.162345[/C][/ROW]
[ROW][C]48[/C][C]0.048152[/C][C]0.4387[/C][C]0.331015[/C][/ROW]
[/TABLE]
Source: https://freestatistics.org/blog/index.php?pk=41256&T=2

Globally Unique Identifier (entire table): ba.freestatistics.org/blog/index.php?pk=41256&T=2

As an alternative you can also use a QR Code:  

The GUIDs for individual cells are displayed in the table below:

Partial Autocorrelation Function
Time lag kPACF(k)T-STATP-value
1-0.194172-1.7690.040284
2-0.386493-3.52110.00035
3-0.198063-1.80440.037395
4-0.176495-1.60790.055822
5-0.043655-0.39770.34593
6-0.196106-1.78660.038826
7-0.009612-0.08760.465216
8-0.040588-0.36980.356248
9-0.121531-1.10720.135704
10-0.06219-0.56660.286266
11-0.173633-1.58190.058741
120.1496661.36350.088203
13-0.001103-0.010.496003
140.0447320.40750.342333
15-0.016039-0.14610.44209
160.0294920.26870.394418
170.0702310.63980.262021
18-0.027754-0.25290.400503
19-0.032292-0.29420.384671
20-0.122356-1.11470.134095
210.1124111.02410.154379
22-0.049223-0.44840.327501
23-0.226649-2.06490.021028
240.0036060.03290.486935
25-0.026541-0.24180.404765
26-0.076224-0.69440.244676
270.0552260.50310.308101
28-0.141042-1.2850.101192
290.0014690.01340.494676
30-0.046552-0.42410.336292
31-0.086791-0.79070.215686
320.0313440.28560.387964
330.1240661.13030.130804
34-0.009546-0.0870.465454
35-0.105547-0.96160.169528
36-0.129859-1.18310.120079
37-0.099246-0.90420.184261
38-0.026268-0.23930.405728
39-0.006012-0.05480.478227
400.0726980.66230.254802
410.0074910.06830.472875
420.0555970.50650.306919
430.0166670.15180.439838
440.0177450.16170.435981
45-0.007168-0.06530.474046
460.0008240.00750.497013
470.1087480.99070.162345
480.0481520.43870.331015


Parameters (Session):
par1 = 48 ; par2 = 1 ; par3 = 1 ; par4 = 0 ; par5 = 12 ;
Parameters (R input):
par1 = 48 ; par2 = 1 ; par3 = 1 ; par4 = 0 ; par5 = 12 ;
R code (references can be found in the software module):
if (par1 == 'Default') {
par1 = 10*log10(length(x))
} else {
par1 <- as.numeric(par1)
}
par2 <- as.numeric(par2)
par3 <- as.numeric(par3)
par4 <- as.numeric(par4)
par5 <- as.numeric(par5)
if (par2 == 0) {
x <- log(x)
} else {
x <- (x ^ par2 - 1) / par2
}
if (par3 > 0) x <- diff(x,lag=1,difference=par3)
if (par4 > 0) x <- diff(x,lag=par5,difference=par4)
bitmap(file='pic1.png')
racf <- acf(x,par1,main='Autocorrelation',xlab='lags',ylab='ACF')
dev.off()
bitmap(file='pic2.png')
rpacf <- pacf(x,par1,main='Partial Autocorrelation',xlab='lags',ylab='PACF')
dev.off()
(myacf <- c(racf$acf))
(mypacf <- c(rpacf$acf))
lengthx <- length(x)
sqrtn <- sqrt(lengthx)
load(file='createtable')
a<-table.start()
a<-table.row.start(a)
a<-table.element(a,'Autocorrelation Function',4,TRUE)
a<-table.row.end(a)
a<-table.row.start(a)
a<-table.element(a,'Time lag k',header=TRUE)
a<-table.element(a,hyperlink('basics.htm','ACF(k)','click here for more information about the Autocorrelation Function'),header=TRUE)
a<-table.element(a,'T-STAT',header=TRUE)
a<-table.element(a,'P-value',header=TRUE)
a<-table.row.end(a)
for (i in 2:(par1+1)) {
a<-table.row.start(a)
a<-table.element(a,i-1,header=TRUE)
a<-table.element(a,round(myacf[i],6))
mytstat <- myacf[i]*sqrtn
a<-table.element(a,round(mytstat,4))
a<-table.element(a,round(1-pt(abs(mytstat),lengthx),6))
a<-table.row.end(a)
}
a<-table.end(a)
table.save(a,file='mytable.tab')
a<-table.start()
a<-table.row.start(a)
a<-table.element(a,'Partial Autocorrelation Function',4,TRUE)
a<-table.row.end(a)
a<-table.row.start(a)
a<-table.element(a,'Time lag k',header=TRUE)
a<-table.element(a,hyperlink('basics.htm','PACF(k)','click here for more information about the Partial Autocorrelation Function'),header=TRUE)
a<-table.element(a,'T-STAT',header=TRUE)
a<-table.element(a,'P-value',header=TRUE)
a<-table.row.end(a)
for (i in 1:par1) {
a<-table.row.start(a)
a<-table.element(a,i,header=TRUE)
a<-table.element(a,round(mypacf[i],6))
mytstat <- mypacf[i]*sqrtn
a<-table.element(a,round(mytstat,4))
a<-table.element(a,round(1-pt(abs(mytstat),lengthx),6))
a<-table.row.end(a)
}
a<-table.end(a)
table.save(a,file='mytable1.tab')