Free Statistics

of Irreproducible Research!

Author's title

Author*Unverified author*
R Software Modulerwasp_autocorrelation.wasp
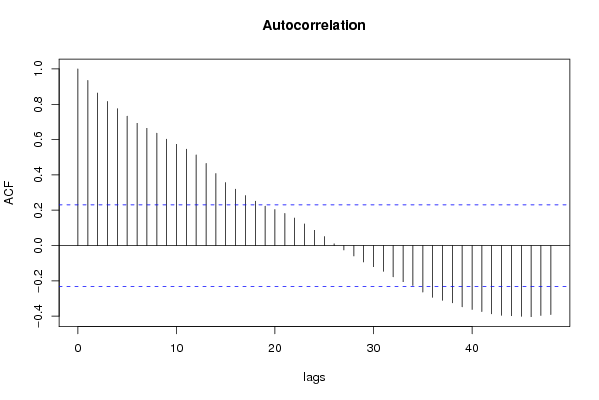
Title produced by software(Partial) Autocorrelation Function
Date of computationTue, 02 Jun 2009 01:01:05 -0600
Cite this page as followsStatistical Computations at FreeStatistics.org, Office for Research Development and Education, URL https://freestatistics.org/blog/index.php?v=date/2009/Jun/02/t1243926108kkwlwbj8ttnda3o.htm/, Retrieved Thu, 09 May 2024 22:38:40 +0000
Statistical Computations at FreeStatistics.org, Office for Research Development and Education, URL https://freestatistics.org/blog/index.php?pk=41144, Retrieved Thu, 09 May 2024 22:38:40 +0000
QR Codes:

Original text written by user:
IsPrivate?No (this computation is public)
User-defined keywords
Estimated Impact128
Family? (F = Feedback message, R = changed R code, M = changed R Module, P = changed Parameters, D = changed Data)
-       [(Partial) Autocorrelation Function] [AUTOCORRELATIE GO...] [2009-06-02 07:01:05] [23fb7a586ae7811d7719db820c9fb3e7] [Current]
Feedback Forum

Post a new message
Dataseries X:
9721
9897
9828
9924
10371
10846
10413
10709
10662
10570
10297
10635
10872
10296
10383
10431
10574
10653
10805
10872
10625
10407
10463
10556
10646
10702
11353
11346
11451
11964
12574
13031
13812
14544
14931
14886
16005
17064
15168
16050
15839
15137
14954
15648
15305
15579
16348
15928
16171
15937
15713
15594
15683
16438
17032
17696
17745
19394
20148
20108
18584
18441
18391
19178
18079
18483
19644
19195
19650
20830
23595
22937


Summary of computational transaction
Raw Inputview raw input (R code)
Raw Outputview raw output of R engine
Computing time1 seconds
R Server'George Udny Yule' @ 72.249.76.132

\begin{tabular}{lllllllll}
\hline
Summary of computational transaction \tabularnewline
Raw Input & view raw input (R code)  \tabularnewline
Raw Output & view raw output of R engine  \tabularnewline
Computing time & 1 seconds \tabularnewline
R Server & 'George Udny Yule' @ 72.249.76.132 \tabularnewline
\hline
\end{tabular}
%Source: https://freestatistics.org/blog/index.php?pk=41144&T=0

[TABLE]
[ROW][C]Summary of computational transaction[/C][/ROW]
[ROW][C]Raw Input[/C][C]view raw input (R code) [/C][/ROW]
[ROW][C]Raw Output[/C][C]view raw output of R engine [/C][/ROW]
[ROW][C]Computing time[/C][C]1 seconds[/C][/ROW]
[ROW][C]R Server[/C][C]'George Udny Yule' @ 72.249.76.132[/C][/ROW]
[/TABLE]
Source: https://freestatistics.org/blog/index.php?pk=41144&T=0

Globally Unique Identifier (entire table): ba.freestatistics.org/blog/index.php?pk=41144&T=0

As an alternative you can also use a QR Code:  

The GUIDs for individual cells are displayed in the table below:

Summary of computational transaction
Raw Inputview raw input (R code)
Raw Outputview raw output of R engine
Computing time1 seconds
R Server'George Udny Yule' @ 72.249.76.132


Autocorrelation Function
Time lag kACF(k)T-STATP-value
10.9348377.93240
20.8633017.32530
30.8159176.92330
40.7746816.57340
50.7323556.21420
60.6923295.87460
70.6635245.63020
80.6364665.40060
90.6020325.10841e-06
100.5729534.86173e-06
110.5454974.62878e-06
120.5133534.35592.2e-05
130.4646873.9439.2e-05
140.4074263.45710.00046
150.3568913.02830.001706
160.3192882.70930.004211
170.2828382.40.009492
180.2510212.130.018295
190.223081.89290.031196
200.2040641.73150.043819
210.1816451.54130.063812
220.1554841.31930.095621
230.1222121.0370.151601
240.0865710.73460.23249
250.0506360.42970.334364
260.0098880.08390.466684
27-0.024552-0.20830.417779
28-0.058912-0.49990.309339
29-0.092466-0.78460.21763
30-0.120003-1.01830.155981
31-0.146085-1.23960.10958
32-0.176745-1.49970.069028
33-0.204274-1.73330.04366
34-0.225634-1.91460.029761
35-0.26369-2.23750.014175
36-0.292978-2.4860.00762
37-0.309942-2.62990.005218
38-0.324586-2.75420.003722
39-0.347078-2.94510.002173
40-0.361969-3.07140.001503
41-0.373738-3.17130.001115
42-0.386634-3.28070.000799
43-0.395334-3.35450.000636
44-0.397244-3.37070.000604
45-0.400948-3.40220.000547
46-0.402598-3.41620.000524
47-0.395453-3.35550.000634
48-0.390767-3.31580.000717

\begin{tabular}{lllllllll}
\hline
Autocorrelation Function \tabularnewline
Time lag k & ACF(k) & T-STAT & P-value \tabularnewline
1 & 0.934837 & 7.9324 & 0 \tabularnewline
2 & 0.863301 & 7.3253 & 0 \tabularnewline
3 & 0.815917 & 6.9233 & 0 \tabularnewline
4 & 0.774681 & 6.5734 & 0 \tabularnewline
5 & 0.732355 & 6.2142 & 0 \tabularnewline
6 & 0.692329 & 5.8746 & 0 \tabularnewline
7 & 0.663524 & 5.6302 & 0 \tabularnewline
8 & 0.636466 & 5.4006 & 0 \tabularnewline
9 & 0.602032 & 5.1084 & 1e-06 \tabularnewline
10 & 0.572953 & 4.8617 & 3e-06 \tabularnewline
11 & 0.545497 & 4.6287 & 8e-06 \tabularnewline
12 & 0.513353 & 4.3559 & 2.2e-05 \tabularnewline
13 & 0.464687 & 3.943 & 9.2e-05 \tabularnewline
14 & 0.407426 & 3.4571 & 0.00046 \tabularnewline
15 & 0.356891 & 3.0283 & 0.001706 \tabularnewline
16 & 0.319288 & 2.7093 & 0.004211 \tabularnewline
17 & 0.282838 & 2.4 & 0.009492 \tabularnewline
18 & 0.251021 & 2.13 & 0.018295 \tabularnewline
19 & 0.22308 & 1.8929 & 0.031196 \tabularnewline
20 & 0.204064 & 1.7315 & 0.043819 \tabularnewline
21 & 0.181645 & 1.5413 & 0.063812 \tabularnewline
22 & 0.155484 & 1.3193 & 0.095621 \tabularnewline
23 & 0.122212 & 1.037 & 0.151601 \tabularnewline
24 & 0.086571 & 0.7346 & 0.23249 \tabularnewline
25 & 0.050636 & 0.4297 & 0.334364 \tabularnewline
26 & 0.009888 & 0.0839 & 0.466684 \tabularnewline
27 & -0.024552 & -0.2083 & 0.417779 \tabularnewline
28 & -0.058912 & -0.4999 & 0.309339 \tabularnewline
29 & -0.092466 & -0.7846 & 0.21763 \tabularnewline
30 & -0.120003 & -1.0183 & 0.155981 \tabularnewline
31 & -0.146085 & -1.2396 & 0.10958 \tabularnewline
32 & -0.176745 & -1.4997 & 0.069028 \tabularnewline
33 & -0.204274 & -1.7333 & 0.04366 \tabularnewline
34 & -0.225634 & -1.9146 & 0.029761 \tabularnewline
35 & -0.26369 & -2.2375 & 0.014175 \tabularnewline
36 & -0.292978 & -2.486 & 0.00762 \tabularnewline
37 & -0.309942 & -2.6299 & 0.005218 \tabularnewline
38 & -0.324586 & -2.7542 & 0.003722 \tabularnewline
39 & -0.347078 & -2.9451 & 0.002173 \tabularnewline
40 & -0.361969 & -3.0714 & 0.001503 \tabularnewline
41 & -0.373738 & -3.1713 & 0.001115 \tabularnewline
42 & -0.386634 & -3.2807 & 0.000799 \tabularnewline
43 & -0.395334 & -3.3545 & 0.000636 \tabularnewline
44 & -0.397244 & -3.3707 & 0.000604 \tabularnewline
45 & -0.400948 & -3.4022 & 0.000547 \tabularnewline
46 & -0.402598 & -3.4162 & 0.000524 \tabularnewline
47 & -0.395453 & -3.3555 & 0.000634 \tabularnewline
48 & -0.390767 & -3.3158 & 0.000717 \tabularnewline
\hline
\end{tabular}
%Source: https://freestatistics.org/blog/index.php?pk=41144&T=1

[TABLE]
[ROW][C]Autocorrelation Function[/C][/ROW]
[ROW][C]Time lag k[/C][C]ACF(k)[/C][C]T-STAT[/C][C]P-value[/C][/ROW]
[ROW][C]1[/C][C]0.934837[/C][C]7.9324[/C][C]0[/C][/ROW]
[ROW][C]2[/C][C]0.863301[/C][C]7.3253[/C][C]0[/C][/ROW]
[ROW][C]3[/C][C]0.815917[/C][C]6.9233[/C][C]0[/C][/ROW]
[ROW][C]4[/C][C]0.774681[/C][C]6.5734[/C][C]0[/C][/ROW]
[ROW][C]5[/C][C]0.732355[/C][C]6.2142[/C][C]0[/C][/ROW]
[ROW][C]6[/C][C]0.692329[/C][C]5.8746[/C][C]0[/C][/ROW]
[ROW][C]7[/C][C]0.663524[/C][C]5.6302[/C][C]0[/C][/ROW]
[ROW][C]8[/C][C]0.636466[/C][C]5.4006[/C][C]0[/C][/ROW]
[ROW][C]9[/C][C]0.602032[/C][C]5.1084[/C][C]1e-06[/C][/ROW]
[ROW][C]10[/C][C]0.572953[/C][C]4.8617[/C][C]3e-06[/C][/ROW]
[ROW][C]11[/C][C]0.545497[/C][C]4.6287[/C][C]8e-06[/C][/ROW]
[ROW][C]12[/C][C]0.513353[/C][C]4.3559[/C][C]2.2e-05[/C][/ROW]
[ROW][C]13[/C][C]0.464687[/C][C]3.943[/C][C]9.2e-05[/C][/ROW]
[ROW][C]14[/C][C]0.407426[/C][C]3.4571[/C][C]0.00046[/C][/ROW]
[ROW][C]15[/C][C]0.356891[/C][C]3.0283[/C][C]0.001706[/C][/ROW]
[ROW][C]16[/C][C]0.319288[/C][C]2.7093[/C][C]0.004211[/C][/ROW]
[ROW][C]17[/C][C]0.282838[/C][C]2.4[/C][C]0.009492[/C][/ROW]
[ROW][C]18[/C][C]0.251021[/C][C]2.13[/C][C]0.018295[/C][/ROW]
[ROW][C]19[/C][C]0.22308[/C][C]1.8929[/C][C]0.031196[/C][/ROW]
[ROW][C]20[/C][C]0.204064[/C][C]1.7315[/C][C]0.043819[/C][/ROW]
[ROW][C]21[/C][C]0.181645[/C][C]1.5413[/C][C]0.063812[/C][/ROW]
[ROW][C]22[/C][C]0.155484[/C][C]1.3193[/C][C]0.095621[/C][/ROW]
[ROW][C]23[/C][C]0.122212[/C][C]1.037[/C][C]0.151601[/C][/ROW]
[ROW][C]24[/C][C]0.086571[/C][C]0.7346[/C][C]0.23249[/C][/ROW]
[ROW][C]25[/C][C]0.050636[/C][C]0.4297[/C][C]0.334364[/C][/ROW]
[ROW][C]26[/C][C]0.009888[/C][C]0.0839[/C][C]0.466684[/C][/ROW]
[ROW][C]27[/C][C]-0.024552[/C][C]-0.2083[/C][C]0.417779[/C][/ROW]
[ROW][C]28[/C][C]-0.058912[/C][C]-0.4999[/C][C]0.309339[/C][/ROW]
[ROW][C]29[/C][C]-0.092466[/C][C]-0.7846[/C][C]0.21763[/C][/ROW]
[ROW][C]30[/C][C]-0.120003[/C][C]-1.0183[/C][C]0.155981[/C][/ROW]
[ROW][C]31[/C][C]-0.146085[/C][C]-1.2396[/C][C]0.10958[/C][/ROW]
[ROW][C]32[/C][C]-0.176745[/C][C]-1.4997[/C][C]0.069028[/C][/ROW]
[ROW][C]33[/C][C]-0.204274[/C][C]-1.7333[/C][C]0.04366[/C][/ROW]
[ROW][C]34[/C][C]-0.225634[/C][C]-1.9146[/C][C]0.029761[/C][/ROW]
[ROW][C]35[/C][C]-0.26369[/C][C]-2.2375[/C][C]0.014175[/C][/ROW]
[ROW][C]36[/C][C]-0.292978[/C][C]-2.486[/C][C]0.00762[/C][/ROW]
[ROW][C]37[/C][C]-0.309942[/C][C]-2.6299[/C][C]0.005218[/C][/ROW]
[ROW][C]38[/C][C]-0.324586[/C][C]-2.7542[/C][C]0.003722[/C][/ROW]
[ROW][C]39[/C][C]-0.347078[/C][C]-2.9451[/C][C]0.002173[/C][/ROW]
[ROW][C]40[/C][C]-0.361969[/C][C]-3.0714[/C][C]0.001503[/C][/ROW]
[ROW][C]41[/C][C]-0.373738[/C][C]-3.1713[/C][C]0.001115[/C][/ROW]
[ROW][C]42[/C][C]-0.386634[/C][C]-3.2807[/C][C]0.000799[/C][/ROW]
[ROW][C]43[/C][C]-0.395334[/C][C]-3.3545[/C][C]0.000636[/C][/ROW]
[ROW][C]44[/C][C]-0.397244[/C][C]-3.3707[/C][C]0.000604[/C][/ROW]
[ROW][C]45[/C][C]-0.400948[/C][C]-3.4022[/C][C]0.000547[/C][/ROW]
[ROW][C]46[/C][C]-0.402598[/C][C]-3.4162[/C][C]0.000524[/C][/ROW]
[ROW][C]47[/C][C]-0.395453[/C][C]-3.3555[/C][C]0.000634[/C][/ROW]
[ROW][C]48[/C][C]-0.390767[/C][C]-3.3158[/C][C]0.000717[/C][/ROW]
[/TABLE]
Source: https://freestatistics.org/blog/index.php?pk=41144&T=1

Globally Unique Identifier (entire table): ba.freestatistics.org/blog/index.php?pk=41144&T=1

As an alternative you can also use a QR Code:  

The GUIDs for individual cells are displayed in the table below:

Autocorrelation Function
Time lag kACF(k)T-STATP-value
10.9348377.93240
20.8633017.32530
30.8159176.92330
40.7746816.57340
50.7323556.21420
60.6923295.87460
70.6635245.63020
80.6364665.40060
90.6020325.10841e-06
100.5729534.86173e-06
110.5454974.62878e-06
120.5133534.35592.2e-05
130.4646873.9439.2e-05
140.4074263.45710.00046
150.3568913.02830.001706
160.3192882.70930.004211
170.2828382.40.009492
180.2510212.130.018295
190.223081.89290.031196
200.2040641.73150.043819
210.1816451.54130.063812
220.1554841.31930.095621
230.1222121.0370.151601
240.0865710.73460.23249
250.0506360.42970.334364
260.0098880.08390.466684
27-0.024552-0.20830.417779
28-0.058912-0.49990.309339
29-0.092466-0.78460.21763
30-0.120003-1.01830.155981
31-0.146085-1.23960.10958
32-0.176745-1.49970.069028
33-0.204274-1.73330.04366
34-0.225634-1.91460.029761
35-0.26369-2.23750.014175
36-0.292978-2.4860.00762
37-0.309942-2.62990.005218
38-0.324586-2.75420.003722
39-0.347078-2.94510.002173
40-0.361969-3.07140.001503
41-0.373738-3.17130.001115
42-0.386634-3.28070.000799
43-0.395334-3.35450.000636
44-0.397244-3.37070.000604
45-0.400948-3.40220.000547
46-0.402598-3.41620.000524
47-0.395453-3.35550.000634
48-0.390767-3.31580.000717


Partial Autocorrelation Function
Time lag kPACF(k)T-STATP-value
10.9348377.93240
2-0.084221-0.71460.238571
30.156841.33080.093722
40.0019730.01670.493344
5-0.002428-0.02060.491811
60.007350.06240.475222
70.0687730.58360.280671
8-0.005096-0.04320.482816
9-0.045168-0.38330.351328
100.0402530.34160.366839
11-0.02357-0.20.421024
12-0.038057-0.32290.373844
13-0.142-1.20490.116093
14-0.096371-0.81770.208102
15-0.027903-0.23680.406756
160.0396630.33660.368716
17-0.026004-0.22070.412993
180.0262950.22310.412037
19-0.009838-0.08350.466852
200.0572530.48580.314288
21-0.030625-0.25990.397857
22-0.011226-0.09530.462187
23-0.085468-0.72520.235335
24-0.034668-0.29420.384736
25-0.023187-0.19680.422288
26-0.063577-0.53950.295615
270.0128760.10930.456651
28-0.087231-0.74020.2308
29-0.027276-0.23140.408813
30-0.010685-0.09070.464005
31-0.027776-0.23570.407172
32-0.086921-0.73750.231593
330.0075430.0640.474571
340.0145540.12350.45103
35-0.150732-1.2790.102501
360.0900390.7640.223681
370.016470.13970.444624
38-0.00431-0.03660.485463
39-0.069304-0.58810.279166
400.0548070.46510.321649
41-0.06557-0.55640.289838
42-0.019136-0.16240.435733
430.025170.21360.415743
440.0177340.15050.440403
45-0.036604-0.31060.378504
460.03090.26220.396961
470.0712770.60480.273605
48-0.05172-0.43890.331038

\begin{tabular}{lllllllll}
\hline
Partial Autocorrelation Function \tabularnewline
Time lag k & PACF(k) & T-STAT & P-value \tabularnewline
1 & 0.934837 & 7.9324 & 0 \tabularnewline
2 & -0.084221 & -0.7146 & 0.238571 \tabularnewline
3 & 0.15684 & 1.3308 & 0.093722 \tabularnewline
4 & 0.001973 & 0.0167 & 0.493344 \tabularnewline
5 & -0.002428 & -0.0206 & 0.491811 \tabularnewline
6 & 0.00735 & 0.0624 & 0.475222 \tabularnewline
7 & 0.068773 & 0.5836 & 0.280671 \tabularnewline
8 & -0.005096 & -0.0432 & 0.482816 \tabularnewline
9 & -0.045168 & -0.3833 & 0.351328 \tabularnewline
10 & 0.040253 & 0.3416 & 0.366839 \tabularnewline
11 & -0.02357 & -0.2 & 0.421024 \tabularnewline
12 & -0.038057 & -0.3229 & 0.373844 \tabularnewline
13 & -0.142 & -1.2049 & 0.116093 \tabularnewline
14 & -0.096371 & -0.8177 & 0.208102 \tabularnewline
15 & -0.027903 & -0.2368 & 0.406756 \tabularnewline
16 & 0.039663 & 0.3366 & 0.368716 \tabularnewline
17 & -0.026004 & -0.2207 & 0.412993 \tabularnewline
18 & 0.026295 & 0.2231 & 0.412037 \tabularnewline
19 & -0.009838 & -0.0835 & 0.466852 \tabularnewline
20 & 0.057253 & 0.4858 & 0.314288 \tabularnewline
21 & -0.030625 & -0.2599 & 0.397857 \tabularnewline
22 & -0.011226 & -0.0953 & 0.462187 \tabularnewline
23 & -0.085468 & -0.7252 & 0.235335 \tabularnewline
24 & -0.034668 & -0.2942 & 0.384736 \tabularnewline
25 & -0.023187 & -0.1968 & 0.422288 \tabularnewline
26 & -0.063577 & -0.5395 & 0.295615 \tabularnewline
27 & 0.012876 & 0.1093 & 0.456651 \tabularnewline
28 & -0.087231 & -0.7402 & 0.2308 \tabularnewline
29 & -0.027276 & -0.2314 & 0.408813 \tabularnewline
30 & -0.010685 & -0.0907 & 0.464005 \tabularnewline
31 & -0.027776 & -0.2357 & 0.407172 \tabularnewline
32 & -0.086921 & -0.7375 & 0.231593 \tabularnewline
33 & 0.007543 & 0.064 & 0.474571 \tabularnewline
34 & 0.014554 & 0.1235 & 0.45103 \tabularnewline
35 & -0.150732 & -1.279 & 0.102501 \tabularnewline
36 & 0.090039 & 0.764 & 0.223681 \tabularnewline
37 & 0.01647 & 0.1397 & 0.444624 \tabularnewline
38 & -0.00431 & -0.0366 & 0.485463 \tabularnewline
39 & -0.069304 & -0.5881 & 0.279166 \tabularnewline
40 & 0.054807 & 0.4651 & 0.321649 \tabularnewline
41 & -0.06557 & -0.5564 & 0.289838 \tabularnewline
42 & -0.019136 & -0.1624 & 0.435733 \tabularnewline
43 & 0.02517 & 0.2136 & 0.415743 \tabularnewline
44 & 0.017734 & 0.1505 & 0.440403 \tabularnewline
45 & -0.036604 & -0.3106 & 0.378504 \tabularnewline
46 & 0.0309 & 0.2622 & 0.396961 \tabularnewline
47 & 0.071277 & 0.6048 & 0.273605 \tabularnewline
48 & -0.05172 & -0.4389 & 0.331038 \tabularnewline
\hline
\end{tabular}
%Source: https://freestatistics.org/blog/index.php?pk=41144&T=2

[TABLE]
[ROW][C]Partial Autocorrelation Function[/C][/ROW]
[ROW][C]Time lag k[/C][C]PACF(k)[/C][C]T-STAT[/C][C]P-value[/C][/ROW]
[ROW][C]1[/C][C]0.934837[/C][C]7.9324[/C][C]0[/C][/ROW]
[ROW][C]2[/C][C]-0.084221[/C][C]-0.7146[/C][C]0.238571[/C][/ROW]
[ROW][C]3[/C][C]0.15684[/C][C]1.3308[/C][C]0.093722[/C][/ROW]
[ROW][C]4[/C][C]0.001973[/C][C]0.0167[/C][C]0.493344[/C][/ROW]
[ROW][C]5[/C][C]-0.002428[/C][C]-0.0206[/C][C]0.491811[/C][/ROW]
[ROW][C]6[/C][C]0.00735[/C][C]0.0624[/C][C]0.475222[/C][/ROW]
[ROW][C]7[/C][C]0.068773[/C][C]0.5836[/C][C]0.280671[/C][/ROW]
[ROW][C]8[/C][C]-0.005096[/C][C]-0.0432[/C][C]0.482816[/C][/ROW]
[ROW][C]9[/C][C]-0.045168[/C][C]-0.3833[/C][C]0.351328[/C][/ROW]
[ROW][C]10[/C][C]0.040253[/C][C]0.3416[/C][C]0.366839[/C][/ROW]
[ROW][C]11[/C][C]-0.02357[/C][C]-0.2[/C][C]0.421024[/C][/ROW]
[ROW][C]12[/C][C]-0.038057[/C][C]-0.3229[/C][C]0.373844[/C][/ROW]
[ROW][C]13[/C][C]-0.142[/C][C]-1.2049[/C][C]0.116093[/C][/ROW]
[ROW][C]14[/C][C]-0.096371[/C][C]-0.8177[/C][C]0.208102[/C][/ROW]
[ROW][C]15[/C][C]-0.027903[/C][C]-0.2368[/C][C]0.406756[/C][/ROW]
[ROW][C]16[/C][C]0.039663[/C][C]0.3366[/C][C]0.368716[/C][/ROW]
[ROW][C]17[/C][C]-0.026004[/C][C]-0.2207[/C][C]0.412993[/C][/ROW]
[ROW][C]18[/C][C]0.026295[/C][C]0.2231[/C][C]0.412037[/C][/ROW]
[ROW][C]19[/C][C]-0.009838[/C][C]-0.0835[/C][C]0.466852[/C][/ROW]
[ROW][C]20[/C][C]0.057253[/C][C]0.4858[/C][C]0.314288[/C][/ROW]
[ROW][C]21[/C][C]-0.030625[/C][C]-0.2599[/C][C]0.397857[/C][/ROW]
[ROW][C]22[/C][C]-0.011226[/C][C]-0.0953[/C][C]0.462187[/C][/ROW]
[ROW][C]23[/C][C]-0.085468[/C][C]-0.7252[/C][C]0.235335[/C][/ROW]
[ROW][C]24[/C][C]-0.034668[/C][C]-0.2942[/C][C]0.384736[/C][/ROW]
[ROW][C]25[/C][C]-0.023187[/C][C]-0.1968[/C][C]0.422288[/C][/ROW]
[ROW][C]26[/C][C]-0.063577[/C][C]-0.5395[/C][C]0.295615[/C][/ROW]
[ROW][C]27[/C][C]0.012876[/C][C]0.1093[/C][C]0.456651[/C][/ROW]
[ROW][C]28[/C][C]-0.087231[/C][C]-0.7402[/C][C]0.2308[/C][/ROW]
[ROW][C]29[/C][C]-0.027276[/C][C]-0.2314[/C][C]0.408813[/C][/ROW]
[ROW][C]30[/C][C]-0.010685[/C][C]-0.0907[/C][C]0.464005[/C][/ROW]
[ROW][C]31[/C][C]-0.027776[/C][C]-0.2357[/C][C]0.407172[/C][/ROW]
[ROW][C]32[/C][C]-0.086921[/C][C]-0.7375[/C][C]0.231593[/C][/ROW]
[ROW][C]33[/C][C]0.007543[/C][C]0.064[/C][C]0.474571[/C][/ROW]
[ROW][C]34[/C][C]0.014554[/C][C]0.1235[/C][C]0.45103[/C][/ROW]
[ROW][C]35[/C][C]-0.150732[/C][C]-1.279[/C][C]0.102501[/C][/ROW]
[ROW][C]36[/C][C]0.090039[/C][C]0.764[/C][C]0.223681[/C][/ROW]
[ROW][C]37[/C][C]0.01647[/C][C]0.1397[/C][C]0.444624[/C][/ROW]
[ROW][C]38[/C][C]-0.00431[/C][C]-0.0366[/C][C]0.485463[/C][/ROW]
[ROW][C]39[/C][C]-0.069304[/C][C]-0.5881[/C][C]0.279166[/C][/ROW]
[ROW][C]40[/C][C]0.054807[/C][C]0.4651[/C][C]0.321649[/C][/ROW]
[ROW][C]41[/C][C]-0.06557[/C][C]-0.5564[/C][C]0.289838[/C][/ROW]
[ROW][C]42[/C][C]-0.019136[/C][C]-0.1624[/C][C]0.435733[/C][/ROW]
[ROW][C]43[/C][C]0.02517[/C][C]0.2136[/C][C]0.415743[/C][/ROW]
[ROW][C]44[/C][C]0.017734[/C][C]0.1505[/C][C]0.440403[/C][/ROW]
[ROW][C]45[/C][C]-0.036604[/C][C]-0.3106[/C][C]0.378504[/C][/ROW]
[ROW][C]46[/C][C]0.0309[/C][C]0.2622[/C][C]0.396961[/C][/ROW]
[ROW][C]47[/C][C]0.071277[/C][C]0.6048[/C][C]0.273605[/C][/ROW]
[ROW][C]48[/C][C]-0.05172[/C][C]-0.4389[/C][C]0.331038[/C][/ROW]
[/TABLE]
Source: https://freestatistics.org/blog/index.php?pk=41144&T=2

Globally Unique Identifier (entire table): ba.freestatistics.org/blog/index.php?pk=41144&T=2

As an alternative you can also use a QR Code:  

The GUIDs for individual cells are displayed in the table below:

Partial Autocorrelation Function
Time lag kPACF(k)T-STATP-value
10.9348377.93240
2-0.084221-0.71460.238571
30.156841.33080.093722
40.0019730.01670.493344
5-0.002428-0.02060.491811
60.007350.06240.475222
70.0687730.58360.280671
8-0.005096-0.04320.482816
9-0.045168-0.38330.351328
100.0402530.34160.366839
11-0.02357-0.20.421024
12-0.038057-0.32290.373844
13-0.142-1.20490.116093
14-0.096371-0.81770.208102
15-0.027903-0.23680.406756
160.0396630.33660.368716
17-0.026004-0.22070.412993
180.0262950.22310.412037
19-0.009838-0.08350.466852
200.0572530.48580.314288
21-0.030625-0.25990.397857
22-0.011226-0.09530.462187
23-0.085468-0.72520.235335
24-0.034668-0.29420.384736
25-0.023187-0.19680.422288
26-0.063577-0.53950.295615
270.0128760.10930.456651
28-0.087231-0.74020.2308
29-0.027276-0.23140.408813
30-0.010685-0.09070.464005
31-0.027776-0.23570.407172
32-0.086921-0.73750.231593
330.0075430.0640.474571
340.0145540.12350.45103
35-0.150732-1.2790.102501
360.0900390.7640.223681
370.016470.13970.444624
38-0.00431-0.03660.485463
39-0.069304-0.58810.279166
400.0548070.46510.321649
41-0.06557-0.55640.289838
42-0.019136-0.16240.435733
430.025170.21360.415743
440.0177340.15050.440403
45-0.036604-0.31060.378504
460.03090.26220.396961
470.0712770.60480.273605
48-0.05172-0.43890.331038


Parameters (Session):
par1 = 48 ; par2 = 1 ; par3 = 0 ; par4 = 0 ; par5 = 12 ;
Parameters (R input):
par1 = 48 ; par2 = 1 ; par3 = 0 ; par4 = 0 ; par5 = 12 ;
R code (references can be found in the software module):
if (par1 == 'Default') {
par1 = 10*log10(length(x))
} else {
par1 <- as.numeric(par1)
}
par2 <- as.numeric(par2)
par3 <- as.numeric(par3)
par4 <- as.numeric(par4)
par5 <- as.numeric(par5)
if (par2 == 0) {
x <- log(x)
} else {
x <- (x ^ par2 - 1) / par2
}
if (par3 > 0) x <- diff(x,lag=1,difference=par3)
if (par4 > 0) x <- diff(x,lag=par5,difference=par4)
bitmap(file='pic1.png')
racf <- acf(x,par1,main='Autocorrelation',xlab='lags',ylab='ACF')
dev.off()
bitmap(file='pic2.png')
rpacf <- pacf(x,par1,main='Partial Autocorrelation',xlab='lags',ylab='PACF')
dev.off()
(myacf <- c(racf$acf))
(mypacf <- c(rpacf$acf))
lengthx <- length(x)
sqrtn <- sqrt(lengthx)
load(file='createtable')
a<-table.start()
a<-table.row.start(a)
a<-table.element(a,'Autocorrelation Function',4,TRUE)
a<-table.row.end(a)
a<-table.row.start(a)
a<-table.element(a,'Time lag k',header=TRUE)
a<-table.element(a,hyperlink('basics.htm','ACF(k)','click here for more information about the Autocorrelation Function'),header=TRUE)
a<-table.element(a,'T-STAT',header=TRUE)
a<-table.element(a,'P-value',header=TRUE)
a<-table.row.end(a)
for (i in 2:(par1+1)) {
a<-table.row.start(a)
a<-table.element(a,i-1,header=TRUE)
a<-table.element(a,round(myacf[i],6))
mytstat <- myacf[i]*sqrtn
a<-table.element(a,round(mytstat,4))
a<-table.element(a,round(1-pt(abs(mytstat),lengthx),6))
a<-table.row.end(a)
}
a<-table.end(a)
table.save(a,file='mytable.tab')
a<-table.start()
a<-table.row.start(a)
a<-table.element(a,'Partial Autocorrelation Function',4,TRUE)
a<-table.row.end(a)
a<-table.row.start(a)
a<-table.element(a,'Time lag k',header=TRUE)
a<-table.element(a,hyperlink('basics.htm','PACF(k)','click here for more information about the Partial Autocorrelation Function'),header=TRUE)
a<-table.element(a,'T-STAT',header=TRUE)
a<-table.element(a,'P-value',header=TRUE)
a<-table.row.end(a)
for (i in 1:par1) {
a<-table.row.start(a)
a<-table.element(a,i,header=TRUE)
a<-table.element(a,round(mypacf[i],6))
mytstat <- mypacf[i]*sqrtn
a<-table.element(a,round(mytstat,4))
a<-table.element(a,round(1-pt(abs(mytstat),lengthx),6))
a<-table.row.end(a)
}
a<-table.end(a)
table.save(a,file='mytable1.tab')