Free Statistics

of Irreproducible Research!

Author's title

Author*Unverified author*
R Software Modulerwasp_smp.wasp
Title produced by softwareStandard Deviation-Mean Plot
Date of computationMon, 01 Jun 2009 15:30:08 -0600
Cite this page as followsStatistical Computations at FreeStatistics.org, Office for Research Development and Education, URL https://freestatistics.org/blog/index.php?v=date/2009/Jun/01/t1243891869jtjqhuewdbmc6aw.htm/, Retrieved Mon, 13 May 2024 15:06:20 +0000
Statistical Computations at FreeStatistics.org, Office for Research Development and Education, URL https://freestatistics.org/blog/index.php?pk=41117, Retrieved Mon, 13 May 2024 15:06:20 +0000
QR Codes:

Original text written by user:
IsPrivate?No (this computation is public)
User-defined keywordsMaandelijkse verkoop auto's
Estimated Impact129
Family? (F = Feedback message, R = changed R code, M = changed R Module, P = changed Parameters, D = changed Data)
-       [Standard Deviation-Mean Plot] [Nick Vermeulen St...] [2009-06-01 21:30:08] [2c8a5cc66f27790b8fc8930915f8068b] [Current]
- RMP     [Classical Decomposition] [Nick Vermeulen op...] [2009-06-01 21:44:12] [74be16979710d4c4e7c6647856088456]
Feedback Forum

Post a new message
Dataseries X:
14620
16005
16683
15487
15684
15962
12000
13769
14031
16078
15827
13149
15969
16628
16670
16487
16883
16201
12168
14010
16556
17404
16435
13123
16744
17410
16484
17103
17301
17301
12843
13748
16904
17342
15476
15424
15988
19244
18715
17780
17160
17349
11171
13438
16713
18369
17067
14055
15500
18475
19423
18686
19646
19733
12605
16616
19156
21348
20049
18020
20262
21789
20603
21928
21025
19346
11786
19082
20127
20217
20385
16653
13065
20275
21776
20260
22523
23033
14133
20110
19682
22197
17212
11784
15467
17002
15952
18767
20605
19809
14233
19311
20827
23388
20181
14344


Summary of computational transaction
Raw Inputview raw input (R code)
Raw Outputview raw output of R engine
Computing time1 seconds
R Server'George Udny Yule' @ 72.249.76.132

\begin{tabular}{lllllllll}
\hline
Summary of computational transaction \tabularnewline
Raw Input & view raw input (R code)  \tabularnewline
Raw Output & view raw output of R engine  \tabularnewline
Computing time & 1 seconds \tabularnewline
R Server & 'George Udny Yule' @ 72.249.76.132 \tabularnewline
\hline
\end{tabular}
%Source: https://freestatistics.org/blog/index.php?pk=41117&T=0

[TABLE]
[ROW][C]Summary of computational transaction[/C][/ROW]
[ROW][C]Raw Input[/C][C]view raw input (R code) [/C][/ROW]
[ROW][C]Raw Output[/C][C]view raw output of R engine [/C][/ROW]
[ROW][C]Computing time[/C][C]1 seconds[/C][/ROW]
[ROW][C]R Server[/C][C]'George Udny Yule' @ 72.249.76.132[/C][/ROW]
[/TABLE]
Source: https://freestatistics.org/blog/index.php?pk=41117&T=0

Globally Unique Identifier (entire table): ba.freestatistics.org/blog/index.php?pk=41117&T=0

As an alternative you can also use a QR Code:  

The GUIDs for individual cells are displayed in the table below:

Summary of computational transaction
Raw Inputview raw input (R code)
Raw Outputview raw output of R engine
Computing time1 seconds
R Server'George Udny Yule' @ 72.249.76.132


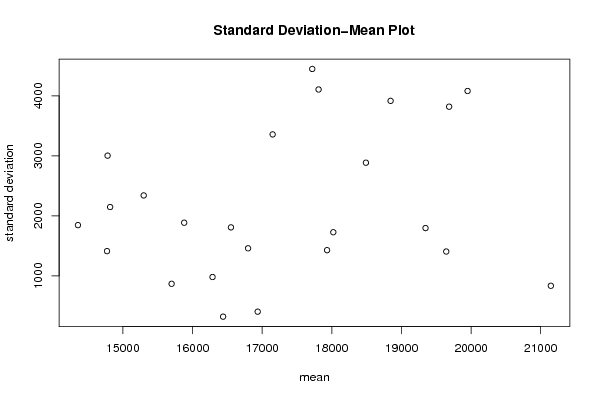
Standard Deviation-Mean Plot
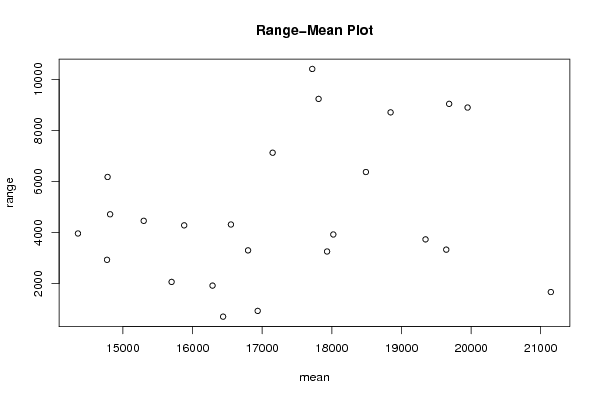
SectionMeanStandard DeviationRange
115698.75870.0721713359952063
214353.751847.349881136043962
314771.251414.433779526872929
416438.5322.637567558398701
514815.52148.817736958324715
615879.51887.557946130404281
716935.25405.680806381898926
815298.252341.903979671244458
916286.5982.548217646341918
1017931.751430.229905761073256
1114779.53004.99611757936178
12165511809.939225499024314
13180211729.102464671583923
14171503358.773883428307128
1519643.251407.498815866883328
1621145.5836.914372362351666
1717809.754106.989195262149239
1819345.51798.181581487253732
19188443917.749438984928711
2019949.754082.00550179288900
2117718.754449.2368914979910413
22167971461.260871074483300
2318489.52887.275243778006372
24196853820.500403524829044

\begin{tabular}{lllllllll}
\hline
Standard Deviation-Mean Plot \tabularnewline
Section & Mean & Standard Deviation & Range \tabularnewline
1 & 15698.75 & 870.072171335995 & 2063 \tabularnewline
2 & 14353.75 & 1847.34988113604 & 3962 \tabularnewline
3 & 14771.25 & 1414.43377952687 & 2929 \tabularnewline
4 & 16438.5 & 322.637567558398 & 701 \tabularnewline
5 & 14815.5 & 2148.81773695832 & 4715 \tabularnewline
6 & 15879.5 & 1887.55794613040 & 4281 \tabularnewline
7 & 16935.25 & 405.680806381898 & 926 \tabularnewline
8 & 15298.25 & 2341.90397967124 & 4458 \tabularnewline
9 & 16286.5 & 982.54821764634 & 1918 \tabularnewline
10 & 17931.75 & 1430.22990576107 & 3256 \tabularnewline
11 & 14779.5 & 3004.9961175793 & 6178 \tabularnewline
12 & 16551 & 1809.93922549902 & 4314 \tabularnewline
13 & 18021 & 1729.10246467158 & 3923 \tabularnewline
14 & 17150 & 3358.77388342830 & 7128 \tabularnewline
15 & 19643.25 & 1407.49881586688 & 3328 \tabularnewline
16 & 21145.5 & 836.91437236235 & 1666 \tabularnewline
17 & 17809.75 & 4106.98919526214 & 9239 \tabularnewline
18 & 19345.5 & 1798.18158148725 & 3732 \tabularnewline
19 & 18844 & 3917.74943898492 & 8711 \tabularnewline
20 & 19949.75 & 4082.0055017928 & 8900 \tabularnewline
21 & 17718.75 & 4449.23689149799 & 10413 \tabularnewline
22 & 16797 & 1461.26087107448 & 3300 \tabularnewline
23 & 18489.5 & 2887.27524377800 & 6372 \tabularnewline
24 & 19685 & 3820.50040352482 & 9044 \tabularnewline
\hline
\end{tabular}
%Source: https://freestatistics.org/blog/index.php?pk=41117&T=1

[TABLE]
[ROW][C]Standard Deviation-Mean Plot[/C][/ROW]
[ROW][C]Section[/C][C]Mean[/C][C]Standard Deviation[/C][C]Range[/C][/ROW]
[ROW][C]1[/C][C]15698.75[/C][C]870.072171335995[/C][C]2063[/C][/ROW]
[ROW][C]2[/C][C]14353.75[/C][C]1847.34988113604[/C][C]3962[/C][/ROW]
[ROW][C]3[/C][C]14771.25[/C][C]1414.43377952687[/C][C]2929[/C][/ROW]
[ROW][C]4[/C][C]16438.5[/C][C]322.637567558398[/C][C]701[/C][/ROW]
[ROW][C]5[/C][C]14815.5[/C][C]2148.81773695832[/C][C]4715[/C][/ROW]
[ROW][C]6[/C][C]15879.5[/C][C]1887.55794613040[/C][C]4281[/C][/ROW]
[ROW][C]7[/C][C]16935.25[/C][C]405.680806381898[/C][C]926[/C][/ROW]
[ROW][C]8[/C][C]15298.25[/C][C]2341.90397967124[/C][C]4458[/C][/ROW]
[ROW][C]9[/C][C]16286.5[/C][C]982.54821764634[/C][C]1918[/C][/ROW]
[ROW][C]10[/C][C]17931.75[/C][C]1430.22990576107[/C][C]3256[/C][/ROW]
[ROW][C]11[/C][C]14779.5[/C][C]3004.9961175793[/C][C]6178[/C][/ROW]
[ROW][C]12[/C][C]16551[/C][C]1809.93922549902[/C][C]4314[/C][/ROW]
[ROW][C]13[/C][C]18021[/C][C]1729.10246467158[/C][C]3923[/C][/ROW]
[ROW][C]14[/C][C]17150[/C][C]3358.77388342830[/C][C]7128[/C][/ROW]
[ROW][C]15[/C][C]19643.25[/C][C]1407.49881586688[/C][C]3328[/C][/ROW]
[ROW][C]16[/C][C]21145.5[/C][C]836.91437236235[/C][C]1666[/C][/ROW]
[ROW][C]17[/C][C]17809.75[/C][C]4106.98919526214[/C][C]9239[/C][/ROW]
[ROW][C]18[/C][C]19345.5[/C][C]1798.18158148725[/C][C]3732[/C][/ROW]
[ROW][C]19[/C][C]18844[/C][C]3917.74943898492[/C][C]8711[/C][/ROW]
[ROW][C]20[/C][C]19949.75[/C][C]4082.0055017928[/C][C]8900[/C][/ROW]
[ROW][C]21[/C][C]17718.75[/C][C]4449.23689149799[/C][C]10413[/C][/ROW]
[ROW][C]22[/C][C]16797[/C][C]1461.26087107448[/C][C]3300[/C][/ROW]
[ROW][C]23[/C][C]18489.5[/C][C]2887.27524377800[/C][C]6372[/C][/ROW]
[ROW][C]24[/C][C]19685[/C][C]3820.50040352482[/C][C]9044[/C][/ROW]
[/TABLE]
Source: https://freestatistics.org/blog/index.php?pk=41117&T=1

Globally Unique Identifier (entire table): ba.freestatistics.org/blog/index.php?pk=41117&T=1

As an alternative you can also use a QR Code:  

The GUIDs for individual cells are displayed in the table below:

Standard Deviation-Mean Plot
SectionMeanStandard DeviationRange
115698.75870.0721713359952063
214353.751847.349881136043962
314771.251414.433779526872929
416438.5322.637567558398701
514815.52148.817736958324715
615879.51887.557946130404281
716935.25405.680806381898926
815298.252341.903979671244458
916286.5982.548217646341918
1017931.751430.229905761073256
1114779.53004.99611757936178
12165511809.939225499024314
13180211729.102464671583923
14171503358.773883428307128
1519643.251407.498815866883328
1621145.5836.914372362351666
1717809.754106.989195262149239
1819345.51798.181581487253732
19188443917.749438984928711
2019949.754082.00550179288900
2117718.754449.2368914979910413
22167971461.260871074483300
2318489.52887.275243778006372
24196853820.500403524829044


Regression: S.E.(k) = alpha + beta * Mean(k)
alpha-557.687011515768
beta0.158580832520499
S.D.0.136393188603451
T-STAT1.16267413456808
p-value0.257419086231458

\begin{tabular}{lllllllll}
\hline
Regression: S.E.(k) = alpha + beta * Mean(k) \tabularnewline
alpha & -557.687011515768 \tabularnewline
beta & 0.158580832520499 \tabularnewline
S.D. & 0.136393188603451 \tabularnewline
T-STAT & 1.16267413456808 \tabularnewline
p-value & 0.257419086231458 \tabularnewline
\hline
\end{tabular}
%Source: https://freestatistics.org/blog/index.php?pk=41117&T=2

[TABLE]
[ROW][C]Regression: S.E.(k) = alpha + beta * Mean(k)[/C][/ROW]
[ROW][C]alpha[/C][C]-557.687011515768[/C][/ROW]
[ROW][C]beta[/C][C]0.158580832520499[/C][/ROW]
[ROW][C]S.D.[/C][C]0.136393188603451[/C][/ROW]
[ROW][C]T-STAT[/C][C]1.16267413456808[/C][/ROW]
[ROW][C]p-value[/C][C]0.257419086231458[/C][/ROW]
[/TABLE]
Source: https://freestatistics.org/blog/index.php?pk=41117&T=2

Globally Unique Identifier (entire table): ba.freestatistics.org/blog/index.php?pk=41117&T=2

As an alternative you can also use a QR Code:  

The GUIDs for individual cells are displayed in the table below:

Regression: S.E.(k) = alpha + beta * Mean(k)
alpha-557.687011515768
beta0.158580832520499
S.D.0.136393188603451
T-STAT1.16267413456808
p-value0.257419086231458


Regression: ln S.E.(k) = alpha + beta * ln Mean(k)
alpha-2.51082064394452
beta1.02593082922174
S.D.1.35326440780751
T-STAT0.758115578376807
p-value0.456426759425554
Lambda-0.0259308292217371

\begin{tabular}{lllllllll}
\hline
Regression: ln S.E.(k) = alpha + beta * ln Mean(k) \tabularnewline
alpha & -2.51082064394452 \tabularnewline
beta & 1.02593082922174 \tabularnewline
S.D. & 1.35326440780751 \tabularnewline
T-STAT & 0.758115578376807 \tabularnewline
p-value & 0.456426759425554 \tabularnewline
Lambda & -0.0259308292217371 \tabularnewline
\hline
\end{tabular}
%Source: https://freestatistics.org/blog/index.php?pk=41117&T=3

[TABLE]
[ROW][C]Regression: ln S.E.(k) = alpha + beta * ln Mean(k)[/C][/ROW]
[ROW][C]alpha[/C][C]-2.51082064394452[/C][/ROW]
[ROW][C]beta[/C][C]1.02593082922174[/C][/ROW]
[ROW][C]S.D.[/C][C]1.35326440780751[/C][/ROW]
[ROW][C]T-STAT[/C][C]0.758115578376807[/C][/ROW]
[ROW][C]p-value[/C][C]0.456426759425554[/C][/ROW]
[ROW][C]Lambda[/C][C]-0.0259308292217371[/C][/ROW]
[/TABLE]
Source: https://freestatistics.org/blog/index.php?pk=41117&T=3

Globally Unique Identifier (entire table): ba.freestatistics.org/blog/index.php?pk=41117&T=3

As an alternative you can also use a QR Code:  

The GUIDs for individual cells are displayed in the table below:

Regression: ln S.E.(k) = alpha + beta * ln Mean(k)
alpha-2.51082064394452
beta1.02593082922174
S.D.1.35326440780751
T-STAT0.758115578376807
p-value0.456426759425554
Lambda-0.0259308292217371


Parameters (Session):
par1 = Default ; par2 = 1 ; par3 = 0 ; par4 = 0 ; par5 = 12 ;
Parameters (R input):
par1 = 4 ;
R code (references can be found in the software module):
par1 <- as.numeric(par1)
(n <- length(x))
(np <- floor(n / par1))
arr <- array(NA,dim=c(par1,np))
j <- 0
k <- 1
for (i in 1:(np*par1))
{
j = j + 1
arr[j,k] <- x[i]
if (j == par1) {
j = 0
k=k+1
}
}
arr
arr.mean <- array(NA,dim=np)
arr.sd <- array(NA,dim=np)
arr.range <- array(NA,dim=np)
for (j in 1:np)
{
arr.mean[j] <- mean(arr[,j],na.rm=TRUE)
arr.sd[j] <- sd(arr[,j],na.rm=TRUE)
arr.range[j] <- max(arr[,j],na.rm=TRUE) - min(arr[,j],na.rm=TRUE)
}
arr.mean
arr.sd
arr.range
(lm1 <- lm(arr.sd~arr.mean))
(lnlm1 <- lm(log(arr.sd)~log(arr.mean)))
(lm2 <- lm(arr.range~arr.mean))
bitmap(file='test1.png')
plot(arr.mean,arr.sd,main='Standard Deviation-Mean Plot',xlab='mean',ylab='standard deviation')
dev.off()
bitmap(file='test2.png')
plot(arr.mean,arr.range,main='Range-Mean Plot',xlab='mean',ylab='range')
dev.off()
load(file='createtable')
a<-table.start()
a<-table.row.start(a)
a<-table.element(a,'Standard Deviation-Mean Plot',4,TRUE)
a<-table.row.end(a)
a<-table.row.start(a)
a<-table.element(a,'Section',header=TRUE)
a<-table.element(a,'Mean',header=TRUE)
a<-table.element(a,'Standard Deviation',header=TRUE)
a<-table.element(a,'Range',header=TRUE)
a<-table.row.end(a)
for (j in 1:np) {
a<-table.row.start(a)
a<-table.element(a,j,header=TRUE)
a<-table.element(a,arr.mean[j])
a<-table.element(a,arr.sd[j] )
a<-table.element(a,arr.range[j] )
a<-table.row.end(a)
}
a<-table.end(a)
table.save(a,file='mytable.tab')
a<-table.start()
a<-table.row.start(a)
a<-table.element(a,'Regression: S.E.(k) = alpha + beta * Mean(k)',2,TRUE)
a<-table.row.end(a)
a<-table.row.start(a)
a<-table.element(a,'alpha',header=TRUE)
a<-table.element(a,lm1$coefficients[[1]])
a<-table.row.end(a)
a<-table.row.start(a)
a<-table.element(a,'beta',header=TRUE)
a<-table.element(a,lm1$coefficients[[2]])
a<-table.row.end(a)
a<-table.row.start(a)
a<-table.element(a,'S.D.',header=TRUE)
a<-table.element(a,summary(lm1)$coefficients[2,2])
a<-table.row.end(a)
a<-table.row.start(a)
a<-table.element(a,'T-STAT',header=TRUE)
a<-table.element(a,summary(lm1)$coefficients[2,3])
a<-table.row.end(a)
a<-table.row.start(a)
a<-table.element(a,'p-value',header=TRUE)
a<-table.element(a,summary(lm1)$coefficients[2,4])
a<-table.row.end(a)
a<-table.end(a)
table.save(a,file='mytable1.tab')
a<-table.start()
a<-table.row.start(a)
a<-table.element(a,'Regression: ln S.E.(k) = alpha + beta * ln Mean(k)',2,TRUE)
a<-table.row.end(a)
a<-table.row.start(a)
a<-table.element(a,'alpha',header=TRUE)
a<-table.element(a,lnlm1$coefficients[[1]])
a<-table.row.end(a)
a<-table.row.start(a)
a<-table.element(a,'beta',header=TRUE)
a<-table.element(a,lnlm1$coefficients[[2]])
a<-table.row.end(a)
a<-table.row.start(a)
a<-table.element(a,'S.D.',header=TRUE)
a<-table.element(a,summary(lnlm1)$coefficients[2,2])
a<-table.row.end(a)
a<-table.row.start(a)
a<-table.element(a,'T-STAT',header=TRUE)
a<-table.element(a,summary(lnlm1)$coefficients[2,3])
a<-table.row.end(a)
a<-table.row.start(a)
a<-table.element(a,'p-value',header=TRUE)
a<-table.element(a,summary(lnlm1)$coefficients[2,4])
a<-table.row.end(a)
a<-table.row.start(a)
a<-table.element(a,'Lambda',header=TRUE)
a<-table.element(a,1-lnlm1$coefficients[[2]])
a<-table.row.end(a)
a<-table.end(a)
table.save(a,file='mytable2.tab')