Free Statistics

of Irreproducible Research!

Author's title

Author*Unverified author*
R Software Modulerwasp_smp.wasp
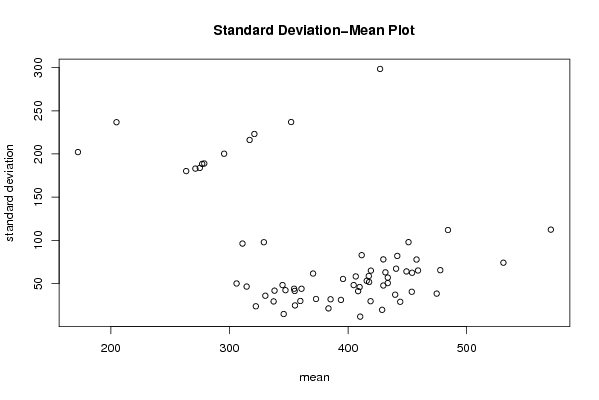
Title produced by softwareStandard Deviation-Mean Plot
Date of computationMon, 01 Jun 2009 15:20:47 -0600
Cite this page as followsStatistical Computations at FreeStatistics.org, Office for Research Development and Education, URL https://freestatistics.org/blog/index.php?v=date/2009/Jun/01/t12438913394jiuy1dq8ky6woa.htm/, Retrieved Mon, 13 May 2024 07:32:13 +0000
Statistical Computations at FreeStatistics.org, Office for Research Development and Education, URL https://freestatistics.org/blog/index.php?pk=41111, Retrieved Mon, 13 May 2024 07:32:13 +0000
QR Codes:

Original text written by user:
IsPrivate?No (this computation is public)
User-defined keywords
Estimated Impact100
Family? (F = Feedback message, R = changed R code, M = changed R Module, P = changed Parameters, D = changed Data)
-     [Standard Deviation-Mean Plot] [Wim gabriels opg8...] [2009-05-28 21:47:26] [74be16979710d4c4e7c6647856088456]
-    D    [Standard Deviation-Mean Plot] [Gabriels Wim OPG ...] [2009-06-01 21:20:47] [d41d8cd98f00b204e9800998ecf8427e] [Current]
-   P       [Standard Deviation-Mean Plot] [Gabriels wim OPG ...] [2009-06-01 21:25:10] [74be16979710d4c4e7c6647856088456]
Feedback Forum

Post a new message
Dataseries X:
374
572
402
589
507
628
698
451
694
0
488
526
343
494
447
0
470
366
517
483
485
530
308
481
437
468
502
408
479
436
410
451
344
411
0
427
454
365
499
416
430
470
325
452
442
488
446
523
594
439
588
503
444
525
375
472
436
458
514
0
472
360
450
549
361
466
387
457
470
396
471
422
404
414
342
459
379
0
410
319
411
371
365
429
333
392
469
432
534
379
436
448
358
492
387
529
475
439
459
361
0
0
394
425
341
455
403
471
523
389
531
468
398
446
355
435
353
0
400
332
389
355
384
406
356
336
351
278
265
229
387
435
317
490
472
440
429
350
489
494
436
436
375
429
0
434
472
362
440
433
400
442
316
432
401
434
488
377
484
377
0
0
300
389
337
376
377
331
339
356
280
249
196
268
379
401
404
397
419
421
407
296
468
475
422
456
339
446
419
346
327
326
403
359
358
421
322
367
394
356
418
344
372
358
373
379
0
348
369
341
390
279
325
354
346
358
296
356
337
360
474
362
440
443
435
429
341
434
329
416
430
307
408
322
0
324
303
369
328
258
372
298
376
306
359
418
311
355
335
345
318
291
340
0
356
419
296
361
371
392
383
286
362
358


Summary of computational transaction
Raw Inputview raw input (R code)
Raw Outputview raw output of R engine
Computing time1 seconds
R Server'Gwilym Jenkins' @ 72.249.127.135

\begin{tabular}{lllllllll}
\hline
Summary of computational transaction \tabularnewline
Raw Input & view raw input (R code)  \tabularnewline
Raw Output & view raw output of R engine  \tabularnewline
Computing time & 1 seconds \tabularnewline
R Server & 'Gwilym Jenkins' @ 72.249.127.135 \tabularnewline
\hline
\end{tabular}
%Source: https://freestatistics.org/blog/index.php?pk=41111&T=0

[TABLE]
[ROW][C]Summary of computational transaction[/C][/ROW]
[ROW][C]Raw Input[/C][C]view raw input (R code) [/C][/ROW]
[ROW][C]Raw Output[/C][C]view raw output of R engine [/C][/ROW]
[ROW][C]Computing time[/C][C]1 seconds[/C][/ROW]
[ROW][C]R Server[/C][C]'Gwilym Jenkins' @ 72.249.127.135[/C][/ROW]
[/TABLE]
Source: https://freestatistics.org/blog/index.php?pk=41111&T=0

Globally Unique Identifier (entire table): ba.freestatistics.org/blog/index.php?pk=41111&T=0

As an alternative you can also use a QR Code:  

The GUIDs for individual cells are displayed in the table below:

Summary of computational transaction
Raw Inputview raw input (R code)
Raw Outputview raw output of R engine
Computing time1 seconds
R Server'Gwilym Jenkins' @ 72.249.127.135


Standard Deviation-Mean Plot
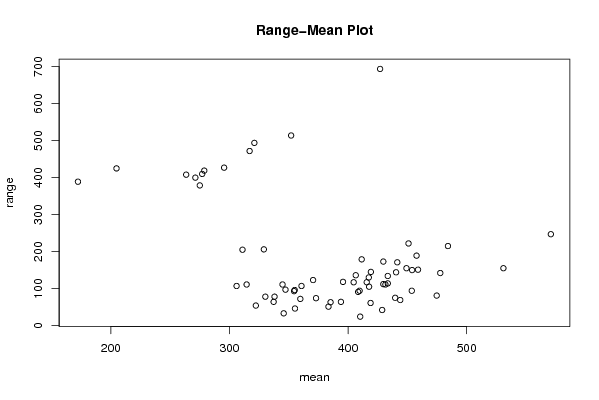
SectionMeanStandard DeviationRange
1484.25111.941577024208215
2571112.359541947565247
3427298.40688106454694
4321223.106850335588494
545965.0896817219647151
645197.8876907481222222
7453.7540.434102768166794
844428.832851633741269
9295.5200.254005369847427
10433.556.888780381841134
11419.2564.927523696298145
12474.7538.309050279709881
1353174.0855361502275155
1445462.4659907469657150
15352236.952878578562514
16457.7577.7704956908467189
17417.7551.7518115624951105
18439.7537.061885183208575
19404.7548.1897291961679117
20277188.490494897400410
2139431.005375877956064
22406.558.2208439192242136
23449.2564.0175757116747155
24441.581.9532386994763171
25433.550.5272203866391114
26204.75236.763419190268425
27417.558.6827629433607130
28477.7565.4592748712256142
29408.541.154181642533891
30271.25183.054409033671400
31383.521.205345238091951
32330.2535.855032189824378
3332997.802522121535206
34429.7577.9588566702548173
35440.567.1739036630545144
3641929.518355871107361
37317216.200524205347472
38428.7519.551214796017242
39395.7555.271300569705118
40431.562.9523629421486111
41172.25202.188649533054389
42355.2524.662724910277046
4330650.0466449091911107
4431196.260064408871205
45410.2511.644025649805724
46411.582.8351777125314179
47415.7553.118578043217117
48354.543.973476854425293
49385.2531.752952618614963
50359.7529.803523281652572
5137332.103997674225474
52275183.824191371357379
53344.7548.2104760399646111
54345.7514.705441169852733
55337.2529.27313899578764
56429.7547.710061831861112
57409.7545.908423337480694
58370.561.54943812362123
59263.5180.180465089865408
60314.546.4650406219558111
6133841.729286278743578
62360.7543.9270228143603107
63322.2523.627314701421354
64278.75188.936276735482419
6535541.400483088968996
66347.2542.279821822393497

\begin{tabular}{lllllllll}
\hline
Standard Deviation-Mean Plot \tabularnewline
Section & Mean & Standard Deviation & Range \tabularnewline
1 & 484.25 & 111.941577024208 & 215 \tabularnewline
2 & 571 & 112.359541947565 & 247 \tabularnewline
3 & 427 & 298.40688106454 & 694 \tabularnewline
4 & 321 & 223.106850335588 & 494 \tabularnewline
5 & 459 & 65.0896817219647 & 151 \tabularnewline
6 & 451 & 97.8876907481222 & 222 \tabularnewline
7 & 453.75 & 40.4341027681667 & 94 \tabularnewline
8 & 444 & 28.8328516337412 & 69 \tabularnewline
9 & 295.5 & 200.254005369847 & 427 \tabularnewline
10 & 433.5 & 56.888780381841 & 134 \tabularnewline
11 & 419.25 & 64.927523696298 & 145 \tabularnewline
12 & 474.75 & 38.3090502797098 & 81 \tabularnewline
13 & 531 & 74.0855361502275 & 155 \tabularnewline
14 & 454 & 62.4659907469657 & 150 \tabularnewline
15 & 352 & 236.952878578562 & 514 \tabularnewline
16 & 457.75 & 77.7704956908467 & 189 \tabularnewline
17 & 417.75 & 51.7518115624951 & 105 \tabularnewline
18 & 439.75 & 37.0618851832085 & 75 \tabularnewline
19 & 404.75 & 48.1897291961679 & 117 \tabularnewline
20 & 277 & 188.490494897400 & 410 \tabularnewline
21 & 394 & 31.0053758779560 & 64 \tabularnewline
22 & 406.5 & 58.2208439192242 & 136 \tabularnewline
23 & 449.25 & 64.0175757116747 & 155 \tabularnewline
24 & 441.5 & 81.9532386994763 & 171 \tabularnewline
25 & 433.5 & 50.5272203866391 & 114 \tabularnewline
26 & 204.75 & 236.763419190268 & 425 \tabularnewline
27 & 417.5 & 58.6827629433607 & 130 \tabularnewline
28 & 477.75 & 65.4592748712256 & 142 \tabularnewline
29 & 408.5 & 41.1541816425338 & 91 \tabularnewline
30 & 271.25 & 183.054409033671 & 400 \tabularnewline
31 & 383.5 & 21.2053452380919 & 51 \tabularnewline
32 & 330.25 & 35.8550321898243 & 78 \tabularnewline
33 & 329 & 97.802522121535 & 206 \tabularnewline
34 & 429.75 & 77.9588566702548 & 173 \tabularnewline
35 & 440.5 & 67.1739036630545 & 144 \tabularnewline
36 & 419 & 29.5183558711073 & 61 \tabularnewline
37 & 317 & 216.200524205347 & 472 \tabularnewline
38 & 428.75 & 19.5512147960172 & 42 \tabularnewline
39 & 395.75 & 55.271300569705 & 118 \tabularnewline
40 & 431.5 & 62.9523629421486 & 111 \tabularnewline
41 & 172.25 & 202.188649533054 & 389 \tabularnewline
42 & 355.25 & 24.6627249102770 & 46 \tabularnewline
43 & 306 & 50.0466449091911 & 107 \tabularnewline
44 & 311 & 96.260064408871 & 205 \tabularnewline
45 & 410.25 & 11.6440256498057 & 24 \tabularnewline
46 & 411.5 & 82.8351777125314 & 179 \tabularnewline
47 & 415.75 & 53.118578043217 & 117 \tabularnewline
48 & 354.5 & 43.9734768544252 & 93 \tabularnewline
49 & 385.25 & 31.7529526186149 & 63 \tabularnewline
50 & 359.75 & 29.8035232816525 & 72 \tabularnewline
51 & 373 & 32.1039976742254 & 74 \tabularnewline
52 & 275 & 183.824191371357 & 379 \tabularnewline
53 & 344.75 & 48.2104760399646 & 111 \tabularnewline
54 & 345.75 & 14.7054411698527 & 33 \tabularnewline
55 & 337.25 & 29.273138995787 & 64 \tabularnewline
56 & 429.75 & 47.710061831861 & 112 \tabularnewline
57 & 409.75 & 45.9084233374806 & 94 \tabularnewline
58 & 370.5 & 61.54943812362 & 123 \tabularnewline
59 & 263.5 & 180.180465089865 & 408 \tabularnewline
60 & 314.5 & 46.4650406219558 & 111 \tabularnewline
61 & 338 & 41.7292862787435 & 78 \tabularnewline
62 & 360.75 & 43.9270228143603 & 107 \tabularnewline
63 & 322.25 & 23.6273147014213 & 54 \tabularnewline
64 & 278.75 & 188.936276735482 & 419 \tabularnewline
65 & 355 & 41.4004830889689 & 96 \tabularnewline
66 & 347.25 & 42.2798218223934 & 97 \tabularnewline
\hline
\end{tabular}
%Source: https://freestatistics.org/blog/index.php?pk=41111&T=1

[TABLE]
[ROW][C]Standard Deviation-Mean Plot[/C][/ROW]
[ROW][C]Section[/C][C]Mean[/C][C]Standard Deviation[/C][C]Range[/C][/ROW]
[ROW][C]1[/C][C]484.25[/C][C]111.941577024208[/C][C]215[/C][/ROW]
[ROW][C]2[/C][C]571[/C][C]112.359541947565[/C][C]247[/C][/ROW]
[ROW][C]3[/C][C]427[/C][C]298.40688106454[/C][C]694[/C][/ROW]
[ROW][C]4[/C][C]321[/C][C]223.106850335588[/C][C]494[/C][/ROW]
[ROW][C]5[/C][C]459[/C][C]65.0896817219647[/C][C]151[/C][/ROW]
[ROW][C]6[/C][C]451[/C][C]97.8876907481222[/C][C]222[/C][/ROW]
[ROW][C]7[/C][C]453.75[/C][C]40.4341027681667[/C][C]94[/C][/ROW]
[ROW][C]8[/C][C]444[/C][C]28.8328516337412[/C][C]69[/C][/ROW]
[ROW][C]9[/C][C]295.5[/C][C]200.254005369847[/C][C]427[/C][/ROW]
[ROW][C]10[/C][C]433.5[/C][C]56.888780381841[/C][C]134[/C][/ROW]
[ROW][C]11[/C][C]419.25[/C][C]64.927523696298[/C][C]145[/C][/ROW]
[ROW][C]12[/C][C]474.75[/C][C]38.3090502797098[/C][C]81[/C][/ROW]
[ROW][C]13[/C][C]531[/C][C]74.0855361502275[/C][C]155[/C][/ROW]
[ROW][C]14[/C][C]454[/C][C]62.4659907469657[/C][C]150[/C][/ROW]
[ROW][C]15[/C][C]352[/C][C]236.952878578562[/C][C]514[/C][/ROW]
[ROW][C]16[/C][C]457.75[/C][C]77.7704956908467[/C][C]189[/C][/ROW]
[ROW][C]17[/C][C]417.75[/C][C]51.7518115624951[/C][C]105[/C][/ROW]
[ROW][C]18[/C][C]439.75[/C][C]37.0618851832085[/C][C]75[/C][/ROW]
[ROW][C]19[/C][C]404.75[/C][C]48.1897291961679[/C][C]117[/C][/ROW]
[ROW][C]20[/C][C]277[/C][C]188.490494897400[/C][C]410[/C][/ROW]
[ROW][C]21[/C][C]394[/C][C]31.0053758779560[/C][C]64[/C][/ROW]
[ROW][C]22[/C][C]406.5[/C][C]58.2208439192242[/C][C]136[/C][/ROW]
[ROW][C]23[/C][C]449.25[/C][C]64.0175757116747[/C][C]155[/C][/ROW]
[ROW][C]24[/C][C]441.5[/C][C]81.9532386994763[/C][C]171[/C][/ROW]
[ROW][C]25[/C][C]433.5[/C][C]50.5272203866391[/C][C]114[/C][/ROW]
[ROW][C]26[/C][C]204.75[/C][C]236.763419190268[/C][C]425[/C][/ROW]
[ROW][C]27[/C][C]417.5[/C][C]58.6827629433607[/C][C]130[/C][/ROW]
[ROW][C]28[/C][C]477.75[/C][C]65.4592748712256[/C][C]142[/C][/ROW]
[ROW][C]29[/C][C]408.5[/C][C]41.1541816425338[/C][C]91[/C][/ROW]
[ROW][C]30[/C][C]271.25[/C][C]183.054409033671[/C][C]400[/C][/ROW]
[ROW][C]31[/C][C]383.5[/C][C]21.2053452380919[/C][C]51[/C][/ROW]
[ROW][C]32[/C][C]330.25[/C][C]35.8550321898243[/C][C]78[/C][/ROW]
[ROW][C]33[/C][C]329[/C][C]97.802522121535[/C][C]206[/C][/ROW]
[ROW][C]34[/C][C]429.75[/C][C]77.9588566702548[/C][C]173[/C][/ROW]
[ROW][C]35[/C][C]440.5[/C][C]67.1739036630545[/C][C]144[/C][/ROW]
[ROW][C]36[/C][C]419[/C][C]29.5183558711073[/C][C]61[/C][/ROW]
[ROW][C]37[/C][C]317[/C][C]216.200524205347[/C][C]472[/C][/ROW]
[ROW][C]38[/C][C]428.75[/C][C]19.5512147960172[/C][C]42[/C][/ROW]
[ROW][C]39[/C][C]395.75[/C][C]55.271300569705[/C][C]118[/C][/ROW]
[ROW][C]40[/C][C]431.5[/C][C]62.9523629421486[/C][C]111[/C][/ROW]
[ROW][C]41[/C][C]172.25[/C][C]202.188649533054[/C][C]389[/C][/ROW]
[ROW][C]42[/C][C]355.25[/C][C]24.6627249102770[/C][C]46[/C][/ROW]
[ROW][C]43[/C][C]306[/C][C]50.0466449091911[/C][C]107[/C][/ROW]
[ROW][C]44[/C][C]311[/C][C]96.260064408871[/C][C]205[/C][/ROW]
[ROW][C]45[/C][C]410.25[/C][C]11.6440256498057[/C][C]24[/C][/ROW]
[ROW][C]46[/C][C]411.5[/C][C]82.8351777125314[/C][C]179[/C][/ROW]
[ROW][C]47[/C][C]415.75[/C][C]53.118578043217[/C][C]117[/C][/ROW]
[ROW][C]48[/C][C]354.5[/C][C]43.9734768544252[/C][C]93[/C][/ROW]
[ROW][C]49[/C][C]385.25[/C][C]31.7529526186149[/C][C]63[/C][/ROW]
[ROW][C]50[/C][C]359.75[/C][C]29.8035232816525[/C][C]72[/C][/ROW]
[ROW][C]51[/C][C]373[/C][C]32.1039976742254[/C][C]74[/C][/ROW]
[ROW][C]52[/C][C]275[/C][C]183.824191371357[/C][C]379[/C][/ROW]
[ROW][C]53[/C][C]344.75[/C][C]48.2104760399646[/C][C]111[/C][/ROW]
[ROW][C]54[/C][C]345.75[/C][C]14.7054411698527[/C][C]33[/C][/ROW]
[ROW][C]55[/C][C]337.25[/C][C]29.273138995787[/C][C]64[/C][/ROW]
[ROW][C]56[/C][C]429.75[/C][C]47.710061831861[/C][C]112[/C][/ROW]
[ROW][C]57[/C][C]409.75[/C][C]45.9084233374806[/C][C]94[/C][/ROW]
[ROW][C]58[/C][C]370.5[/C][C]61.54943812362[/C][C]123[/C][/ROW]
[ROW][C]59[/C][C]263.5[/C][C]180.180465089865[/C][C]408[/C][/ROW]
[ROW][C]60[/C][C]314.5[/C][C]46.4650406219558[/C][C]111[/C][/ROW]
[ROW][C]61[/C][C]338[/C][C]41.7292862787435[/C][C]78[/C][/ROW]
[ROW][C]62[/C][C]360.75[/C][C]43.9270228143603[/C][C]107[/C][/ROW]
[ROW][C]63[/C][C]322.25[/C][C]23.6273147014213[/C][C]54[/C][/ROW]
[ROW][C]64[/C][C]278.75[/C][C]188.936276735482[/C][C]419[/C][/ROW]
[ROW][C]65[/C][C]355[/C][C]41.4004830889689[/C][C]96[/C][/ROW]
[ROW][C]66[/C][C]347.25[/C][C]42.2798218223934[/C][C]97[/C][/ROW]
[/TABLE]
Source: https://freestatistics.org/blog/index.php?pk=41111&T=1

Globally Unique Identifier (entire table): ba.freestatistics.org/blog/index.php?pk=41111&T=1

As an alternative you can also use a QR Code:  

The GUIDs for individual cells are displayed in the table below:

Standard Deviation-Mean Plot
SectionMeanStandard DeviationRange
1484.25111.941577024208215
2571112.359541947565247
3427298.40688106454694
4321223.106850335588494
545965.0896817219647151
645197.8876907481222222
7453.7540.434102768166794
844428.832851633741269
9295.5200.254005369847427
10433.556.888780381841134
11419.2564.927523696298145
12474.7538.309050279709881
1353174.0855361502275155
1445462.4659907469657150
15352236.952878578562514
16457.7577.7704956908467189
17417.7551.7518115624951105
18439.7537.061885183208575
19404.7548.1897291961679117
20277188.490494897400410
2139431.005375877956064
22406.558.2208439192242136
23449.2564.0175757116747155
24441.581.9532386994763171
25433.550.5272203866391114
26204.75236.763419190268425
27417.558.6827629433607130
28477.7565.4592748712256142
29408.541.154181642533891
30271.25183.054409033671400
31383.521.205345238091951
32330.2535.855032189824378
3332997.802522121535206
34429.7577.9588566702548173
35440.567.1739036630545144
3641929.518355871107361
37317216.200524205347472
38428.7519.551214796017242
39395.7555.271300569705118
40431.562.9523629421486111
41172.25202.188649533054389
42355.2524.662724910277046
4330650.0466449091911107
4431196.260064408871205
45410.2511.644025649805724
46411.582.8351777125314179
47415.7553.118578043217117
48354.543.973476854425293
49385.2531.752952618614963
50359.7529.803523281652572
5137332.103997674225474
52275183.824191371357379
53344.7548.2104760399646111
54345.7514.705441169852733
55337.2529.27313899578764
56429.7547.710061831861112
57409.7545.908423337480694
58370.561.54943812362123
59263.5180.180465089865408
60314.546.4650406219558111
6133841.729286278743578
62360.7543.9270228143603107
63322.2523.627314701421354
64278.75188.936276735482419
6535541.400483088968996
66347.2542.279821822393497


Regression: S.E.(k) = alpha + beta * Mean(k)
alpha234.681859811378
beta-0.399662423929611
S.D.0.103262934165410
T-STAT-3.87033766917197
p-value0.000257507964508326

\begin{tabular}{lllllllll}
\hline
Regression: S.E.(k) = alpha + beta * Mean(k) \tabularnewline
alpha & 234.681859811378 \tabularnewline
beta & -0.399662423929611 \tabularnewline
S.D. & 0.103262934165410 \tabularnewline
T-STAT & -3.87033766917197 \tabularnewline
p-value & 0.000257507964508326 \tabularnewline
\hline
\end{tabular}
%Source: https://freestatistics.org/blog/index.php?pk=41111&T=2

[TABLE]
[ROW][C]Regression: S.E.(k) = alpha + beta * Mean(k)[/C][/ROW]
[ROW][C]alpha[/C][C]234.681859811378[/C][/ROW]
[ROW][C]beta[/C][C]-0.399662423929611[/C][/ROW]
[ROW][C]S.D.[/C][C]0.103262934165410[/C][/ROW]
[ROW][C]T-STAT[/C][C]-3.87033766917197[/C][/ROW]
[ROW][C]p-value[/C][C]0.000257507964508326[/C][/ROW]
[/TABLE]
Source: https://freestatistics.org/blog/index.php?pk=41111&T=2

Globally Unique Identifier (entire table): ba.freestatistics.org/blog/index.php?pk=41111&T=2

As an alternative you can also use a QR Code:  

The GUIDs for individual cells are displayed in the table below:

Regression: S.E.(k) = alpha + beta * Mean(k)
alpha234.681859811378
beta-0.399662423929611
S.D.0.103262934165410
T-STAT-3.87033766917197
p-value0.000257507964508326


Regression: ln S.E.(k) = alpha + beta * ln Mean(k)
alpha11.9547475365925
beta-1.32080499957957
S.D.0.403679547919036
T-STAT-3.27191458271369
p-value0.00172359655188862
Lambda2.32080499957957

\begin{tabular}{lllllllll}
\hline
Regression: ln S.E.(k) = alpha + beta * ln Mean(k) \tabularnewline
alpha & 11.9547475365925 \tabularnewline
beta & -1.32080499957957 \tabularnewline
S.D. & 0.403679547919036 \tabularnewline
T-STAT & -3.27191458271369 \tabularnewline
p-value & 0.00172359655188862 \tabularnewline
Lambda & 2.32080499957957 \tabularnewline
\hline
\end{tabular}
%Source: https://freestatistics.org/blog/index.php?pk=41111&T=3

[TABLE]
[ROW][C]Regression: ln S.E.(k) = alpha + beta * ln Mean(k)[/C][/ROW]
[ROW][C]alpha[/C][C]11.9547475365925[/C][/ROW]
[ROW][C]beta[/C][C]-1.32080499957957[/C][/ROW]
[ROW][C]S.D.[/C][C]0.403679547919036[/C][/ROW]
[ROW][C]T-STAT[/C][C]-3.27191458271369[/C][/ROW]
[ROW][C]p-value[/C][C]0.00172359655188862[/C][/ROW]
[ROW][C]Lambda[/C][C]2.32080499957957[/C][/ROW]
[/TABLE]
Source: https://freestatistics.org/blog/index.php?pk=41111&T=3

Globally Unique Identifier (entire table): ba.freestatistics.org/blog/index.php?pk=41111&T=3

As an alternative you can also use a QR Code:  

The GUIDs for individual cells are displayed in the table below:

Regression: ln S.E.(k) = alpha + beta * ln Mean(k)
alpha11.9547475365925
beta-1.32080499957957
S.D.0.403679547919036
T-STAT-3.27191458271369
p-value0.00172359655188862
Lambda2.32080499957957


Parameters (Session):
par1 = 4 ;
Parameters (R input):
par1 = 4 ;
R code (references can be found in the software module):
par1 <- as.numeric(par1)
(n <- length(x))
(np <- floor(n / par1))
arr <- array(NA,dim=c(par1,np))
j <- 0
k <- 1
for (i in 1:(np*par1))
{
j = j + 1
arr[j,k] <- x[i]
if (j == par1) {
j = 0
k=k+1
}
}
arr
arr.mean <- array(NA,dim=np)
arr.sd <- array(NA,dim=np)
arr.range <- array(NA,dim=np)
for (j in 1:np)
{
arr.mean[j] <- mean(arr[,j],na.rm=TRUE)
arr.sd[j] <- sd(arr[,j],na.rm=TRUE)
arr.range[j] <- max(arr[,j],na.rm=TRUE) - min(arr[,j],na.rm=TRUE)
}
arr.mean
arr.sd
arr.range
(lm1 <- lm(arr.sd~arr.mean))
(lnlm1 <- lm(log(arr.sd)~log(arr.mean)))
(lm2 <- lm(arr.range~arr.mean))
bitmap(file='test1.png')
plot(arr.mean,arr.sd,main='Standard Deviation-Mean Plot',xlab='mean',ylab='standard deviation')
dev.off()
bitmap(file='test2.png')
plot(arr.mean,arr.range,main='Range-Mean Plot',xlab='mean',ylab='range')
dev.off()
load(file='createtable')
a<-table.start()
a<-table.row.start(a)
a<-table.element(a,'Standard Deviation-Mean Plot',4,TRUE)
a<-table.row.end(a)
a<-table.row.start(a)
a<-table.element(a,'Section',header=TRUE)
a<-table.element(a,'Mean',header=TRUE)
a<-table.element(a,'Standard Deviation',header=TRUE)
a<-table.element(a,'Range',header=TRUE)
a<-table.row.end(a)
for (j in 1:np) {
a<-table.row.start(a)
a<-table.element(a,j,header=TRUE)
a<-table.element(a,arr.mean[j])
a<-table.element(a,arr.sd[j] )
a<-table.element(a,arr.range[j] )
a<-table.row.end(a)
}
a<-table.end(a)
table.save(a,file='mytable.tab')
a<-table.start()
a<-table.row.start(a)
a<-table.element(a,'Regression: S.E.(k) = alpha + beta * Mean(k)',2,TRUE)
a<-table.row.end(a)
a<-table.row.start(a)
a<-table.element(a,'alpha',header=TRUE)
a<-table.element(a,lm1$coefficients[[1]])
a<-table.row.end(a)
a<-table.row.start(a)
a<-table.element(a,'beta',header=TRUE)
a<-table.element(a,lm1$coefficients[[2]])
a<-table.row.end(a)
a<-table.row.start(a)
a<-table.element(a,'S.D.',header=TRUE)
a<-table.element(a,summary(lm1)$coefficients[2,2])
a<-table.row.end(a)
a<-table.row.start(a)
a<-table.element(a,'T-STAT',header=TRUE)
a<-table.element(a,summary(lm1)$coefficients[2,3])
a<-table.row.end(a)
a<-table.row.start(a)
a<-table.element(a,'p-value',header=TRUE)
a<-table.element(a,summary(lm1)$coefficients[2,4])
a<-table.row.end(a)
a<-table.end(a)
table.save(a,file='mytable1.tab')
a<-table.start()
a<-table.row.start(a)
a<-table.element(a,'Regression: ln S.E.(k) = alpha + beta * ln Mean(k)',2,TRUE)
a<-table.row.end(a)
a<-table.row.start(a)
a<-table.element(a,'alpha',header=TRUE)
a<-table.element(a,lnlm1$coefficients[[1]])
a<-table.row.end(a)
a<-table.row.start(a)
a<-table.element(a,'beta',header=TRUE)
a<-table.element(a,lnlm1$coefficients[[2]])
a<-table.row.end(a)
a<-table.row.start(a)
a<-table.element(a,'S.D.',header=TRUE)
a<-table.element(a,summary(lnlm1)$coefficients[2,2])
a<-table.row.end(a)
a<-table.row.start(a)
a<-table.element(a,'T-STAT',header=TRUE)
a<-table.element(a,summary(lnlm1)$coefficients[2,3])
a<-table.row.end(a)
a<-table.row.start(a)
a<-table.element(a,'p-value',header=TRUE)
a<-table.element(a,summary(lnlm1)$coefficients[2,4])
a<-table.row.end(a)
a<-table.row.start(a)
a<-table.element(a,'Lambda',header=TRUE)
a<-table.element(a,1-lnlm1$coefficients[[2]])
a<-table.row.end(a)
a<-table.end(a)
table.save(a,file='mytable2.tab')