Free Statistics

of Irreproducible Research!

Author's title

Author*Unverified author*
R Software Modulerwasp_autocorrelation.wasp
Title produced by software(Partial) Autocorrelation Function
Date of computationMon, 01 Jun 2009 14:31:47 -0600
Cite this page as followsStatistical Computations at FreeStatistics.org, Office for Research Development and Education, URL https://freestatistics.org/blog/index.php?v=date/2009/Jun/01/t1243888399q3ruws902itz17c.htm/, Retrieved Mon, 13 May 2024 13:47:09 +0000
Statistical Computations at FreeStatistics.org, Office for Research Development and Education, URL https://freestatistics.org/blog/index.php?pk=41085, Retrieved Mon, 13 May 2024 13:47:09 +0000
QR Codes:

Original text written by user:
IsPrivate?No (this computation is public)
User-defined keywordsMaandelijkse verkopen auto's
Estimated Impact106
Family? (F = Feedback message, R = changed R code, M = changed R Module, P = changed Parameters, D = changed Data)
-       [(Partial) Autocorrelation Function] [Nick Vermeulen Au...] [2009-06-01 20:31:47] [2c8a5cc66f27790b8fc8930915f8068b] [Current]
Feedback Forum

Post a new message
Dataseries X:
14620
16005
16683
15487
15684
15962
12000
13769
14031
16078
15827
13149
15969
16628
16670
16487
16883
16201
12168
14010
16556
17404
16435
13123
16744
17410
16484
17103
17301
17301
12843
13748
16904
17342
15476
15424
15988
19244
18715
17780
17160
17349
11171
13438
16713
18369
17067
14055
15500
18475
19423
18686
19646
19733
12605
16616
19156
21348
20049
18020
20262
21789
20603
21928
21025
19346
11786
19082
20127
20217
20385
16653
13065
20275
21776
20260
22523
23033
14133
20110
19682
22197
17212
11784
15467
17002
15952
18767
20605
19809
14233
19311
20827
23388
20181
14344


Summary of computational transaction
Raw Inputview raw input (R code)
Raw Outputview raw output of R engine
Computing time2 seconds
R Server'Sir Ronald Aylmer Fisher' @ 193.190.124.24

\begin{tabular}{lllllllll}
\hline
Summary of computational transaction \tabularnewline
Raw Input & view raw input (R code)  \tabularnewline
Raw Output & view raw output of R engine  \tabularnewline
Computing time & 2 seconds \tabularnewline
R Server & 'Sir Ronald Aylmer Fisher' @ 193.190.124.24 \tabularnewline
\hline
\end{tabular}
%Source: https://freestatistics.org/blog/index.php?pk=41085&T=0

[TABLE]
[ROW][C]Summary of computational transaction[/C][/ROW]
[ROW][C]Raw Input[/C][C]view raw input (R code) [/C][/ROW]
[ROW][C]Raw Output[/C][C]view raw output of R engine [/C][/ROW]
[ROW][C]Computing time[/C][C]2 seconds[/C][/ROW]
[ROW][C]R Server[/C][C]'Sir Ronald Aylmer Fisher' @ 193.190.124.24[/C][/ROW]
[/TABLE]
Source: https://freestatistics.org/blog/index.php?pk=41085&T=0

Globally Unique Identifier (entire table): ba.freestatistics.org/blog/index.php?pk=41085&T=0

As an alternative you can also use a QR Code:  

The GUIDs for individual cells are displayed in the table below:

Summary of computational transaction
Raw Inputview raw input (R code)
Raw Outputview raw output of R engine
Computing time2 seconds
R Server'Sir Ronald Aylmer Fisher' @ 193.190.124.24


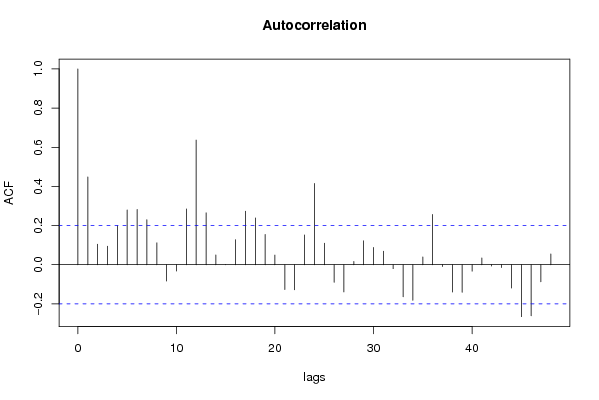
Autocorrelation Function
Time lag kACF(k)T-STATP-value
10.4480574.391.5e-05
20.1052671.03140.152472
30.09440.92490.178662
40.1993641.95340.026844
50.2794862.73840.00368
60.2823892.76680.003395
70.2298412.2520.013301
80.1117881.09530.138064
9-0.083025-0.81350.20898
10-0.032541-0.31880.375273
110.2844422.7870.003207
120.6366366.23770
130.2649222.59570.005461
140.0499560.48950.312813
15-0.000527-0.00520.497947
160.1281041.25520.106235
170.2736762.68150.004315
180.2386082.33790.010735
190.154981.51850.066089
200.049270.48270.315187
21-0.126708-1.24150.108726
22-0.127984-1.2540.106446
230.1519731.4890.06988
240.4149364.06554.9e-05
250.1095831.07370.142826
26-0.089495-0.87690.191373
27-0.138838-1.36030.088455
280.0162570.15930.436891
290.1219651.1950.117514
300.0879780.8620.195417
310.0686650.67280.251353
32-0.019892-0.19490.422941
33-0.163323-1.60020.056417
34-0.181194-1.77530.039506
350.0395760.38780.349526
360.2567742.51590.006767
37-0.009585-0.09390.462688
38-0.139068-1.36260.088101
39-0.140739-1.3790.085557
40-0.032881-0.32220.374014
410.0341550.33460.369312
42-0.006244-0.06120.475674
43-0.014732-0.14430.442767
44-0.118819-1.16420.123618
45-0.265157-2.5980.005427
46-0.260567-2.5530.006127
47-0.08732-0.85560.197185
480.0552670.54150.294708

\begin{tabular}{lllllllll}
\hline
Autocorrelation Function \tabularnewline
Time lag k & ACF(k) & T-STAT & P-value \tabularnewline
1 & 0.448057 & 4.39 & 1.5e-05 \tabularnewline
2 & 0.105267 & 1.0314 & 0.152472 \tabularnewline
3 & 0.0944 & 0.9249 & 0.178662 \tabularnewline
4 & 0.199364 & 1.9534 & 0.026844 \tabularnewline
5 & 0.279486 & 2.7384 & 0.00368 \tabularnewline
6 & 0.282389 & 2.7668 & 0.003395 \tabularnewline
7 & 0.229841 & 2.252 & 0.013301 \tabularnewline
8 & 0.111788 & 1.0953 & 0.138064 \tabularnewline
9 & -0.083025 & -0.8135 & 0.20898 \tabularnewline
10 & -0.032541 & -0.3188 & 0.375273 \tabularnewline
11 & 0.284442 & 2.787 & 0.003207 \tabularnewline
12 & 0.636636 & 6.2377 & 0 \tabularnewline
13 & 0.264922 & 2.5957 & 0.005461 \tabularnewline
14 & 0.049956 & 0.4895 & 0.312813 \tabularnewline
15 & -0.000527 & -0.0052 & 0.497947 \tabularnewline
16 & 0.128104 & 1.2552 & 0.106235 \tabularnewline
17 & 0.273676 & 2.6815 & 0.004315 \tabularnewline
18 & 0.238608 & 2.3379 & 0.010735 \tabularnewline
19 & 0.15498 & 1.5185 & 0.066089 \tabularnewline
20 & 0.04927 & 0.4827 & 0.315187 \tabularnewline
21 & -0.126708 & -1.2415 & 0.108726 \tabularnewline
22 & -0.127984 & -1.254 & 0.106446 \tabularnewline
23 & 0.151973 & 1.489 & 0.06988 \tabularnewline
24 & 0.414936 & 4.0655 & 4.9e-05 \tabularnewline
25 & 0.109583 & 1.0737 & 0.142826 \tabularnewline
26 & -0.089495 & -0.8769 & 0.191373 \tabularnewline
27 & -0.138838 & -1.3603 & 0.088455 \tabularnewline
28 & 0.016257 & 0.1593 & 0.436891 \tabularnewline
29 & 0.121965 & 1.195 & 0.117514 \tabularnewline
30 & 0.087978 & 0.862 & 0.195417 \tabularnewline
31 & 0.068665 & 0.6728 & 0.251353 \tabularnewline
32 & -0.019892 & -0.1949 & 0.422941 \tabularnewline
33 & -0.163323 & -1.6002 & 0.056417 \tabularnewline
34 & -0.181194 & -1.7753 & 0.039506 \tabularnewline
35 & 0.039576 & 0.3878 & 0.349526 \tabularnewline
36 & 0.256774 & 2.5159 & 0.006767 \tabularnewline
37 & -0.009585 & -0.0939 & 0.462688 \tabularnewline
38 & -0.139068 & -1.3626 & 0.088101 \tabularnewline
39 & -0.140739 & -1.379 & 0.085557 \tabularnewline
40 & -0.032881 & -0.3222 & 0.374014 \tabularnewline
41 & 0.034155 & 0.3346 & 0.369312 \tabularnewline
42 & -0.006244 & -0.0612 & 0.475674 \tabularnewline
43 & -0.014732 & -0.1443 & 0.442767 \tabularnewline
44 & -0.118819 & -1.1642 & 0.123618 \tabularnewline
45 & -0.265157 & -2.598 & 0.005427 \tabularnewline
46 & -0.260567 & -2.553 & 0.006127 \tabularnewline
47 & -0.08732 & -0.8556 & 0.197185 \tabularnewline
48 & 0.055267 & 0.5415 & 0.294708 \tabularnewline
\hline
\end{tabular}
%Source: https://freestatistics.org/blog/index.php?pk=41085&T=1

[TABLE]
[ROW][C]Autocorrelation Function[/C][/ROW]
[ROW][C]Time lag k[/C][C]ACF(k)[/C][C]T-STAT[/C][C]P-value[/C][/ROW]
[ROW][C]1[/C][C]0.448057[/C][C]4.39[/C][C]1.5e-05[/C][/ROW]
[ROW][C]2[/C][C]0.105267[/C][C]1.0314[/C][C]0.152472[/C][/ROW]
[ROW][C]3[/C][C]0.0944[/C][C]0.9249[/C][C]0.178662[/C][/ROW]
[ROW][C]4[/C][C]0.199364[/C][C]1.9534[/C][C]0.026844[/C][/ROW]
[ROW][C]5[/C][C]0.279486[/C][C]2.7384[/C][C]0.00368[/C][/ROW]
[ROW][C]6[/C][C]0.282389[/C][C]2.7668[/C][C]0.003395[/C][/ROW]
[ROW][C]7[/C][C]0.229841[/C][C]2.252[/C][C]0.013301[/C][/ROW]
[ROW][C]8[/C][C]0.111788[/C][C]1.0953[/C][C]0.138064[/C][/ROW]
[ROW][C]9[/C][C]-0.083025[/C][C]-0.8135[/C][C]0.20898[/C][/ROW]
[ROW][C]10[/C][C]-0.032541[/C][C]-0.3188[/C][C]0.375273[/C][/ROW]
[ROW][C]11[/C][C]0.284442[/C][C]2.787[/C][C]0.003207[/C][/ROW]
[ROW][C]12[/C][C]0.636636[/C][C]6.2377[/C][C]0[/C][/ROW]
[ROW][C]13[/C][C]0.264922[/C][C]2.5957[/C][C]0.005461[/C][/ROW]
[ROW][C]14[/C][C]0.049956[/C][C]0.4895[/C][C]0.312813[/C][/ROW]
[ROW][C]15[/C][C]-0.000527[/C][C]-0.0052[/C][C]0.497947[/C][/ROW]
[ROW][C]16[/C][C]0.128104[/C][C]1.2552[/C][C]0.106235[/C][/ROW]
[ROW][C]17[/C][C]0.273676[/C][C]2.6815[/C][C]0.004315[/C][/ROW]
[ROW][C]18[/C][C]0.238608[/C][C]2.3379[/C][C]0.010735[/C][/ROW]
[ROW][C]19[/C][C]0.15498[/C][C]1.5185[/C][C]0.066089[/C][/ROW]
[ROW][C]20[/C][C]0.04927[/C][C]0.4827[/C][C]0.315187[/C][/ROW]
[ROW][C]21[/C][C]-0.126708[/C][C]-1.2415[/C][C]0.108726[/C][/ROW]
[ROW][C]22[/C][C]-0.127984[/C][C]-1.254[/C][C]0.106446[/C][/ROW]
[ROW][C]23[/C][C]0.151973[/C][C]1.489[/C][C]0.06988[/C][/ROW]
[ROW][C]24[/C][C]0.414936[/C][C]4.0655[/C][C]4.9e-05[/C][/ROW]
[ROW][C]25[/C][C]0.109583[/C][C]1.0737[/C][C]0.142826[/C][/ROW]
[ROW][C]26[/C][C]-0.089495[/C][C]-0.8769[/C][C]0.191373[/C][/ROW]
[ROW][C]27[/C][C]-0.138838[/C][C]-1.3603[/C][C]0.088455[/C][/ROW]
[ROW][C]28[/C][C]0.016257[/C][C]0.1593[/C][C]0.436891[/C][/ROW]
[ROW][C]29[/C][C]0.121965[/C][C]1.195[/C][C]0.117514[/C][/ROW]
[ROW][C]30[/C][C]0.087978[/C][C]0.862[/C][C]0.195417[/C][/ROW]
[ROW][C]31[/C][C]0.068665[/C][C]0.6728[/C][C]0.251353[/C][/ROW]
[ROW][C]32[/C][C]-0.019892[/C][C]-0.1949[/C][C]0.422941[/C][/ROW]
[ROW][C]33[/C][C]-0.163323[/C][C]-1.6002[/C][C]0.056417[/C][/ROW]
[ROW][C]34[/C][C]-0.181194[/C][C]-1.7753[/C][C]0.039506[/C][/ROW]
[ROW][C]35[/C][C]0.039576[/C][C]0.3878[/C][C]0.349526[/C][/ROW]
[ROW][C]36[/C][C]0.256774[/C][C]2.5159[/C][C]0.006767[/C][/ROW]
[ROW][C]37[/C][C]-0.009585[/C][C]-0.0939[/C][C]0.462688[/C][/ROW]
[ROW][C]38[/C][C]-0.139068[/C][C]-1.3626[/C][C]0.088101[/C][/ROW]
[ROW][C]39[/C][C]-0.140739[/C][C]-1.379[/C][C]0.085557[/C][/ROW]
[ROW][C]40[/C][C]-0.032881[/C][C]-0.3222[/C][C]0.374014[/C][/ROW]
[ROW][C]41[/C][C]0.034155[/C][C]0.3346[/C][C]0.369312[/C][/ROW]
[ROW][C]42[/C][C]-0.006244[/C][C]-0.0612[/C][C]0.475674[/C][/ROW]
[ROW][C]43[/C][C]-0.014732[/C][C]-0.1443[/C][C]0.442767[/C][/ROW]
[ROW][C]44[/C][C]-0.118819[/C][C]-1.1642[/C][C]0.123618[/C][/ROW]
[ROW][C]45[/C][C]-0.265157[/C][C]-2.598[/C][C]0.005427[/C][/ROW]
[ROW][C]46[/C][C]-0.260567[/C][C]-2.553[/C][C]0.006127[/C][/ROW]
[ROW][C]47[/C][C]-0.08732[/C][C]-0.8556[/C][C]0.197185[/C][/ROW]
[ROW][C]48[/C][C]0.055267[/C][C]0.5415[/C][C]0.294708[/C][/ROW]
[/TABLE]
Source: https://freestatistics.org/blog/index.php?pk=41085&T=1

Globally Unique Identifier (entire table): ba.freestatistics.org/blog/index.php?pk=41085&T=1

As an alternative you can also use a QR Code:  

The GUIDs for individual cells are displayed in the table below:

Autocorrelation Function
Time lag kACF(k)T-STATP-value
10.4480574.391.5e-05
20.1052671.03140.152472
30.09440.92490.178662
40.1993641.95340.026844
50.2794862.73840.00368
60.2823892.76680.003395
70.2298412.2520.013301
80.1117881.09530.138064
9-0.083025-0.81350.20898
10-0.032541-0.31880.375273
110.2844422.7870.003207
120.6366366.23770
130.2649222.59570.005461
140.0499560.48950.312813
15-0.000527-0.00520.497947
160.1281041.25520.106235
170.2736762.68150.004315
180.2386082.33790.010735
190.154981.51850.066089
200.049270.48270.315187
21-0.126708-1.24150.108726
22-0.127984-1.2540.106446
230.1519731.4890.06988
240.4149364.06554.9e-05
250.1095831.07370.142826
26-0.089495-0.87690.191373
27-0.138838-1.36030.088455
280.0162570.15930.436891
290.1219651.1950.117514
300.0879780.8620.195417
310.0686650.67280.251353
32-0.019892-0.19490.422941
33-0.163323-1.60020.056417
34-0.181194-1.77530.039506
350.0395760.38780.349526
360.2567742.51590.006767
37-0.009585-0.09390.462688
38-0.139068-1.36260.088101
39-0.140739-1.3790.085557
40-0.032881-0.32220.374014
410.0341550.33460.369312
42-0.006244-0.06120.475674
43-0.014732-0.14430.442767
44-0.118819-1.16420.123618
45-0.265157-2.5980.005427
46-0.260567-2.5530.006127
47-0.08732-0.85560.197185
480.0552670.54150.294708


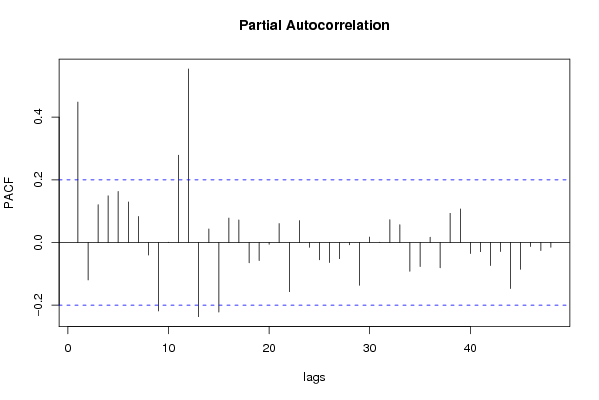
Partial Autocorrelation Function
Time lag kPACF(k)T-STATP-value
10.4480574.391.5e-05
2-0.119473-1.17060.12233
30.1207481.18310.119848
40.1487761.45770.074093
50.1625081.59220.057309
60.1291671.26560.104364
70.0830710.81390.208851
8-0.039913-0.39110.348308
9-0.218433-2.14020.017436
10-4.8e-05-5e-040.499813
110.2785722.72940.003774
120.5538555.42660
13-0.236844-2.32060.011213
140.0430810.42210.336945
15-0.222232-2.17740.01595
160.0776890.76120.224205
170.0720560.7060.240947
18-0.06468-0.63370.26388
19-0.057587-0.56420.286954
20-0.005936-0.05820.47687
210.0602680.59050.278119
22-0.15713-1.53960.063479
230.0697530.68340.247987
24-0.015461-0.15150.439954
25-0.055136-0.54020.295148
26-0.064171-0.62870.265506
27-0.051755-0.50710.306626
28-0.007416-0.07270.471113
29-0.136412-1.33660.092263
300.0171860.16840.433315
310.0001960.00190.499236
320.0724380.70970.23979
330.0563720.55230.291002
34-0.092095-0.90230.184567
35-0.07705-0.75490.226069
360.0166160.16280.435507
37-0.080729-0.7910.215453
380.0928320.90960.182666
390.1068071.04650.148981
40-0.035233-0.34520.365344
41-0.029445-0.28850.386792
42-0.07388-0.72390.235452
43-0.029244-0.28650.387546
44-0.147222-1.44250.076212
45-0.085785-0.84050.201352
46-0.013283-0.13010.44836
47-0.025561-0.25040.40139
48-0.015376-0.15070.440282

\begin{tabular}{lllllllll}
\hline
Partial Autocorrelation Function \tabularnewline
Time lag k & PACF(k) & T-STAT & P-value \tabularnewline
1 & 0.448057 & 4.39 & 1.5e-05 \tabularnewline
2 & -0.119473 & -1.1706 & 0.12233 \tabularnewline
3 & 0.120748 & 1.1831 & 0.119848 \tabularnewline
4 & 0.148776 & 1.4577 & 0.074093 \tabularnewline
5 & 0.162508 & 1.5922 & 0.057309 \tabularnewline
6 & 0.129167 & 1.2656 & 0.104364 \tabularnewline
7 & 0.083071 & 0.8139 & 0.208851 \tabularnewline
8 & -0.039913 & -0.3911 & 0.348308 \tabularnewline
9 & -0.218433 & -2.1402 & 0.017436 \tabularnewline
10 & -4.8e-05 & -5e-04 & 0.499813 \tabularnewline
11 & 0.278572 & 2.7294 & 0.003774 \tabularnewline
12 & 0.553855 & 5.4266 & 0 \tabularnewline
13 & -0.236844 & -2.3206 & 0.011213 \tabularnewline
14 & 0.043081 & 0.4221 & 0.336945 \tabularnewline
15 & -0.222232 & -2.1774 & 0.01595 \tabularnewline
16 & 0.077689 & 0.7612 & 0.224205 \tabularnewline
17 & 0.072056 & 0.706 & 0.240947 \tabularnewline
18 & -0.06468 & -0.6337 & 0.26388 \tabularnewline
19 & -0.057587 & -0.5642 & 0.286954 \tabularnewline
20 & -0.005936 & -0.0582 & 0.47687 \tabularnewline
21 & 0.060268 & 0.5905 & 0.278119 \tabularnewline
22 & -0.15713 & -1.5396 & 0.063479 \tabularnewline
23 & 0.069753 & 0.6834 & 0.247987 \tabularnewline
24 & -0.015461 & -0.1515 & 0.439954 \tabularnewline
25 & -0.055136 & -0.5402 & 0.295148 \tabularnewline
26 & -0.064171 & -0.6287 & 0.265506 \tabularnewline
27 & -0.051755 & -0.5071 & 0.306626 \tabularnewline
28 & -0.007416 & -0.0727 & 0.471113 \tabularnewline
29 & -0.136412 & -1.3366 & 0.092263 \tabularnewline
30 & 0.017186 & 0.1684 & 0.433315 \tabularnewline
31 & 0.000196 & 0.0019 & 0.499236 \tabularnewline
32 & 0.072438 & 0.7097 & 0.23979 \tabularnewline
33 & 0.056372 & 0.5523 & 0.291002 \tabularnewline
34 & -0.092095 & -0.9023 & 0.184567 \tabularnewline
35 & -0.07705 & -0.7549 & 0.226069 \tabularnewline
36 & 0.016616 & 0.1628 & 0.435507 \tabularnewline
37 & -0.080729 & -0.791 & 0.215453 \tabularnewline
38 & 0.092832 & 0.9096 & 0.182666 \tabularnewline
39 & 0.106807 & 1.0465 & 0.148981 \tabularnewline
40 & -0.035233 & -0.3452 & 0.365344 \tabularnewline
41 & -0.029445 & -0.2885 & 0.386792 \tabularnewline
42 & -0.07388 & -0.7239 & 0.235452 \tabularnewline
43 & -0.029244 & -0.2865 & 0.387546 \tabularnewline
44 & -0.147222 & -1.4425 & 0.076212 \tabularnewline
45 & -0.085785 & -0.8405 & 0.201352 \tabularnewline
46 & -0.013283 & -0.1301 & 0.44836 \tabularnewline
47 & -0.025561 & -0.2504 & 0.40139 \tabularnewline
48 & -0.015376 & -0.1507 & 0.440282 \tabularnewline
\hline
\end{tabular}
%Source: https://freestatistics.org/blog/index.php?pk=41085&T=2

[TABLE]
[ROW][C]Partial Autocorrelation Function[/C][/ROW]
[ROW][C]Time lag k[/C][C]PACF(k)[/C][C]T-STAT[/C][C]P-value[/C][/ROW]
[ROW][C]1[/C][C]0.448057[/C][C]4.39[/C][C]1.5e-05[/C][/ROW]
[ROW][C]2[/C][C]-0.119473[/C][C]-1.1706[/C][C]0.12233[/C][/ROW]
[ROW][C]3[/C][C]0.120748[/C][C]1.1831[/C][C]0.119848[/C][/ROW]
[ROW][C]4[/C][C]0.148776[/C][C]1.4577[/C][C]0.074093[/C][/ROW]
[ROW][C]5[/C][C]0.162508[/C][C]1.5922[/C][C]0.057309[/C][/ROW]
[ROW][C]6[/C][C]0.129167[/C][C]1.2656[/C][C]0.104364[/C][/ROW]
[ROW][C]7[/C][C]0.083071[/C][C]0.8139[/C][C]0.208851[/C][/ROW]
[ROW][C]8[/C][C]-0.039913[/C][C]-0.3911[/C][C]0.348308[/C][/ROW]
[ROW][C]9[/C][C]-0.218433[/C][C]-2.1402[/C][C]0.017436[/C][/ROW]
[ROW][C]10[/C][C]-4.8e-05[/C][C]-5e-04[/C][C]0.499813[/C][/ROW]
[ROW][C]11[/C][C]0.278572[/C][C]2.7294[/C][C]0.003774[/C][/ROW]
[ROW][C]12[/C][C]0.553855[/C][C]5.4266[/C][C]0[/C][/ROW]
[ROW][C]13[/C][C]-0.236844[/C][C]-2.3206[/C][C]0.011213[/C][/ROW]
[ROW][C]14[/C][C]0.043081[/C][C]0.4221[/C][C]0.336945[/C][/ROW]
[ROW][C]15[/C][C]-0.222232[/C][C]-2.1774[/C][C]0.01595[/C][/ROW]
[ROW][C]16[/C][C]0.077689[/C][C]0.7612[/C][C]0.224205[/C][/ROW]
[ROW][C]17[/C][C]0.072056[/C][C]0.706[/C][C]0.240947[/C][/ROW]
[ROW][C]18[/C][C]-0.06468[/C][C]-0.6337[/C][C]0.26388[/C][/ROW]
[ROW][C]19[/C][C]-0.057587[/C][C]-0.5642[/C][C]0.286954[/C][/ROW]
[ROW][C]20[/C][C]-0.005936[/C][C]-0.0582[/C][C]0.47687[/C][/ROW]
[ROW][C]21[/C][C]0.060268[/C][C]0.5905[/C][C]0.278119[/C][/ROW]
[ROW][C]22[/C][C]-0.15713[/C][C]-1.5396[/C][C]0.063479[/C][/ROW]
[ROW][C]23[/C][C]0.069753[/C][C]0.6834[/C][C]0.247987[/C][/ROW]
[ROW][C]24[/C][C]-0.015461[/C][C]-0.1515[/C][C]0.439954[/C][/ROW]
[ROW][C]25[/C][C]-0.055136[/C][C]-0.5402[/C][C]0.295148[/C][/ROW]
[ROW][C]26[/C][C]-0.064171[/C][C]-0.6287[/C][C]0.265506[/C][/ROW]
[ROW][C]27[/C][C]-0.051755[/C][C]-0.5071[/C][C]0.306626[/C][/ROW]
[ROW][C]28[/C][C]-0.007416[/C][C]-0.0727[/C][C]0.471113[/C][/ROW]
[ROW][C]29[/C][C]-0.136412[/C][C]-1.3366[/C][C]0.092263[/C][/ROW]
[ROW][C]30[/C][C]0.017186[/C][C]0.1684[/C][C]0.433315[/C][/ROW]
[ROW][C]31[/C][C]0.000196[/C][C]0.0019[/C][C]0.499236[/C][/ROW]
[ROW][C]32[/C][C]0.072438[/C][C]0.7097[/C][C]0.23979[/C][/ROW]
[ROW][C]33[/C][C]0.056372[/C][C]0.5523[/C][C]0.291002[/C][/ROW]
[ROW][C]34[/C][C]-0.092095[/C][C]-0.9023[/C][C]0.184567[/C][/ROW]
[ROW][C]35[/C][C]-0.07705[/C][C]-0.7549[/C][C]0.226069[/C][/ROW]
[ROW][C]36[/C][C]0.016616[/C][C]0.1628[/C][C]0.435507[/C][/ROW]
[ROW][C]37[/C][C]-0.080729[/C][C]-0.791[/C][C]0.215453[/C][/ROW]
[ROW][C]38[/C][C]0.092832[/C][C]0.9096[/C][C]0.182666[/C][/ROW]
[ROW][C]39[/C][C]0.106807[/C][C]1.0465[/C][C]0.148981[/C][/ROW]
[ROW][C]40[/C][C]-0.035233[/C][C]-0.3452[/C][C]0.365344[/C][/ROW]
[ROW][C]41[/C][C]-0.029445[/C][C]-0.2885[/C][C]0.386792[/C][/ROW]
[ROW][C]42[/C][C]-0.07388[/C][C]-0.7239[/C][C]0.235452[/C][/ROW]
[ROW][C]43[/C][C]-0.029244[/C][C]-0.2865[/C][C]0.387546[/C][/ROW]
[ROW][C]44[/C][C]-0.147222[/C][C]-1.4425[/C][C]0.076212[/C][/ROW]
[ROW][C]45[/C][C]-0.085785[/C][C]-0.8405[/C][C]0.201352[/C][/ROW]
[ROW][C]46[/C][C]-0.013283[/C][C]-0.1301[/C][C]0.44836[/C][/ROW]
[ROW][C]47[/C][C]-0.025561[/C][C]-0.2504[/C][C]0.40139[/C][/ROW]
[ROW][C]48[/C][C]-0.015376[/C][C]-0.1507[/C][C]0.440282[/C][/ROW]
[/TABLE]
Source: https://freestatistics.org/blog/index.php?pk=41085&T=2

Globally Unique Identifier (entire table): ba.freestatistics.org/blog/index.php?pk=41085&T=2

As an alternative you can also use a QR Code:  

The GUIDs for individual cells are displayed in the table below:

Partial Autocorrelation Function
Time lag kPACF(k)T-STATP-value
10.4480574.391.5e-05
2-0.119473-1.17060.12233
30.1207481.18310.119848
40.1487761.45770.074093
50.1625081.59220.057309
60.1291671.26560.104364
70.0830710.81390.208851
8-0.039913-0.39110.348308
9-0.218433-2.14020.017436
10-4.8e-05-5e-040.499813
110.2785722.72940.003774
120.5538555.42660
13-0.236844-2.32060.011213
140.0430810.42210.336945
15-0.222232-2.17740.01595
160.0776890.76120.224205
170.0720560.7060.240947
18-0.06468-0.63370.26388
19-0.057587-0.56420.286954
20-0.005936-0.05820.47687
210.0602680.59050.278119
22-0.15713-1.53960.063479
230.0697530.68340.247987
24-0.015461-0.15150.439954
25-0.055136-0.54020.295148
26-0.064171-0.62870.265506
27-0.051755-0.50710.306626
28-0.007416-0.07270.471113
29-0.136412-1.33660.092263
300.0171860.16840.433315
310.0001960.00190.499236
320.0724380.70970.23979
330.0563720.55230.291002
34-0.092095-0.90230.184567
35-0.07705-0.75490.226069
360.0166160.16280.435507
37-0.080729-0.7910.215453
380.0928320.90960.182666
390.1068071.04650.148981
40-0.035233-0.34520.365344
41-0.029445-0.28850.386792
42-0.07388-0.72390.235452
43-0.029244-0.28650.387546
44-0.147222-1.44250.076212
45-0.085785-0.84050.201352
46-0.013283-0.13010.44836
47-0.025561-0.25040.40139
48-0.015376-0.15070.440282


Parameters (Session):
par1 = Default ; par2 = 1 ; par3 = 0 ; par4 = 0 ; par5 = 12 ;
Parameters (R input):
par1 = 48 ; par2 = 1 ; par3 = 0 ; par4 = 0 ; par5 = 12 ;
R code (references can be found in the software module):
if (par1 == 'Default') {
par1 = 10*log10(length(x))
} else {
par1 <- as.numeric(par1)
}
par2 <- as.numeric(par2)
par3 <- as.numeric(par3)
par4 <- as.numeric(par4)
par5 <- as.numeric(par5)
if (par2 == 0) {
x <- log(x)
} else {
x <- (x ^ par2 - 1) / par2
}
if (par3 > 0) x <- diff(x,lag=1,difference=par3)
if (par4 > 0) x <- diff(x,lag=par5,difference=par4)
bitmap(file='pic1.png')
racf <- acf(x,par1,main='Autocorrelation',xlab='lags',ylab='ACF')
dev.off()
bitmap(file='pic2.png')
rpacf <- pacf(x,par1,main='Partial Autocorrelation',xlab='lags',ylab='PACF')
dev.off()
(myacf <- c(racf$acf))
(mypacf <- c(rpacf$acf))
lengthx <- length(x)
sqrtn <- sqrt(lengthx)
load(file='createtable')
a<-table.start()
a<-table.row.start(a)
a<-table.element(a,'Autocorrelation Function',4,TRUE)
a<-table.row.end(a)
a<-table.row.start(a)
a<-table.element(a,'Time lag k',header=TRUE)
a<-table.element(a,hyperlink('basics.htm','ACF(k)','click here for more information about the Autocorrelation Function'),header=TRUE)
a<-table.element(a,'T-STAT',header=TRUE)
a<-table.element(a,'P-value',header=TRUE)
a<-table.row.end(a)
for (i in 2:(par1+1)) {
a<-table.row.start(a)
a<-table.element(a,i-1,header=TRUE)
a<-table.element(a,round(myacf[i],6))
mytstat <- myacf[i]*sqrtn
a<-table.element(a,round(mytstat,4))
a<-table.element(a,round(1-pt(abs(mytstat),lengthx),6))
a<-table.row.end(a)
}
a<-table.end(a)
table.save(a,file='mytable.tab')
a<-table.start()
a<-table.row.start(a)
a<-table.element(a,'Partial Autocorrelation Function',4,TRUE)
a<-table.row.end(a)
a<-table.row.start(a)
a<-table.element(a,'Time lag k',header=TRUE)
a<-table.element(a,hyperlink('basics.htm','PACF(k)','click here for more information about the Partial Autocorrelation Function'),header=TRUE)
a<-table.element(a,'T-STAT',header=TRUE)
a<-table.element(a,'P-value',header=TRUE)
a<-table.row.end(a)
for (i in 1:par1) {
a<-table.row.start(a)
a<-table.element(a,i,header=TRUE)
a<-table.element(a,round(mypacf[i],6))
mytstat <- mypacf[i]*sqrtn
a<-table.element(a,round(mytstat,4))
a<-table.element(a,round(1-pt(abs(mytstat),lengthx),6))
a<-table.row.end(a)
}
a<-table.end(a)
table.save(a,file='mytable1.tab')