Free Statistics
of Irreproducible Research!
Description of Statistical Computation | |||||||||||||||||||||||||||||||||
|---|---|---|---|---|---|---|---|---|---|---|---|---|---|---|---|---|---|---|---|---|---|---|---|---|---|---|---|---|---|---|---|---|---|
| Author's title | |||||||||||||||||||||||||||||||||
| Author | *Unverified author* | ||||||||||||||||||||||||||||||||
| R Software Module | rwasp_meanversusmedian.wasp | ||||||||||||||||||||||||||||||||
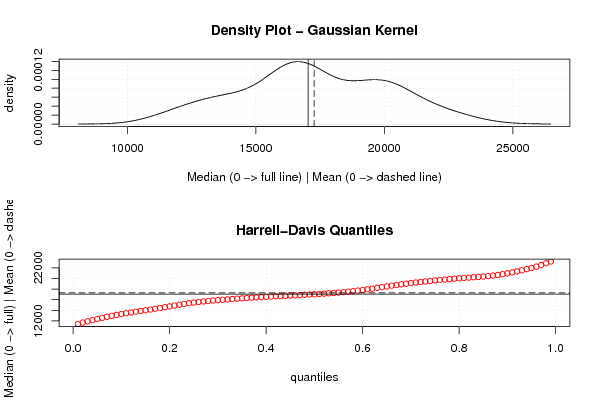
| Title produced by software | Mean versus Median | ||||||||||||||||||||||||||||||||
| Date of computation | Mon, 01 Jun 2009 13:52:20 -0600 | ||||||||||||||||||||||||||||||||
| Cite this page as follows | Statistical Computations at FreeStatistics.org, Office for Research Development and Education, URL https://freestatistics.org/blog/index.php?v=date/2009/Jun/01/t124388598518w4k6v0jaw1h43.htm/, Retrieved Mon, 13 May 2024 10:36:07 +0000 | ||||||||||||||||||||||||||||||||
| Statistical Computations at FreeStatistics.org, Office for Research Development and Education, URL https://freestatistics.org/blog/index.php?pk=41064, Retrieved Mon, 13 May 2024 10:36:07 +0000 | |||||||||||||||||||||||||||||||||
| QR Codes: | |||||||||||||||||||||||||||||||||
|
| |||||||||||||||||||||||||||||||||
| Original text written by user: | |||||||||||||||||||||||||||||||||
| IsPrivate? | No (this computation is public) | ||||||||||||||||||||||||||||||||
| User-defined keywords | Maandelijkse verkoop auto's | ||||||||||||||||||||||||||||||||
| Estimated Impact | 97 | ||||||||||||||||||||||||||||||||
Tree of Dependent Computations | |||||||||||||||||||||||||||||||||
| Family? (F = Feedback message, R = changed R code, M = changed R Module, P = changed Parameters, D = changed Data) | |||||||||||||||||||||||||||||||||
| - [Mean versus Median] [Nick Vermeulen Me...] [2009-06-01 19:52:20] [2c8a5cc66f27790b8fc8930915f8068b] [Current] | |||||||||||||||||||||||||||||||||
| Feedback Forum | |||||||||||||||||||||||||||||||||
Post a new message | |||||||||||||||||||||||||||||||||
Dataset | |||||||||||||||||||||||||||||||||
| Dataseries X: | |||||||||||||||||||||||||||||||||
14620 16005 16683 15487 15684 15962 12000 13769 14031 16078 15827 13149 15969 16628 16670 16487 16883 16201 12168 14010 16556 17404 16435 13123 16744 17410 16484 17103 17301 17301 12843 13748 16904 17342 15476 15424 15988 19244 18715 17780 17160 17349 11171 13438 16713 18369 17067 14055 15500 18475 19423 18686 19646 19733 12605 16616 19156 21348 20049 18020 20262 21789 20603 21928 21025 19346 11786 19082 20127 20217 20385 16653 13065 20275 21776 20260 22523 23033 14133 20110 19682 22197 17212 11784 15467 17002 15952 18767 20605 19809 14233 19311 20827 23388 20181 14344 | |||||||||||||||||||||||||||||||||
Tables (Output of Computation) | |||||||||||||||||||||||||||||||||
| |||||||||||||||||||||||||||||||||
Figures (Output of Computation) | |||||||||||||||||||||||||||||||||
Input Parameters & R Code | |||||||||||||||||||||||||||||||||
| Parameters (Session): | |||||||||||||||||||||||||||||||||
| Parameters (R input): | |||||||||||||||||||||||||||||||||
| R code (references can be found in the software module): | |||||||||||||||||||||||||||||||||
library(Hmisc) | |||||||||||||||||||||||||||||||||