Free Statistics

of Irreproducible Research!

Author's title

Author*Unverified author*
R Software Modulerwasp_centraltendency.wasp
Title produced by softwareCentral Tendency
Date of computationMon, 01 Jun 2009 11:40:43 -0600
Cite this page as followsStatistical Computations at FreeStatistics.org, Office for Research Development and Education, URL https://freestatistics.org/blog/index.php?v=date/2009/Jun/01/t1243878085gyesiv8dxm4vv2u.htm/, Retrieved Mon, 13 May 2024 01:06:10 +0000
Statistical Computations at FreeStatistics.org, Office for Research Development and Education, URL https://freestatistics.org/blog/index.php?pk=41024, Retrieved Mon, 13 May 2024 01:06:10 +0000
QR Codes:

Original text written by user:
IsPrivate?No (this computation is public)
User-defined keywords
Estimated Impact95
Family? (F = Feedback message, R = changed R code, M = changed R Module, P = changed Parameters, D = changed Data)
-       [Central Tendency] [opgave 5, aantal ...] [2009-06-01 17:40:43] [128e176e37dfd0a2af97689096e2163e] [Current]
Feedback Forum

Post a new message
Dataseries X:
1639
1296
1063
1282
1365
1268
1532
1455
1393
1515
1510
1225
1577
1417
1224
1693
1633
1639
1914
1586
1552
2081
1500
1437
1470
1849
1387
1592
1590
1798
1935
1887
2027
2080
1556
1682
1785
1869
1781
2082
2571
1862
1938
1505
1767
1607
1578
1495
1615
1700
1337
1531
1623
1543
1638
1520
1416
1820
1596
1358
1267
1742
1402
1388
1646
1670
1531
1730
1407
1795
1504
1371
1734


Summary of computational transaction
Raw Inputview raw input (R code)
Raw Outputview raw output of R engine
Computing time2 seconds
R Server'Sir Ronald Aylmer Fisher' @ 193.190.124.24

\begin{tabular}{lllllllll}
\hline
Summary of computational transaction \tabularnewline
Raw Input & view raw input (R code)  \tabularnewline
Raw Output & view raw output of R engine  \tabularnewline
Computing time & 2 seconds \tabularnewline
R Server & 'Sir Ronald Aylmer Fisher' @ 193.190.124.24 \tabularnewline
\hline
\end{tabular}
%Source: https://freestatistics.org/blog/index.php?pk=41024&T=0

[TABLE]
[ROW][C]Summary of computational transaction[/C][/ROW]
[ROW][C]Raw Input[/C][C]view raw input (R code) [/C][/ROW]
[ROW][C]Raw Output[/C][C]view raw output of R engine [/C][/ROW]
[ROW][C]Computing time[/C][C]2 seconds[/C][/ROW]
[ROW][C]R Server[/C][C]'Sir Ronald Aylmer Fisher' @ 193.190.124.24[/C][/ROW]
[/TABLE]
Source: https://freestatistics.org/blog/index.php?pk=41024&T=0

Globally Unique Identifier (entire table): ba.freestatistics.org/blog/index.php?pk=41024&T=0

As an alternative you can also use a QR Code:  

The GUIDs for individual cells are displayed in the table below:

Summary of computational transaction
Raw Inputview raw input (R code)
Raw Outputview raw output of R engine
Computing time2 seconds
R Server'Sir Ronald Aylmer Fisher' @ 193.190.124.24


Central Tendency - Ungrouped Data
MeasureValueS.E.Value/S.E.
Arithmetic Mean1607.8493150684928.885234988085655.6633628125819
Geometric Mean1590.05610111604
Harmonic Mean1572.88283733962
Quadratic Mean1626.42341030528
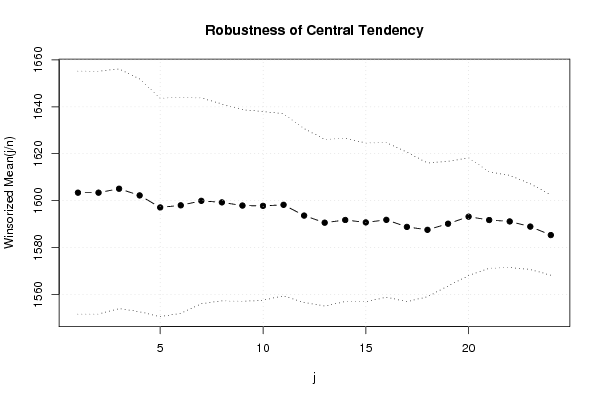
Winsorized Mean ( 1 / 24 )1603.3561643835625.921174635197861.8550735816732
Winsorized Mean ( 2 / 24 )1603.3561643835625.908590997329461.8851161975126
Winsorized Mean ( 3 / 24 )1605.0410958904125.564378684364062.7842794736922
Winsorized Mean ( 4 / 24 )1602.1917808219224.834127485189164.515726665954
Winsorized Mean ( 5 / 24 )1597.0547945205523.307821101713968.5201241055997
Winsorized Mean ( 6 / 24 )1597.9589041095923.044993037380469.3408282448862
Winsorized Mean ( 7 / 24 )1599.8767123287721.954896559877072.8710658219438
Winsorized Mean ( 8 / 24 )1599.2191780821921.004024461943676.1387028938078
Winsorized Mean ( 9 / 24 )1597.8630136986320.451396842921878.129774018426
Winsorized Mean ( 10 / 24 )1597.7260273972620.146526229852379.3052861405861
Winsorized Mean ( 11 / 24 )1598.1780821917819.421762245771182.2880056900998
Winsorized Mean ( 12 / 24 )1593.5753424657518.564881883508985.8381622067479
Winsorized Mean ( 13 / 24 )1590.5479452054817.778090952653289.4667458638523
Winsorized Mean ( 14 / 24 )1591.6986301369917.421105974747291.3661068616558
Winsorized Mean ( 15 / 24 )1590.6712328767116.935739577472593.923930844602
Winsorized Mean ( 16 / 24 )1591.7671232876716.501551061131096.4616669906284
Winsorized Mean ( 17 / 24 )1588.7397260274015.954201330856599.5812759962274
Winsorized Mean ( 18 / 24 )1587.5068493150714.2820059442948111.154333327331
Winsorized Mean ( 19 / 24 )1590.1095890411013.2951874660694119.600388719543
Winsorized Mean ( 20 / 24 )1593.1232876712312.5598255606803126.842787742105
Winsorized Mean ( 21 / 24 )1591.6849315068510.315234494471154.304289675625
Winsorized Mean ( 22 / 24 )1591.082191780829.813999905717162.123721934617
Winsorized Mean ( 23 / 24 )1588.876712328779.15675980236396173.519536017377
Winsorized Mean ( 24 / 24 )1585.260273972608.56424435391703185.102176965274
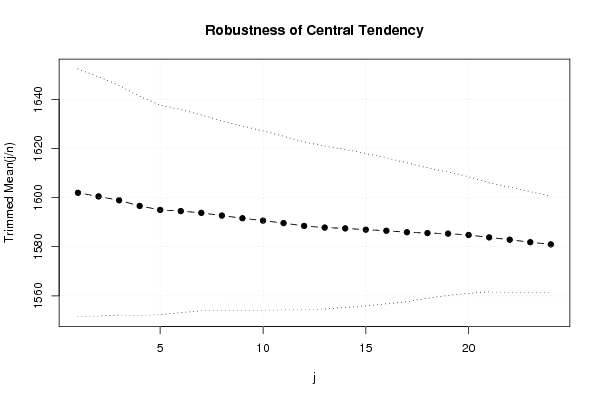
Trimmed Mean ( 1 / 24 )1601.9577464788725.208965195047563.5471442038243
Trimmed Mean ( 2 / 24 )1600.4782608695724.362945540021265.6931346105275
Trimmed Mean ( 3 / 24 )1598.9104477611923.359332268815168.4484654510333
Trimmed Mean ( 4 / 24 )1596.6153846153822.311967428547071.5587000442012
Trimmed Mean ( 5 / 24 )159521.332733286492174.7677280065165
Trimmed Mean ( 6 / 24 )1594.5081967213120.658101824983377.185610286467
Trimmed Mean ( 7 / 24 )1593.7966101694919.912576016490680.0396999790277
Trimmed Mean ( 8 / 24 )1592.6842105263219.294530856869282.5458894202288
Trimmed Mean ( 9 / 24 )1591.618.771631293367784.7875166055673
Trimmed Mean ( 10 / 24 )1590.6415094339618.252822402181887.1449617152813
Trimmed Mean ( 11 / 24 )1589.6274509803917.671001187484889.9568413874716
Trimmed Mean ( 12 / 24 )1588.4693877551017.101589764805192.8843113184807
Trimmed Mean ( 13 / 24 )1587.8085106383016.57630684053895.7878329541566
Trimmed Mean ( 14 / 24 )1587.4666666666716.079430363295998.726548814213
Trimmed Mean ( 15 / 24 )1586.9534883720915.5098994389802102.318747753044
Trimmed Mean ( 16 / 24 )1586.5121951219514.8741108343068106.662657875501
Trimmed Mean ( 17 / 24 )1585.8974358974414.1306223149043112.231252138465
Trimmed Mean ( 18 / 24 )1585.5675675675713.2709430237474119.476631369022
Trimmed Mean ( 19 / 24 )1585.3428571428612.5706034870571126.115095331354
Trimmed Mean ( 20 / 24 )1584.7878787878811.8763163206453133.441029693100
Trimmed Mean ( 21 / 24 )1583.8064516129011.1032707914592142.643233814598
Trimmed Mean ( 22 / 24 )1582.8620689655210.7157317409346147.713857273873
Trimmed Mean ( 23 / 24 )1581.8518518518510.2820208894850153.846395456126
Trimmed Mean ( 24 / 24 )1580.969.84081297454636160.653393585389
Median1586
Midrange1817
Midmean - Weighted Average at Xnp1581.22222222222
Midmean - Weighted Average at X(n+1)p1585.56756756757
Midmean - Empirical Distribution Function1585.56756756757
Midmean - Empirical Distribution Function - Averaging1585.56756756757
Midmean - Empirical Distribution Function - Interpolation1585.56756756757
Midmean - Closest Observation1581.13157894737
Midmean - True Basic - Statistics Graphics Toolkit1585.56756756757
Midmean - MS Excel (old versions)1585.56756756757
Number of observations73

\begin{tabular}{lllllllll}
\hline
Central Tendency - Ungrouped Data \tabularnewline
Measure & Value & S.E. & Value/S.E. \tabularnewline
Arithmetic Mean & 1607.84931506849 & 28.8852349880856 & 55.6633628125819 \tabularnewline
Geometric Mean & 1590.05610111604 &  &  \tabularnewline
Harmonic Mean & 1572.88283733962 &  &  \tabularnewline
Quadratic Mean & 1626.42341030528 &  &  \tabularnewline
Winsorized Mean ( 1 / 24 ) & 1603.35616438356 & 25.9211746351978 & 61.8550735816732 \tabularnewline
Winsorized Mean ( 2 / 24 ) & 1603.35616438356 & 25.9085909973294 & 61.8851161975126 \tabularnewline
Winsorized Mean ( 3 / 24 ) & 1605.04109589041 & 25.5643786843640 & 62.7842794736922 \tabularnewline
Winsorized Mean ( 4 / 24 ) & 1602.19178082192 & 24.8341274851891 & 64.515726665954 \tabularnewline
Winsorized Mean ( 5 / 24 ) & 1597.05479452055 & 23.3078211017139 & 68.5201241055997 \tabularnewline
Winsorized Mean ( 6 / 24 ) & 1597.95890410959 & 23.0449930373804 & 69.3408282448862 \tabularnewline
Winsorized Mean ( 7 / 24 ) & 1599.87671232877 & 21.9548965598770 & 72.8710658219438 \tabularnewline
Winsorized Mean ( 8 / 24 ) & 1599.21917808219 & 21.0040244619436 & 76.1387028938078 \tabularnewline
Winsorized Mean ( 9 / 24 ) & 1597.86301369863 & 20.4513968429218 & 78.129774018426 \tabularnewline
Winsorized Mean ( 10 / 24 ) & 1597.72602739726 & 20.1465262298523 & 79.3052861405861 \tabularnewline
Winsorized Mean ( 11 / 24 ) & 1598.17808219178 & 19.4217622457711 & 82.2880056900998 \tabularnewline
Winsorized Mean ( 12 / 24 ) & 1593.57534246575 & 18.5648818835089 & 85.8381622067479 \tabularnewline
Winsorized Mean ( 13 / 24 ) & 1590.54794520548 & 17.7780909526532 & 89.4667458638523 \tabularnewline
Winsorized Mean ( 14 / 24 ) & 1591.69863013699 & 17.4211059747472 & 91.3661068616558 \tabularnewline
Winsorized Mean ( 15 / 24 ) & 1590.67123287671 & 16.9357395774725 & 93.923930844602 \tabularnewline
Winsorized Mean ( 16 / 24 ) & 1591.76712328767 & 16.5015510611310 & 96.4616669906284 \tabularnewline
Winsorized Mean ( 17 / 24 ) & 1588.73972602740 & 15.9542013308565 & 99.5812759962274 \tabularnewline
Winsorized Mean ( 18 / 24 ) & 1587.50684931507 & 14.2820059442948 & 111.154333327331 \tabularnewline
Winsorized Mean ( 19 / 24 ) & 1590.10958904110 & 13.2951874660694 & 119.600388719543 \tabularnewline
Winsorized Mean ( 20 / 24 ) & 1593.12328767123 & 12.5598255606803 & 126.842787742105 \tabularnewline
Winsorized Mean ( 21 / 24 ) & 1591.68493150685 & 10.315234494471 & 154.304289675625 \tabularnewline
Winsorized Mean ( 22 / 24 ) & 1591.08219178082 & 9.813999905717 & 162.123721934617 \tabularnewline
Winsorized Mean ( 23 / 24 ) & 1588.87671232877 & 9.15675980236396 & 173.519536017377 \tabularnewline
Winsorized Mean ( 24 / 24 ) & 1585.26027397260 & 8.56424435391703 & 185.102176965274 \tabularnewline
Trimmed Mean ( 1 / 24 ) & 1601.95774647887 & 25.2089651950475 & 63.5471442038243 \tabularnewline
Trimmed Mean ( 2 / 24 ) & 1600.47826086957 & 24.3629455400212 & 65.6931346105275 \tabularnewline
Trimmed Mean ( 3 / 24 ) & 1598.91044776119 & 23.3593322688151 & 68.4484654510333 \tabularnewline
Trimmed Mean ( 4 / 24 ) & 1596.61538461538 & 22.3119674285470 & 71.5587000442012 \tabularnewline
Trimmed Mean ( 5 / 24 ) & 1595 & 21.3327332864921 & 74.7677280065165 \tabularnewline
Trimmed Mean ( 6 / 24 ) & 1594.50819672131 & 20.6581018249833 & 77.185610286467 \tabularnewline
Trimmed Mean ( 7 / 24 ) & 1593.79661016949 & 19.9125760164906 & 80.0396999790277 \tabularnewline
Trimmed Mean ( 8 / 24 ) & 1592.68421052632 & 19.2945308568692 & 82.5458894202288 \tabularnewline
Trimmed Mean ( 9 / 24 ) & 1591.6 & 18.7716312933677 & 84.7875166055673 \tabularnewline
Trimmed Mean ( 10 / 24 ) & 1590.64150943396 & 18.2528224021818 & 87.1449617152813 \tabularnewline
Trimmed Mean ( 11 / 24 ) & 1589.62745098039 & 17.6710011874848 & 89.9568413874716 \tabularnewline
Trimmed Mean ( 12 / 24 ) & 1588.46938775510 & 17.1015897648051 & 92.8843113184807 \tabularnewline
Trimmed Mean ( 13 / 24 ) & 1587.80851063830 & 16.576306840538 & 95.7878329541566 \tabularnewline
Trimmed Mean ( 14 / 24 ) & 1587.46666666667 & 16.0794303632959 & 98.726548814213 \tabularnewline
Trimmed Mean ( 15 / 24 ) & 1586.95348837209 & 15.5098994389802 & 102.318747753044 \tabularnewline
Trimmed Mean ( 16 / 24 ) & 1586.51219512195 & 14.8741108343068 & 106.662657875501 \tabularnewline
Trimmed Mean ( 17 / 24 ) & 1585.89743589744 & 14.1306223149043 & 112.231252138465 \tabularnewline
Trimmed Mean ( 18 / 24 ) & 1585.56756756757 & 13.2709430237474 & 119.476631369022 \tabularnewline
Trimmed Mean ( 19 / 24 ) & 1585.34285714286 & 12.5706034870571 & 126.115095331354 \tabularnewline
Trimmed Mean ( 20 / 24 ) & 1584.78787878788 & 11.8763163206453 & 133.441029693100 \tabularnewline
Trimmed Mean ( 21 / 24 ) & 1583.80645161290 & 11.1032707914592 & 142.643233814598 \tabularnewline
Trimmed Mean ( 22 / 24 ) & 1582.86206896552 & 10.7157317409346 & 147.713857273873 \tabularnewline
Trimmed Mean ( 23 / 24 ) & 1581.85185185185 & 10.2820208894850 & 153.846395456126 \tabularnewline
Trimmed Mean ( 24 / 24 ) & 1580.96 & 9.84081297454636 & 160.653393585389 \tabularnewline
Median & 1586 &  &  \tabularnewline
Midrange & 1817 &  &  \tabularnewline
Midmean - Weighted Average at Xnp & 1581.22222222222 &  &  \tabularnewline
Midmean - Weighted Average at X(n+1)p & 1585.56756756757 &  &  \tabularnewline
Midmean - Empirical Distribution Function & 1585.56756756757 &  &  \tabularnewline
Midmean - Empirical Distribution Function - Averaging & 1585.56756756757 &  &  \tabularnewline
Midmean - Empirical Distribution Function - Interpolation & 1585.56756756757 &  &  \tabularnewline
Midmean - Closest Observation & 1581.13157894737 &  &  \tabularnewline
Midmean - True Basic - Statistics Graphics Toolkit & 1585.56756756757 &  &  \tabularnewline
Midmean - MS Excel (old versions) & 1585.56756756757 &  &  \tabularnewline
Number of observations & 73 &  &  \tabularnewline
\hline
\end{tabular}
%Source: https://freestatistics.org/blog/index.php?pk=41024&T=1

[TABLE]
[ROW][C]Central Tendency - Ungrouped Data[/C][/ROW]
[ROW][C]Measure[/C][C]Value[/C][C]S.E.[/C][C]Value/S.E.[/C][/ROW]
[ROW][C]Arithmetic Mean[/C][C]1607.84931506849[/C][C]28.8852349880856[/C][C]55.6633628125819[/C][/ROW]
[ROW][C]Geometric Mean[/C][C]1590.05610111604[/C][C][/C][C][/C][/ROW]
[ROW][C]Harmonic Mean[/C][C]1572.88283733962[/C][C][/C][C][/C][/ROW]
[ROW][C]Quadratic Mean[/C][C]1626.42341030528[/C][C][/C][C][/C][/ROW]
[ROW][C]Winsorized Mean ( 1 / 24 )[/C][C]1603.35616438356[/C][C]25.9211746351978[/C][C]61.8550735816732[/C][/ROW]
[ROW][C]Winsorized Mean ( 2 / 24 )[/C][C]1603.35616438356[/C][C]25.9085909973294[/C][C]61.8851161975126[/C][/ROW]
[ROW][C]Winsorized Mean ( 3 / 24 )[/C][C]1605.04109589041[/C][C]25.5643786843640[/C][C]62.7842794736922[/C][/ROW]
[ROW][C]Winsorized Mean ( 4 / 24 )[/C][C]1602.19178082192[/C][C]24.8341274851891[/C][C]64.515726665954[/C][/ROW]
[ROW][C]Winsorized Mean ( 5 / 24 )[/C][C]1597.05479452055[/C][C]23.3078211017139[/C][C]68.5201241055997[/C][/ROW]
[ROW][C]Winsorized Mean ( 6 / 24 )[/C][C]1597.95890410959[/C][C]23.0449930373804[/C][C]69.3408282448862[/C][/ROW]
[ROW][C]Winsorized Mean ( 7 / 24 )[/C][C]1599.87671232877[/C][C]21.9548965598770[/C][C]72.8710658219438[/C][/ROW]
[ROW][C]Winsorized Mean ( 8 / 24 )[/C][C]1599.21917808219[/C][C]21.0040244619436[/C][C]76.1387028938078[/C][/ROW]
[ROW][C]Winsorized Mean ( 9 / 24 )[/C][C]1597.86301369863[/C][C]20.4513968429218[/C][C]78.129774018426[/C][/ROW]
[ROW][C]Winsorized Mean ( 10 / 24 )[/C][C]1597.72602739726[/C][C]20.1465262298523[/C][C]79.3052861405861[/C][/ROW]
[ROW][C]Winsorized Mean ( 11 / 24 )[/C][C]1598.17808219178[/C][C]19.4217622457711[/C][C]82.2880056900998[/C][/ROW]
[ROW][C]Winsorized Mean ( 12 / 24 )[/C][C]1593.57534246575[/C][C]18.5648818835089[/C][C]85.8381622067479[/C][/ROW]
[ROW][C]Winsorized Mean ( 13 / 24 )[/C][C]1590.54794520548[/C][C]17.7780909526532[/C][C]89.4667458638523[/C][/ROW]
[ROW][C]Winsorized Mean ( 14 / 24 )[/C][C]1591.69863013699[/C][C]17.4211059747472[/C][C]91.3661068616558[/C][/ROW]
[ROW][C]Winsorized Mean ( 15 / 24 )[/C][C]1590.67123287671[/C][C]16.9357395774725[/C][C]93.923930844602[/C][/ROW]
[ROW][C]Winsorized Mean ( 16 / 24 )[/C][C]1591.76712328767[/C][C]16.5015510611310[/C][C]96.4616669906284[/C][/ROW]
[ROW][C]Winsorized Mean ( 17 / 24 )[/C][C]1588.73972602740[/C][C]15.9542013308565[/C][C]99.5812759962274[/C][/ROW]
[ROW][C]Winsorized Mean ( 18 / 24 )[/C][C]1587.50684931507[/C][C]14.2820059442948[/C][C]111.154333327331[/C][/ROW]
[ROW][C]Winsorized Mean ( 19 / 24 )[/C][C]1590.10958904110[/C][C]13.2951874660694[/C][C]119.600388719543[/C][/ROW]
[ROW][C]Winsorized Mean ( 20 / 24 )[/C][C]1593.12328767123[/C][C]12.5598255606803[/C][C]126.842787742105[/C][/ROW]
[ROW][C]Winsorized Mean ( 21 / 24 )[/C][C]1591.68493150685[/C][C]10.315234494471[/C][C]154.304289675625[/C][/ROW]
[ROW][C]Winsorized Mean ( 22 / 24 )[/C][C]1591.08219178082[/C][C]9.813999905717[/C][C]162.123721934617[/C][/ROW]
[ROW][C]Winsorized Mean ( 23 / 24 )[/C][C]1588.87671232877[/C][C]9.15675980236396[/C][C]173.519536017377[/C][/ROW]
[ROW][C]Winsorized Mean ( 24 / 24 )[/C][C]1585.26027397260[/C][C]8.56424435391703[/C][C]185.102176965274[/C][/ROW]
[ROW][C]Trimmed Mean ( 1 / 24 )[/C][C]1601.95774647887[/C][C]25.2089651950475[/C][C]63.5471442038243[/C][/ROW]
[ROW][C]Trimmed Mean ( 2 / 24 )[/C][C]1600.47826086957[/C][C]24.3629455400212[/C][C]65.6931346105275[/C][/ROW]
[ROW][C]Trimmed Mean ( 3 / 24 )[/C][C]1598.91044776119[/C][C]23.3593322688151[/C][C]68.4484654510333[/C][/ROW]
[ROW][C]Trimmed Mean ( 4 / 24 )[/C][C]1596.61538461538[/C][C]22.3119674285470[/C][C]71.5587000442012[/C][/ROW]
[ROW][C]Trimmed Mean ( 5 / 24 )[/C][C]1595[/C][C]21.3327332864921[/C][C]74.7677280065165[/C][/ROW]
[ROW][C]Trimmed Mean ( 6 / 24 )[/C][C]1594.50819672131[/C][C]20.6581018249833[/C][C]77.185610286467[/C][/ROW]
[ROW][C]Trimmed Mean ( 7 / 24 )[/C][C]1593.79661016949[/C][C]19.9125760164906[/C][C]80.0396999790277[/C][/ROW]
[ROW][C]Trimmed Mean ( 8 / 24 )[/C][C]1592.68421052632[/C][C]19.2945308568692[/C][C]82.5458894202288[/C][/ROW]
[ROW][C]Trimmed Mean ( 9 / 24 )[/C][C]1591.6[/C][C]18.7716312933677[/C][C]84.7875166055673[/C][/ROW]
[ROW][C]Trimmed Mean ( 10 / 24 )[/C][C]1590.64150943396[/C][C]18.2528224021818[/C][C]87.1449617152813[/C][/ROW]
[ROW][C]Trimmed Mean ( 11 / 24 )[/C][C]1589.62745098039[/C][C]17.6710011874848[/C][C]89.9568413874716[/C][/ROW]
[ROW][C]Trimmed Mean ( 12 / 24 )[/C][C]1588.46938775510[/C][C]17.1015897648051[/C][C]92.8843113184807[/C][/ROW]
[ROW][C]Trimmed Mean ( 13 / 24 )[/C][C]1587.80851063830[/C][C]16.576306840538[/C][C]95.7878329541566[/C][/ROW]
[ROW][C]Trimmed Mean ( 14 / 24 )[/C][C]1587.46666666667[/C][C]16.0794303632959[/C][C]98.726548814213[/C][/ROW]
[ROW][C]Trimmed Mean ( 15 / 24 )[/C][C]1586.95348837209[/C][C]15.5098994389802[/C][C]102.318747753044[/C][/ROW]
[ROW][C]Trimmed Mean ( 16 / 24 )[/C][C]1586.51219512195[/C][C]14.8741108343068[/C][C]106.662657875501[/C][/ROW]
[ROW][C]Trimmed Mean ( 17 / 24 )[/C][C]1585.89743589744[/C][C]14.1306223149043[/C][C]112.231252138465[/C][/ROW]
[ROW][C]Trimmed Mean ( 18 / 24 )[/C][C]1585.56756756757[/C][C]13.2709430237474[/C][C]119.476631369022[/C][/ROW]
[ROW][C]Trimmed Mean ( 19 / 24 )[/C][C]1585.34285714286[/C][C]12.5706034870571[/C][C]126.115095331354[/C][/ROW]
[ROW][C]Trimmed Mean ( 20 / 24 )[/C][C]1584.78787878788[/C][C]11.8763163206453[/C][C]133.441029693100[/C][/ROW]
[ROW][C]Trimmed Mean ( 21 / 24 )[/C][C]1583.80645161290[/C][C]11.1032707914592[/C][C]142.643233814598[/C][/ROW]
[ROW][C]Trimmed Mean ( 22 / 24 )[/C][C]1582.86206896552[/C][C]10.7157317409346[/C][C]147.713857273873[/C][/ROW]
[ROW][C]Trimmed Mean ( 23 / 24 )[/C][C]1581.85185185185[/C][C]10.2820208894850[/C][C]153.846395456126[/C][/ROW]
[ROW][C]Trimmed Mean ( 24 / 24 )[/C][C]1580.96[/C][C]9.84081297454636[/C][C]160.653393585389[/C][/ROW]
[ROW][C]Median[/C][C]1586[/C][C][/C][C][/C][/ROW]
[ROW][C]Midrange[/C][C]1817[/C][C][/C][C][/C][/ROW]
[ROW][C]Midmean - Weighted Average at Xnp[/C][C]1581.22222222222[/C][C][/C][C][/C][/ROW]
[ROW][C]Midmean - Weighted Average at X(n+1)p[/C][C]1585.56756756757[/C][C][/C][C][/C][/ROW]
[ROW][C]Midmean - Empirical Distribution Function[/C][C]1585.56756756757[/C][C][/C][C][/C][/ROW]
[ROW][C]Midmean - Empirical Distribution Function - Averaging[/C][C]1585.56756756757[/C][C][/C][C][/C][/ROW]
[ROW][C]Midmean - Empirical Distribution Function - Interpolation[/C][C]1585.56756756757[/C][C][/C][C][/C][/ROW]
[ROW][C]Midmean - Closest Observation[/C][C]1581.13157894737[/C][C][/C][C][/C][/ROW]
[ROW][C]Midmean - True Basic - Statistics Graphics Toolkit[/C][C]1585.56756756757[/C][C][/C][C][/C][/ROW]
[ROW][C]Midmean - MS Excel (old versions)[/C][C]1585.56756756757[/C][C][/C][C][/C][/ROW]
[ROW][C]Number of observations[/C][C]73[/C][C][/C][C][/C][/ROW]
[/TABLE]
Source: https://freestatistics.org/blog/index.php?pk=41024&T=1

Globally Unique Identifier (entire table): ba.freestatistics.org/blog/index.php?pk=41024&T=1

As an alternative you can also use a QR Code:  

The GUIDs for individual cells are displayed in the table below:

Central Tendency - Ungrouped Data
MeasureValueS.E.Value/S.E.
Arithmetic Mean1607.8493150684928.885234988085655.6633628125819
Geometric Mean1590.05610111604
Harmonic Mean1572.88283733962
Quadratic Mean1626.42341030528
Winsorized Mean ( 1 / 24 )1603.3561643835625.921174635197861.8550735816732
Winsorized Mean ( 2 / 24 )1603.3561643835625.908590997329461.8851161975126
Winsorized Mean ( 3 / 24 )1605.0410958904125.564378684364062.7842794736922
Winsorized Mean ( 4 / 24 )1602.1917808219224.834127485189164.515726665954
Winsorized Mean ( 5 / 24 )1597.0547945205523.307821101713968.5201241055997
Winsorized Mean ( 6 / 24 )1597.9589041095923.044993037380469.3408282448862
Winsorized Mean ( 7 / 24 )1599.8767123287721.954896559877072.8710658219438
Winsorized Mean ( 8 / 24 )1599.2191780821921.004024461943676.1387028938078
Winsorized Mean ( 9 / 24 )1597.8630136986320.451396842921878.129774018426
Winsorized Mean ( 10 / 24 )1597.7260273972620.146526229852379.3052861405861
Winsorized Mean ( 11 / 24 )1598.1780821917819.421762245771182.2880056900998
Winsorized Mean ( 12 / 24 )1593.5753424657518.564881883508985.8381622067479
Winsorized Mean ( 13 / 24 )1590.5479452054817.778090952653289.4667458638523
Winsorized Mean ( 14 / 24 )1591.6986301369917.421105974747291.3661068616558
Winsorized Mean ( 15 / 24 )1590.6712328767116.935739577472593.923930844602
Winsorized Mean ( 16 / 24 )1591.7671232876716.501551061131096.4616669906284
Winsorized Mean ( 17 / 24 )1588.7397260274015.954201330856599.5812759962274
Winsorized Mean ( 18 / 24 )1587.5068493150714.2820059442948111.154333327331
Winsorized Mean ( 19 / 24 )1590.1095890411013.2951874660694119.600388719543
Winsorized Mean ( 20 / 24 )1593.1232876712312.5598255606803126.842787742105
Winsorized Mean ( 21 / 24 )1591.6849315068510.315234494471154.304289675625
Winsorized Mean ( 22 / 24 )1591.082191780829.813999905717162.123721934617
Winsorized Mean ( 23 / 24 )1588.876712328779.15675980236396173.519536017377
Winsorized Mean ( 24 / 24 )1585.260273972608.56424435391703185.102176965274
Trimmed Mean ( 1 / 24 )1601.9577464788725.208965195047563.5471442038243
Trimmed Mean ( 2 / 24 )1600.4782608695724.362945540021265.6931346105275
Trimmed Mean ( 3 / 24 )1598.9104477611923.359332268815168.4484654510333
Trimmed Mean ( 4 / 24 )1596.6153846153822.311967428547071.5587000442012
Trimmed Mean ( 5 / 24 )159521.332733286492174.7677280065165
Trimmed Mean ( 6 / 24 )1594.5081967213120.658101824983377.185610286467
Trimmed Mean ( 7 / 24 )1593.7966101694919.912576016490680.0396999790277
Trimmed Mean ( 8 / 24 )1592.6842105263219.294530856869282.5458894202288
Trimmed Mean ( 9 / 24 )1591.618.771631293367784.7875166055673
Trimmed Mean ( 10 / 24 )1590.6415094339618.252822402181887.1449617152813
Trimmed Mean ( 11 / 24 )1589.6274509803917.671001187484889.9568413874716
Trimmed Mean ( 12 / 24 )1588.4693877551017.101589764805192.8843113184807
Trimmed Mean ( 13 / 24 )1587.8085106383016.57630684053895.7878329541566
Trimmed Mean ( 14 / 24 )1587.4666666666716.079430363295998.726548814213
Trimmed Mean ( 15 / 24 )1586.9534883720915.5098994389802102.318747753044
Trimmed Mean ( 16 / 24 )1586.5121951219514.8741108343068106.662657875501
Trimmed Mean ( 17 / 24 )1585.8974358974414.1306223149043112.231252138465
Trimmed Mean ( 18 / 24 )1585.5675675675713.2709430237474119.476631369022
Trimmed Mean ( 19 / 24 )1585.3428571428612.5706034870571126.115095331354
Trimmed Mean ( 20 / 24 )1584.7878787878811.8763163206453133.441029693100
Trimmed Mean ( 21 / 24 )1583.8064516129011.1032707914592142.643233814598
Trimmed Mean ( 22 / 24 )1582.8620689655210.7157317409346147.713857273873
Trimmed Mean ( 23 / 24 )1581.8518518518510.2820208894850153.846395456126
Trimmed Mean ( 24 / 24 )1580.969.84081297454636160.653393585389
Median1586
Midrange1817
Midmean - Weighted Average at Xnp1581.22222222222
Midmean - Weighted Average at X(n+1)p1585.56756756757
Midmean - Empirical Distribution Function1585.56756756757
Midmean - Empirical Distribution Function - Averaging1585.56756756757
Midmean - Empirical Distribution Function - Interpolation1585.56756756757
Midmean - Closest Observation1581.13157894737
Midmean - True Basic - Statistics Graphics Toolkit1585.56756756757
Midmean - MS Excel (old versions)1585.56756756757
Number of observations73


Parameters (Session):
Parameters (R input):
R code (references can be found in the software module):
geomean <- function(x) {
return(exp(mean(log(x))))
}
harmean <- function(x) {
return(1/mean(1/x))
}
quamean <- function(x) {
return(sqrt(mean(x*x)))
}
winmean <- function(x) {
x <-sort(x[!is.na(x)])
n<-length(x)
denom <- 3
nodenom <- n/denom
if (nodenom>40) denom <- n/40
sqrtn = sqrt(n)
roundnodenom = floor(nodenom)
win <- array(NA,dim=c(roundnodenom,2))
for (j in 1:roundnodenom) {
win[j,1] <- (j*x[j+1]+sum(x[(j+1):(n-j)])+j*x[n-j])/n
win[j,2] <- sd(c(rep(x[j+1],j),x[(j+1):(n-j)],rep(x[n-j],j)))/sqrtn
}
return(win)
}
trimean <- function(x) {
x <-sort(x[!is.na(x)])
n<-length(x)
denom <- 3
nodenom <- n/denom
if (nodenom>40) denom <- n/40
sqrtn = sqrt(n)
roundnodenom = floor(nodenom)
tri <- array(NA,dim=c(roundnodenom,2))
for (j in 1:roundnodenom) {
tri[j,1] <- mean(x,trim=j/n)
tri[j,2] <- sd(x[(j+1):(n-j)]) / sqrt(n-j*2)
}
return(tri)
}
midrange <- function(x) {
return((max(x)+min(x))/2)
}
q1 <- function(data,n,p,i,f) {
np <- n*p;
i <<- floor(np)
f <<- np - i
qvalue <- (1-f)*data[i] + f*data[i+1]
}
q2 <- function(data,n,p,i,f) {
np <- (n+1)*p
i <<- floor(np)
f <<- np - i
qvalue <- (1-f)*data[i] + f*data[i+1]
}
q3 <- function(data,n,p,i,f) {
np <- n*p
i <<- floor(np)
f <<- np - i
if (f==0) {
qvalue <- data[i]
} else {
qvalue <- data[i+1]
}
}
q4 <- function(data,n,p,i,f) {
np <- n*p
i <<- floor(np)
f <<- np - i
if (f==0) {
qvalue <- (data[i]+data[i+1])/2
} else {
qvalue <- data[i+1]
}
}
q5 <- function(data,n,p,i,f) {
np <- (n-1)*p
i <<- floor(np)
f <<- np - i
if (f==0) {
qvalue <- data[i+1]
} else {
qvalue <- data[i+1] + f*(data[i+2]-data[i+1])
}
}
q6 <- function(data,n,p,i,f) {
np <- n*p+0.5
i <<- floor(np)
f <<- np - i
qvalue <- data[i]
}
q7 <- function(data,n,p,i,f) {
np <- (n+1)*p
i <<- floor(np)
f <<- np - i
if (f==0) {
qvalue <- data[i]
} else {
qvalue <- f*data[i] + (1-f)*data[i+1]
}
}
q8 <- function(data,n,p,i,f) {
np <- (n+1)*p
i <<- floor(np)
f <<- np - i
if (f==0) {
qvalue <- data[i]
} else {
if (f == 0.5) {
qvalue <- (data[i]+data[i+1])/2
} else {
if (f < 0.5) {
qvalue <- data[i]
} else {
qvalue <- data[i+1]
}
}
}
}
midmean <- function(x,def) {
x <-sort(x[!is.na(x)])
n<-length(x)
if (def==1) {
qvalue1 <- q1(x,n,0.25,i,f)
qvalue3 <- q1(x,n,0.75,i,f)
}
if (def==2) {
qvalue1 <- q2(x,n,0.25,i,f)
qvalue3 <- q2(x,n,0.75,i,f)
}
if (def==3) {
qvalue1 <- q3(x,n,0.25,i,f)
qvalue3 <- q3(x,n,0.75,i,f)
}
if (def==4) {
qvalue1 <- q4(x,n,0.25,i,f)
qvalue3 <- q4(x,n,0.75,i,f)
}
if (def==5) {
qvalue1 <- q5(x,n,0.25,i,f)
qvalue3 <- q5(x,n,0.75,i,f)
}
if (def==6) {
qvalue1 <- q6(x,n,0.25,i,f)
qvalue3 <- q6(x,n,0.75,i,f)
}
if (def==7) {
qvalue1 <- q7(x,n,0.25,i,f)
qvalue3 <- q7(x,n,0.75,i,f)
}
if (def==8) {
qvalue1 <- q8(x,n,0.25,i,f)
qvalue3 <- q8(x,n,0.75,i,f)
}
midm <- 0
myn <- 0
roundno4 <- round(n/4)
round3no4 <- round(3*n/4)
for (i in 1:n) {
if ((x[i]>=qvalue1) & (x[i]<=qvalue3)){
midm = midm + x[i]
myn = myn + 1
}
}
midm = midm / myn
return(midm)
}
(arm <- mean(x))
sqrtn <- sqrt(length(x))
(armse <- sd(x) / sqrtn)
(armose <- arm / armse)
(geo <- geomean(x))
(har <- harmean(x))
(qua <- quamean(x))
(win <- winmean(x))
(tri <- trimean(x))
(midr <- midrange(x))
midm <- array(NA,dim=8)
for (j in 1:8) midm[j] <- midmean(x,j)
midm
bitmap(file='test1.png')
lb <- win[,1] - 2*win[,2]
ub <- win[,1] + 2*win[,2]
if ((ylimmin == '') | (ylimmax == '')) plot(win[,1],type='b',main=main, xlab='j', pch=19, ylab='Winsorized Mean(j/n)', ylim=c(min(lb),max(ub))) else plot(win[,1],type='l',main=main, xlab='j', pch=19, ylab='Winsorized Mean(j/n)', ylim=c(ylimmin,ylimmax))
lines(ub,lty=3)
lines(lb,lty=3)
grid()
dev.off()
bitmap(file='test2.png')
lb <- tri[,1] - 2*tri[,2]
ub <- tri[,1] + 2*tri[,2]
if ((ylimmin == '') | (ylimmax == '')) plot(tri[,1],type='b',main=main, xlab='j', pch=19, ylab='Trimmed Mean(j/n)', ylim=c(min(lb),max(ub))) else plot(tri[,1],type='l',main=main, xlab='j', pch=19, ylab='Trimmed Mean(j/n)', ylim=c(ylimmin,ylimmax))
lines(ub,lty=3)
lines(lb,lty=3)
grid()
dev.off()
load(file='createtable')
a<-table.start()
a<-table.row.start(a)
a<-table.element(a,'Central Tendency - Ungrouped Data',4,TRUE)
a<-table.row.end(a)
a<-table.row.start(a)
a<-table.element(a,'Measure',header=TRUE)
a<-table.element(a,'Value',header=TRUE)
a<-table.element(a,'S.E.',header=TRUE)
a<-table.element(a,'Value/S.E.',header=TRUE)
a<-table.row.end(a)
a<-table.row.start(a)
a<-table.element(a,hyperlink('arithmetic_mean.htm', 'Arithmetic Mean', 'click to view the definition of the Arithmetic Mean'),header=TRUE)
a<-table.element(a,arm)
a<-table.element(a,hyperlink('arithmetic_mean_standard_error.htm', armse, 'click to view the definition of the Standard Error of the Arithmetic Mean'))
a<-table.element(a,armose)
a<-table.row.end(a)
a<-table.row.start(a)
a<-table.element(a,hyperlink('geometric_mean.htm', 'Geometric Mean', 'click to view the definition of the Geometric Mean'),header=TRUE)
a<-table.element(a,geo)
a<-table.element(a,'')
a<-table.row.end(a)
a<-table.row.start(a)
a<-table.element(a,hyperlink('harmonic_mean.htm', 'Harmonic Mean', 'click to view the definition of the Harmonic Mean'),header=TRUE)
a<-table.element(a,har)
a<-table.element(a,'')
a<-table.row.end(a)
a<-table.row.start(a)
a<-table.element(a,hyperlink('quadratic_mean.htm', 'Quadratic Mean', 'click to view the definition of the Quadratic Mean'),header=TRUE)
a<-table.element(a,qua)
a<-table.element(a,'')
a<-table.row.end(a)
for (j in 1:length(win[,1])) {
a<-table.row.start(a)
mylabel <- paste('Winsorized Mean (',j)
mylabel <- paste(mylabel,'/')
mylabel <- paste(mylabel,length(win[,1]))
mylabel <- paste(mylabel,')')
a<-table.element(a,hyperlink('winsorized_mean.htm', mylabel, 'click to view the definition of the Winsorized Mean'),header=TRUE)
a<-table.element(a,win[j,1])
a<-table.element(a,win[j,2])
a<-table.element(a,win[j,1]/win[j,2])
a<-table.row.end(a)
}
for (j in 1:length(tri[,1])) {
a<-table.row.start(a)
mylabel <- paste('Trimmed Mean (',j)
mylabel <- paste(mylabel,'/')
mylabel <- paste(mylabel,length(tri[,1]))
mylabel <- paste(mylabel,')')
a<-table.element(a,hyperlink('arithmetic_mean.htm', mylabel, 'click to view the definition of the Trimmed Mean'),header=TRUE)
a<-table.element(a,tri[j,1])
a<-table.element(a,tri[j,2])
a<-table.element(a,tri[j,1]/tri[j,2])
a<-table.row.end(a)
}
a<-table.row.start(a)
a<-table.element(a,hyperlink('median_1.htm', 'Median', 'click to view the definition of the Median'),header=TRUE)
a<-table.element(a,median(x))
a<-table.element(a,'')
a<-table.row.end(a)
a<-table.row.start(a)
a<-table.element(a,hyperlink('midrange.htm', 'Midrange', 'click to view the definition of the Midrange'),header=TRUE)
a<-table.element(a,midr)
a<-table.element(a,'')
a<-table.row.end(a)
a<-table.row.start(a)
mymid <- hyperlink('midmean.htm', 'Midmean', 'click to view the definition of the Midmean')
mylabel <- paste(mymid,hyperlink('method_1.htm','Weighted Average at Xnp',''),sep=' - ')
a<-table.element(a,mylabel,header=TRUE)
a<-table.element(a,midm[1])
a<-table.element(a,'')
a<-table.row.end(a)
a<-table.row.start(a)
mymid <- hyperlink('midmean.htm', 'Midmean', 'click to view the definition of the Midmean')
mylabel <- paste(mymid,hyperlink('method_2.htm','Weighted Average at X(n+1)p',''),sep=' - ')
a<-table.element(a,mylabel,header=TRUE)
a<-table.element(a,midm[2])
a<-table.element(a,'')
a<-table.row.end(a)
a<-table.row.start(a)
mymid <- hyperlink('midmean.htm', 'Midmean', 'click to view the definition of the Midmean')
mylabel <- paste(mymid,hyperlink('method_3.htm','Empirical Distribution Function',''),sep=' - ')
a<-table.element(a,mylabel,header=TRUE)
a<-table.element(a,midm[3])
a<-table.element(a,'')
a<-table.row.end(a)
a<-table.row.start(a)
mymid <- hyperlink('midmean.htm', 'Midmean', 'click to view the definition of the Midmean')
mylabel <- paste(mymid,hyperlink('method_4.htm','Empirical Distribution Function - Averaging',''),sep=' - ')
a<-table.element(a,mylabel,header=TRUE)
a<-table.element(a,midm[4])
a<-table.element(a,'')
a<-table.row.end(a)
a<-table.row.start(a)
mymid <- hyperlink('midmean.htm', 'Midmean', 'click to view the definition of the Midmean')
mylabel <- paste(mymid,hyperlink('method_5.htm','Empirical Distribution Function - Interpolation',''),sep=' - ')
a<-table.element(a,mylabel,header=TRUE)
a<-table.element(a,midm[5])
a<-table.element(a,'')
a<-table.row.end(a)
a<-table.row.start(a)
mymid <- hyperlink('midmean.htm', 'Midmean', 'click to view the definition of the Midmean')
mylabel <- paste(mymid,hyperlink('method_6.htm','Closest Observation',''),sep=' - ')
a<-table.element(a,mylabel,header=TRUE)
a<-table.element(a,midm[6])
a<-table.element(a,'')
a<-table.row.end(a)
a<-table.row.start(a)
mymid <- hyperlink('midmean.htm', 'Midmean', 'click to view the definition of the Midmean')
mylabel <- paste(mymid,hyperlink('method_7.htm','True Basic - Statistics Graphics Toolkit',''),sep=' - ')
a<-table.element(a,mylabel,header=TRUE)
a<-table.element(a,midm[7])
a<-table.element(a,'')
a<-table.row.end(a)
a<-table.row.start(a)
mymid <- hyperlink('midmean.htm', 'Midmean', 'click to view the definition of the Midmean')
mylabel <- paste(mymid,hyperlink('method_8.htm','MS Excel (old versions)',''),sep=' - ')
a<-table.element(a,mylabel,header=TRUE)
a<-table.element(a,midm[8])
a<-table.element(a,'')
a<-table.row.end(a)
a<-table.row.start(a)
a<-table.element(a,'Number of observations',header=TRUE)
a<-table.element(a,length(x))
a<-table.element(a,'')
a<-table.row.end(a)
a<-table.end(a)
table.save(a,file='mytable.tab')