Free Statistics

of Irreproducible Research!

Author's title

Author*Unverified author*
R Software Modulerwasp_centraltendency.wasp
Title produced by softwareCentral Tendency
Date of computationMon, 01 Jun 2009 11:36:34 -0600
Cite this page as followsStatistical Computations at FreeStatistics.org, Office for Research Development and Education, URL https://freestatistics.org/blog/index.php?v=date/2009/Jun/01/t1243877822ziatswvyk7bq4hi.htm/, Retrieved Mon, 13 May 2024 06:34:22 +0000
Statistical Computations at FreeStatistics.org, Office for Research Development and Education, URL https://freestatistics.org/blog/index.php?pk=41021, Retrieved Mon, 13 May 2024 06:34:22 +0000
QR Codes:

Original text written by user:
IsPrivate?No (this computation is public)
User-defined keywords
Estimated Impact103
Family? (F = Feedback message, R = changed R code, M = changed R Module, P = changed Parameters, D = changed Data)
-       [Central Tendency] [Central Tendency ...] [2009-06-01 17:36:34] [8066ce735b3f8beadb711a8680cf7d00] [Current]
Feedback Forum

Post a new message
Dataseries X:
517
510
509
501
507
569
580
578
565
547
555
562
561
555
544
537
543
594
611
613
611
594
595
591
589
584
573
567
569
621
629
628
612
595
597
593
590
580
574
573
573
620
626
620
588
566
557
561
549
532
526
511
499
555
565
542
527
510
514
517
508
493
490
469
478
528
534
518
506
502
516
528


Summary of computational transaction
Raw Inputview raw input (R code)
Raw Outputview raw output of R engine
Computing time2 seconds
R Server'George Udny Yule' @ 72.249.76.132

\begin{tabular}{lllllllll}
\hline
Summary of computational transaction \tabularnewline
Raw Input & view raw input (R code)  \tabularnewline
Raw Output & view raw output of R engine  \tabularnewline
Computing time & 2 seconds \tabularnewline
R Server & 'George Udny Yule' @ 72.249.76.132 \tabularnewline
\hline
\end{tabular}
%Source: https://freestatistics.org/blog/index.php?pk=41021&T=0

[TABLE]
[ROW][C]Summary of computational transaction[/C][/ROW]
[ROW][C]Raw Input[/C][C]view raw input (R code) [/C][/ROW]
[ROW][C]Raw Output[/C][C]view raw output of R engine [/C][/ROW]
[ROW][C]Computing time[/C][C]2 seconds[/C][/ROW]
[ROW][C]R Server[/C][C]'George Udny Yule' @ 72.249.76.132[/C][/ROW]
[/TABLE]
Source: https://freestatistics.org/blog/index.php?pk=41021&T=0

Globally Unique Identifier (entire table): ba.freestatistics.org/blog/index.php?pk=41021&T=0

As an alternative you can also use a QR Code:  

The GUIDs for individual cells are displayed in the table below:

Summary of computational transaction
Raw Inputview raw input (R code)
Raw Outputview raw output of R engine
Computing time2 seconds
R Server'George Udny Yule' @ 72.249.76.132


Central Tendency - Ungrouped Data
MeasureValueS.E.Value/S.E.
Arithmetic Mean556.2638888888894.80882539347478115.675626244134
Geometric Mean554.777760333594
Harmonic Mean553.282958280402
Quadratic Mean557.737729582642
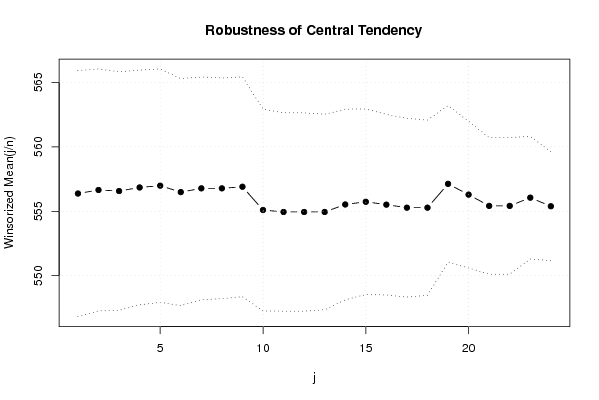
Winsorized Mean ( 1 / 24 )556.3754.77545225594669116.507289818921
Winsorized Mean ( 2 / 24 )556.6527777777784.69188189960786118.641685721949
Winsorized Mean ( 3 / 24 )556.5694444444444.62514333360306120.335610012516
Winsorized Mean ( 4 / 24 )556.8472222222224.55215213862643122.326144923233
Winsorized Mean ( 5 / 24 )556.9861111111114.52762746133349123.019421511121
Winsorized Mean ( 6 / 24 )556.4861111111114.4031480173905126.383693873846
Winsorized Mean ( 7 / 24 )556.7777777777784.3195076582083128.898435153771
Winsorized Mean ( 8 / 24 )556.7777777777784.28129745657406130.048842301959
Winsorized Mean ( 9 / 24 )556.9027777777784.26095934493754130.698918411281
Winsorized Mean ( 10 / 24 )555.0972222222223.91673707469540141.724402643338
Winsorized Mean ( 11 / 24 )554.9444444444443.84606422858823144.288917569155
Winsorized Mean ( 12 / 24 )554.9444444444443.84606422858823144.288917569155
Winsorized Mean ( 13 / 24 )554.9444444444443.79011609366753146.418851225068
Winsorized Mean ( 14 / 24 )555.5277777777783.69631484534586150.292331963350
Winsorized Mean ( 15 / 24 )555.7361111111113.60050167428865154.349632741362
Winsorized Mean ( 16 / 24 )555.5138888888893.50189938711980158.632167141096
Winsorized Mean ( 17 / 24 )555.2777777777783.46840322060641160.096085276006
Winsorized Mean ( 18 / 24 )555.2777777777783.39452185840536163.580557421607
Winsorized Mean ( 19 / 24 )557.1253.0411842822839183.193436598194
Winsorized Mean ( 20 / 24 )556.2916666666672.84528255621935195.513681216193
Winsorized Mean ( 21 / 24 )555.4166666666672.64639817821957209.876454434508
Winsorized Mean ( 22 / 24 )555.4166666666672.64639817821957209.876454434508
Winsorized Mean ( 23 / 24 )556.0555555555562.37874068227804233.760476582525
Winsorized Mean ( 24 / 24 )555.3888888888892.11425924566634262.687222499931
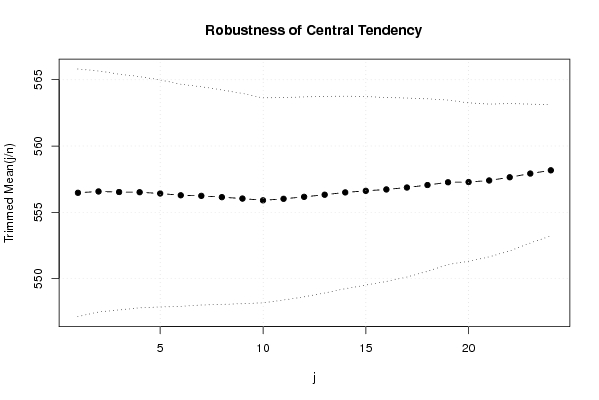
Trimmed Mean ( 1 / 24 )556.4714285714294.6693007101237119.176609757628
Trimmed Mean ( 2 / 24 )556.5735294117654.54300087711612122.512309477051
Trimmed Mean ( 3 / 24 )556.5303030303034.44543293556446125.191474283176
Trimmed Mean ( 4 / 24 )556.5156254.35827256783529127.691789886472
Trimmed Mean ( 5 / 24 )556.419354838714.27897769629402130.035581938326
Trimmed Mean ( 6 / 24 )556.2833333333334.18944676758826132.782050755969
Trimmed Mean ( 7 / 24 )556.2413793103454.11453610351679135.189330052278
Trimmed Mean ( 8 / 24 )556.1428571428574.04258408512961137.571129117287
Trimmed Mean ( 9 / 24 )556.0370370370373.96128741919145140.367758810728
Trimmed Mean ( 10 / 24 )555.9038461538463.86326041150184143.894997214992
Trimmed Mean ( 11 / 24 )556.023.81677179548051145.678083415516
Trimmed Mean ( 12 / 24 )556.1666666666673.76931589506436147.551089415171
Trimmed Mean ( 13 / 24 )556.3260869565223.70481529562692150.162975091686
Trimmed Mean ( 14 / 24 )556.53.63045900102722153.286402585056
Trimmed Mean ( 15 / 24 )556.6190476190483.55183163900186156.713240995699
Trimmed Mean ( 16 / 24 )556.7253.46687391515609160.584149762751
Trimmed Mean ( 17 / 24 )556.8684210526323.37301040932014165.095375784764
Trimmed Mean ( 18 / 24 )557.0555555555563.2498948565274171.407254741399
Trimmed Mean ( 19 / 24 )557.2647058823533.09686427098229179.944827128506
Trimmed Mean ( 20 / 24 )557.281252.98491988565695186.698896904346
Trimmed Mean ( 21 / 24 )557.42.87821783939897193.661505522597
Trimmed Mean ( 22 / 24 )557.6428571428572.77708608168063200.801430255048
Trimmed Mean ( 23 / 24 )557.9230769230772.61647036286737213.235007298784
Trimmed Mean ( 24 / 24 )558.1666666666672.47206616236522225.789533938940
Median561
Midrange549
Midmean - Weighted Average at Xnp554.947368421053
Midmean - Weighted Average at X(n+1)p557.055555555556
Midmean - Empirical Distribution Function554.947368421053
Midmean - Empirical Distribution Function - Averaging557.055555555556
Midmean - Empirical Distribution Function - Interpolation557.055555555556
Midmean - Closest Observation554.947368421053
Midmean - True Basic - Statistics Graphics Toolkit557.055555555556
Midmean - MS Excel (old versions)555.846153846154
Number of observations72

\begin{tabular}{lllllllll}
\hline
Central Tendency - Ungrouped Data \tabularnewline
Measure & Value & S.E. & Value/S.E. \tabularnewline
Arithmetic Mean & 556.263888888889 & 4.80882539347478 & 115.675626244134 \tabularnewline
Geometric Mean & 554.777760333594 &  &  \tabularnewline
Harmonic Mean & 553.282958280402 &  &  \tabularnewline
Quadratic Mean & 557.737729582642 &  &  \tabularnewline
Winsorized Mean ( 1 / 24 ) & 556.375 & 4.77545225594669 & 116.507289818921 \tabularnewline
Winsorized Mean ( 2 / 24 ) & 556.652777777778 & 4.69188189960786 & 118.641685721949 \tabularnewline
Winsorized Mean ( 3 / 24 ) & 556.569444444444 & 4.62514333360306 & 120.335610012516 \tabularnewline
Winsorized Mean ( 4 / 24 ) & 556.847222222222 & 4.55215213862643 & 122.326144923233 \tabularnewline
Winsorized Mean ( 5 / 24 ) & 556.986111111111 & 4.52762746133349 & 123.019421511121 \tabularnewline
Winsorized Mean ( 6 / 24 ) & 556.486111111111 & 4.4031480173905 & 126.383693873846 \tabularnewline
Winsorized Mean ( 7 / 24 ) & 556.777777777778 & 4.3195076582083 & 128.898435153771 \tabularnewline
Winsorized Mean ( 8 / 24 ) & 556.777777777778 & 4.28129745657406 & 130.048842301959 \tabularnewline
Winsorized Mean ( 9 / 24 ) & 556.902777777778 & 4.26095934493754 & 130.698918411281 \tabularnewline
Winsorized Mean ( 10 / 24 ) & 555.097222222222 & 3.91673707469540 & 141.724402643338 \tabularnewline
Winsorized Mean ( 11 / 24 ) & 554.944444444444 & 3.84606422858823 & 144.288917569155 \tabularnewline
Winsorized Mean ( 12 / 24 ) & 554.944444444444 & 3.84606422858823 & 144.288917569155 \tabularnewline
Winsorized Mean ( 13 / 24 ) & 554.944444444444 & 3.79011609366753 & 146.418851225068 \tabularnewline
Winsorized Mean ( 14 / 24 ) & 555.527777777778 & 3.69631484534586 & 150.292331963350 \tabularnewline
Winsorized Mean ( 15 / 24 ) & 555.736111111111 & 3.60050167428865 & 154.349632741362 \tabularnewline
Winsorized Mean ( 16 / 24 ) & 555.513888888889 & 3.50189938711980 & 158.632167141096 \tabularnewline
Winsorized Mean ( 17 / 24 ) & 555.277777777778 & 3.46840322060641 & 160.096085276006 \tabularnewline
Winsorized Mean ( 18 / 24 ) & 555.277777777778 & 3.39452185840536 & 163.580557421607 \tabularnewline
Winsorized Mean ( 19 / 24 ) & 557.125 & 3.0411842822839 & 183.193436598194 \tabularnewline
Winsorized Mean ( 20 / 24 ) & 556.291666666667 & 2.84528255621935 & 195.513681216193 \tabularnewline
Winsorized Mean ( 21 / 24 ) & 555.416666666667 & 2.64639817821957 & 209.876454434508 \tabularnewline
Winsorized Mean ( 22 / 24 ) & 555.416666666667 & 2.64639817821957 & 209.876454434508 \tabularnewline
Winsorized Mean ( 23 / 24 ) & 556.055555555556 & 2.37874068227804 & 233.760476582525 \tabularnewline
Winsorized Mean ( 24 / 24 ) & 555.388888888889 & 2.11425924566634 & 262.687222499931 \tabularnewline
Trimmed Mean ( 1 / 24 ) & 556.471428571429 & 4.6693007101237 & 119.176609757628 \tabularnewline
Trimmed Mean ( 2 / 24 ) & 556.573529411765 & 4.54300087711612 & 122.512309477051 \tabularnewline
Trimmed Mean ( 3 / 24 ) & 556.530303030303 & 4.44543293556446 & 125.191474283176 \tabularnewline
Trimmed Mean ( 4 / 24 ) & 556.515625 & 4.35827256783529 & 127.691789886472 \tabularnewline
Trimmed Mean ( 5 / 24 ) & 556.41935483871 & 4.27897769629402 & 130.035581938326 \tabularnewline
Trimmed Mean ( 6 / 24 ) & 556.283333333333 & 4.18944676758826 & 132.782050755969 \tabularnewline
Trimmed Mean ( 7 / 24 ) & 556.241379310345 & 4.11453610351679 & 135.189330052278 \tabularnewline
Trimmed Mean ( 8 / 24 ) & 556.142857142857 & 4.04258408512961 & 137.571129117287 \tabularnewline
Trimmed Mean ( 9 / 24 ) & 556.037037037037 & 3.96128741919145 & 140.367758810728 \tabularnewline
Trimmed Mean ( 10 / 24 ) & 555.903846153846 & 3.86326041150184 & 143.894997214992 \tabularnewline
Trimmed Mean ( 11 / 24 ) & 556.02 & 3.81677179548051 & 145.678083415516 \tabularnewline
Trimmed Mean ( 12 / 24 ) & 556.166666666667 & 3.76931589506436 & 147.551089415171 \tabularnewline
Trimmed Mean ( 13 / 24 ) & 556.326086956522 & 3.70481529562692 & 150.162975091686 \tabularnewline
Trimmed Mean ( 14 / 24 ) & 556.5 & 3.63045900102722 & 153.286402585056 \tabularnewline
Trimmed Mean ( 15 / 24 ) & 556.619047619048 & 3.55183163900186 & 156.713240995699 \tabularnewline
Trimmed Mean ( 16 / 24 ) & 556.725 & 3.46687391515609 & 160.584149762751 \tabularnewline
Trimmed Mean ( 17 / 24 ) & 556.868421052632 & 3.37301040932014 & 165.095375784764 \tabularnewline
Trimmed Mean ( 18 / 24 ) & 557.055555555556 & 3.2498948565274 & 171.407254741399 \tabularnewline
Trimmed Mean ( 19 / 24 ) & 557.264705882353 & 3.09686427098229 & 179.944827128506 \tabularnewline
Trimmed Mean ( 20 / 24 ) & 557.28125 & 2.98491988565695 & 186.698896904346 \tabularnewline
Trimmed Mean ( 21 / 24 ) & 557.4 & 2.87821783939897 & 193.661505522597 \tabularnewline
Trimmed Mean ( 22 / 24 ) & 557.642857142857 & 2.77708608168063 & 200.801430255048 \tabularnewline
Trimmed Mean ( 23 / 24 ) & 557.923076923077 & 2.61647036286737 & 213.235007298784 \tabularnewline
Trimmed Mean ( 24 / 24 ) & 558.166666666667 & 2.47206616236522 & 225.789533938940 \tabularnewline
Median & 561 &  &  \tabularnewline
Midrange & 549 &  &  \tabularnewline
Midmean - Weighted Average at Xnp & 554.947368421053 &  &  \tabularnewline
Midmean - Weighted Average at X(n+1)p & 557.055555555556 &  &  \tabularnewline
Midmean - Empirical Distribution Function & 554.947368421053 &  &  \tabularnewline
Midmean - Empirical Distribution Function - Averaging & 557.055555555556 &  &  \tabularnewline
Midmean - Empirical Distribution Function - Interpolation & 557.055555555556 &  &  \tabularnewline
Midmean - Closest Observation & 554.947368421053 &  &  \tabularnewline
Midmean - True Basic - Statistics Graphics Toolkit & 557.055555555556 &  &  \tabularnewline
Midmean - MS Excel (old versions) & 555.846153846154 &  &  \tabularnewline
Number of observations & 72 &  &  \tabularnewline
\hline
\end{tabular}
%Source: https://freestatistics.org/blog/index.php?pk=41021&T=1

[TABLE]
[ROW][C]Central Tendency - Ungrouped Data[/C][/ROW]
[ROW][C]Measure[/C][C]Value[/C][C]S.E.[/C][C]Value/S.E.[/C][/ROW]
[ROW][C]Arithmetic Mean[/C][C]556.263888888889[/C][C]4.80882539347478[/C][C]115.675626244134[/C][/ROW]
[ROW][C]Geometric Mean[/C][C]554.777760333594[/C][C][/C][C][/C][/ROW]
[ROW][C]Harmonic Mean[/C][C]553.282958280402[/C][C][/C][C][/C][/ROW]
[ROW][C]Quadratic Mean[/C][C]557.737729582642[/C][C][/C][C][/C][/ROW]
[ROW][C]Winsorized Mean ( 1 / 24 )[/C][C]556.375[/C][C]4.77545225594669[/C][C]116.507289818921[/C][/ROW]
[ROW][C]Winsorized Mean ( 2 / 24 )[/C][C]556.652777777778[/C][C]4.69188189960786[/C][C]118.641685721949[/C][/ROW]
[ROW][C]Winsorized Mean ( 3 / 24 )[/C][C]556.569444444444[/C][C]4.62514333360306[/C][C]120.335610012516[/C][/ROW]
[ROW][C]Winsorized Mean ( 4 / 24 )[/C][C]556.847222222222[/C][C]4.55215213862643[/C][C]122.326144923233[/C][/ROW]
[ROW][C]Winsorized Mean ( 5 / 24 )[/C][C]556.986111111111[/C][C]4.52762746133349[/C][C]123.019421511121[/C][/ROW]
[ROW][C]Winsorized Mean ( 6 / 24 )[/C][C]556.486111111111[/C][C]4.4031480173905[/C][C]126.383693873846[/C][/ROW]
[ROW][C]Winsorized Mean ( 7 / 24 )[/C][C]556.777777777778[/C][C]4.3195076582083[/C][C]128.898435153771[/C][/ROW]
[ROW][C]Winsorized Mean ( 8 / 24 )[/C][C]556.777777777778[/C][C]4.28129745657406[/C][C]130.048842301959[/C][/ROW]
[ROW][C]Winsorized Mean ( 9 / 24 )[/C][C]556.902777777778[/C][C]4.26095934493754[/C][C]130.698918411281[/C][/ROW]
[ROW][C]Winsorized Mean ( 10 / 24 )[/C][C]555.097222222222[/C][C]3.91673707469540[/C][C]141.724402643338[/C][/ROW]
[ROW][C]Winsorized Mean ( 11 / 24 )[/C][C]554.944444444444[/C][C]3.84606422858823[/C][C]144.288917569155[/C][/ROW]
[ROW][C]Winsorized Mean ( 12 / 24 )[/C][C]554.944444444444[/C][C]3.84606422858823[/C][C]144.288917569155[/C][/ROW]
[ROW][C]Winsorized Mean ( 13 / 24 )[/C][C]554.944444444444[/C][C]3.79011609366753[/C][C]146.418851225068[/C][/ROW]
[ROW][C]Winsorized Mean ( 14 / 24 )[/C][C]555.527777777778[/C][C]3.69631484534586[/C][C]150.292331963350[/C][/ROW]
[ROW][C]Winsorized Mean ( 15 / 24 )[/C][C]555.736111111111[/C][C]3.60050167428865[/C][C]154.349632741362[/C][/ROW]
[ROW][C]Winsorized Mean ( 16 / 24 )[/C][C]555.513888888889[/C][C]3.50189938711980[/C][C]158.632167141096[/C][/ROW]
[ROW][C]Winsorized Mean ( 17 / 24 )[/C][C]555.277777777778[/C][C]3.46840322060641[/C][C]160.096085276006[/C][/ROW]
[ROW][C]Winsorized Mean ( 18 / 24 )[/C][C]555.277777777778[/C][C]3.39452185840536[/C][C]163.580557421607[/C][/ROW]
[ROW][C]Winsorized Mean ( 19 / 24 )[/C][C]557.125[/C][C]3.0411842822839[/C][C]183.193436598194[/C][/ROW]
[ROW][C]Winsorized Mean ( 20 / 24 )[/C][C]556.291666666667[/C][C]2.84528255621935[/C][C]195.513681216193[/C][/ROW]
[ROW][C]Winsorized Mean ( 21 / 24 )[/C][C]555.416666666667[/C][C]2.64639817821957[/C][C]209.876454434508[/C][/ROW]
[ROW][C]Winsorized Mean ( 22 / 24 )[/C][C]555.416666666667[/C][C]2.64639817821957[/C][C]209.876454434508[/C][/ROW]
[ROW][C]Winsorized Mean ( 23 / 24 )[/C][C]556.055555555556[/C][C]2.37874068227804[/C][C]233.760476582525[/C][/ROW]
[ROW][C]Winsorized Mean ( 24 / 24 )[/C][C]555.388888888889[/C][C]2.11425924566634[/C][C]262.687222499931[/C][/ROW]
[ROW][C]Trimmed Mean ( 1 / 24 )[/C][C]556.471428571429[/C][C]4.6693007101237[/C][C]119.176609757628[/C][/ROW]
[ROW][C]Trimmed Mean ( 2 / 24 )[/C][C]556.573529411765[/C][C]4.54300087711612[/C][C]122.512309477051[/C][/ROW]
[ROW][C]Trimmed Mean ( 3 / 24 )[/C][C]556.530303030303[/C][C]4.44543293556446[/C][C]125.191474283176[/C][/ROW]
[ROW][C]Trimmed Mean ( 4 / 24 )[/C][C]556.515625[/C][C]4.35827256783529[/C][C]127.691789886472[/C][/ROW]
[ROW][C]Trimmed Mean ( 5 / 24 )[/C][C]556.41935483871[/C][C]4.27897769629402[/C][C]130.035581938326[/C][/ROW]
[ROW][C]Trimmed Mean ( 6 / 24 )[/C][C]556.283333333333[/C][C]4.18944676758826[/C][C]132.782050755969[/C][/ROW]
[ROW][C]Trimmed Mean ( 7 / 24 )[/C][C]556.241379310345[/C][C]4.11453610351679[/C][C]135.189330052278[/C][/ROW]
[ROW][C]Trimmed Mean ( 8 / 24 )[/C][C]556.142857142857[/C][C]4.04258408512961[/C][C]137.571129117287[/C][/ROW]
[ROW][C]Trimmed Mean ( 9 / 24 )[/C][C]556.037037037037[/C][C]3.96128741919145[/C][C]140.367758810728[/C][/ROW]
[ROW][C]Trimmed Mean ( 10 / 24 )[/C][C]555.903846153846[/C][C]3.86326041150184[/C][C]143.894997214992[/C][/ROW]
[ROW][C]Trimmed Mean ( 11 / 24 )[/C][C]556.02[/C][C]3.81677179548051[/C][C]145.678083415516[/C][/ROW]
[ROW][C]Trimmed Mean ( 12 / 24 )[/C][C]556.166666666667[/C][C]3.76931589506436[/C][C]147.551089415171[/C][/ROW]
[ROW][C]Trimmed Mean ( 13 / 24 )[/C][C]556.326086956522[/C][C]3.70481529562692[/C][C]150.162975091686[/C][/ROW]
[ROW][C]Trimmed Mean ( 14 / 24 )[/C][C]556.5[/C][C]3.63045900102722[/C][C]153.286402585056[/C][/ROW]
[ROW][C]Trimmed Mean ( 15 / 24 )[/C][C]556.619047619048[/C][C]3.55183163900186[/C][C]156.713240995699[/C][/ROW]
[ROW][C]Trimmed Mean ( 16 / 24 )[/C][C]556.725[/C][C]3.46687391515609[/C][C]160.584149762751[/C][/ROW]
[ROW][C]Trimmed Mean ( 17 / 24 )[/C][C]556.868421052632[/C][C]3.37301040932014[/C][C]165.095375784764[/C][/ROW]
[ROW][C]Trimmed Mean ( 18 / 24 )[/C][C]557.055555555556[/C][C]3.2498948565274[/C][C]171.407254741399[/C][/ROW]
[ROW][C]Trimmed Mean ( 19 / 24 )[/C][C]557.264705882353[/C][C]3.09686427098229[/C][C]179.944827128506[/C][/ROW]
[ROW][C]Trimmed Mean ( 20 / 24 )[/C][C]557.28125[/C][C]2.98491988565695[/C][C]186.698896904346[/C][/ROW]
[ROW][C]Trimmed Mean ( 21 / 24 )[/C][C]557.4[/C][C]2.87821783939897[/C][C]193.661505522597[/C][/ROW]
[ROW][C]Trimmed Mean ( 22 / 24 )[/C][C]557.642857142857[/C][C]2.77708608168063[/C][C]200.801430255048[/C][/ROW]
[ROW][C]Trimmed Mean ( 23 / 24 )[/C][C]557.923076923077[/C][C]2.61647036286737[/C][C]213.235007298784[/C][/ROW]
[ROW][C]Trimmed Mean ( 24 / 24 )[/C][C]558.166666666667[/C][C]2.47206616236522[/C][C]225.789533938940[/C][/ROW]
[ROW][C]Median[/C][C]561[/C][C][/C][C][/C][/ROW]
[ROW][C]Midrange[/C][C]549[/C][C][/C][C][/C][/ROW]
[ROW][C]Midmean - Weighted Average at Xnp[/C][C]554.947368421053[/C][C][/C][C][/C][/ROW]
[ROW][C]Midmean - Weighted Average at X(n+1)p[/C][C]557.055555555556[/C][C][/C][C][/C][/ROW]
[ROW][C]Midmean - Empirical Distribution Function[/C][C]554.947368421053[/C][C][/C][C][/C][/ROW]
[ROW][C]Midmean - Empirical Distribution Function - Averaging[/C][C]557.055555555556[/C][C][/C][C][/C][/ROW]
[ROW][C]Midmean - Empirical Distribution Function - Interpolation[/C][C]557.055555555556[/C][C][/C][C][/C][/ROW]
[ROW][C]Midmean - Closest Observation[/C][C]554.947368421053[/C][C][/C][C][/C][/ROW]
[ROW][C]Midmean - True Basic - Statistics Graphics Toolkit[/C][C]557.055555555556[/C][C][/C][C][/C][/ROW]
[ROW][C]Midmean - MS Excel (old versions)[/C][C]555.846153846154[/C][C][/C][C][/C][/ROW]
[ROW][C]Number of observations[/C][C]72[/C][C][/C][C][/C][/ROW]
[/TABLE]
Source: https://freestatistics.org/blog/index.php?pk=41021&T=1

Globally Unique Identifier (entire table): ba.freestatistics.org/blog/index.php?pk=41021&T=1

As an alternative you can also use a QR Code:  

The GUIDs for individual cells are displayed in the table below:

Central Tendency - Ungrouped Data
MeasureValueS.E.Value/S.E.
Arithmetic Mean556.2638888888894.80882539347478115.675626244134
Geometric Mean554.777760333594
Harmonic Mean553.282958280402
Quadratic Mean557.737729582642
Winsorized Mean ( 1 / 24 )556.3754.77545225594669116.507289818921
Winsorized Mean ( 2 / 24 )556.6527777777784.69188189960786118.641685721949
Winsorized Mean ( 3 / 24 )556.5694444444444.62514333360306120.335610012516
Winsorized Mean ( 4 / 24 )556.8472222222224.55215213862643122.326144923233
Winsorized Mean ( 5 / 24 )556.9861111111114.52762746133349123.019421511121
Winsorized Mean ( 6 / 24 )556.4861111111114.4031480173905126.383693873846
Winsorized Mean ( 7 / 24 )556.7777777777784.3195076582083128.898435153771
Winsorized Mean ( 8 / 24 )556.7777777777784.28129745657406130.048842301959
Winsorized Mean ( 9 / 24 )556.9027777777784.26095934493754130.698918411281
Winsorized Mean ( 10 / 24 )555.0972222222223.91673707469540141.724402643338
Winsorized Mean ( 11 / 24 )554.9444444444443.84606422858823144.288917569155
Winsorized Mean ( 12 / 24 )554.9444444444443.84606422858823144.288917569155
Winsorized Mean ( 13 / 24 )554.9444444444443.79011609366753146.418851225068
Winsorized Mean ( 14 / 24 )555.5277777777783.69631484534586150.292331963350
Winsorized Mean ( 15 / 24 )555.7361111111113.60050167428865154.349632741362
Winsorized Mean ( 16 / 24 )555.5138888888893.50189938711980158.632167141096
Winsorized Mean ( 17 / 24 )555.2777777777783.46840322060641160.096085276006
Winsorized Mean ( 18 / 24 )555.2777777777783.39452185840536163.580557421607
Winsorized Mean ( 19 / 24 )557.1253.0411842822839183.193436598194
Winsorized Mean ( 20 / 24 )556.2916666666672.84528255621935195.513681216193
Winsorized Mean ( 21 / 24 )555.4166666666672.64639817821957209.876454434508
Winsorized Mean ( 22 / 24 )555.4166666666672.64639817821957209.876454434508
Winsorized Mean ( 23 / 24 )556.0555555555562.37874068227804233.760476582525
Winsorized Mean ( 24 / 24 )555.3888888888892.11425924566634262.687222499931
Trimmed Mean ( 1 / 24 )556.4714285714294.6693007101237119.176609757628
Trimmed Mean ( 2 / 24 )556.5735294117654.54300087711612122.512309477051
Trimmed Mean ( 3 / 24 )556.5303030303034.44543293556446125.191474283176
Trimmed Mean ( 4 / 24 )556.5156254.35827256783529127.691789886472
Trimmed Mean ( 5 / 24 )556.419354838714.27897769629402130.035581938326
Trimmed Mean ( 6 / 24 )556.2833333333334.18944676758826132.782050755969
Trimmed Mean ( 7 / 24 )556.2413793103454.11453610351679135.189330052278
Trimmed Mean ( 8 / 24 )556.1428571428574.04258408512961137.571129117287
Trimmed Mean ( 9 / 24 )556.0370370370373.96128741919145140.367758810728
Trimmed Mean ( 10 / 24 )555.9038461538463.86326041150184143.894997214992
Trimmed Mean ( 11 / 24 )556.023.81677179548051145.678083415516
Trimmed Mean ( 12 / 24 )556.1666666666673.76931589506436147.551089415171
Trimmed Mean ( 13 / 24 )556.3260869565223.70481529562692150.162975091686
Trimmed Mean ( 14 / 24 )556.53.63045900102722153.286402585056
Trimmed Mean ( 15 / 24 )556.6190476190483.55183163900186156.713240995699
Trimmed Mean ( 16 / 24 )556.7253.46687391515609160.584149762751
Trimmed Mean ( 17 / 24 )556.8684210526323.37301040932014165.095375784764
Trimmed Mean ( 18 / 24 )557.0555555555563.2498948565274171.407254741399
Trimmed Mean ( 19 / 24 )557.2647058823533.09686427098229179.944827128506
Trimmed Mean ( 20 / 24 )557.281252.98491988565695186.698896904346
Trimmed Mean ( 21 / 24 )557.42.87821783939897193.661505522597
Trimmed Mean ( 22 / 24 )557.6428571428572.77708608168063200.801430255048
Trimmed Mean ( 23 / 24 )557.9230769230772.61647036286737213.235007298784
Trimmed Mean ( 24 / 24 )558.1666666666672.47206616236522225.789533938940
Median561
Midrange549
Midmean - Weighted Average at Xnp554.947368421053
Midmean - Weighted Average at X(n+1)p557.055555555556
Midmean - Empirical Distribution Function554.947368421053
Midmean - Empirical Distribution Function - Averaging557.055555555556
Midmean - Empirical Distribution Function - Interpolation557.055555555556
Midmean - Closest Observation554.947368421053
Midmean - True Basic - Statistics Graphics Toolkit557.055555555556
Midmean - MS Excel (old versions)555.846153846154
Number of observations72


Parameters (Session):
Parameters (R input):
R code (references can be found in the software module):
geomean <- function(x) {
return(exp(mean(log(x))))
}
harmean <- function(x) {
return(1/mean(1/x))
}
quamean <- function(x) {
return(sqrt(mean(x*x)))
}
winmean <- function(x) {
x <-sort(x[!is.na(x)])
n<-length(x)
denom <- 3
nodenom <- n/denom
if (nodenom>40) denom <- n/40
sqrtn = sqrt(n)
roundnodenom = floor(nodenom)
win <- array(NA,dim=c(roundnodenom,2))
for (j in 1:roundnodenom) {
win[j,1] <- (j*x[j+1]+sum(x[(j+1):(n-j)])+j*x[n-j])/n
win[j,2] <- sd(c(rep(x[j+1],j),x[(j+1):(n-j)],rep(x[n-j],j)))/sqrtn
}
return(win)
}
trimean <- function(x) {
x <-sort(x[!is.na(x)])
n<-length(x)
denom <- 3
nodenom <- n/denom
if (nodenom>40) denom <- n/40
sqrtn = sqrt(n)
roundnodenom = floor(nodenom)
tri <- array(NA,dim=c(roundnodenom,2))
for (j in 1:roundnodenom) {
tri[j,1] <- mean(x,trim=j/n)
tri[j,2] <- sd(x[(j+1):(n-j)]) / sqrt(n-j*2)
}
return(tri)
}
midrange <- function(x) {
return((max(x)+min(x))/2)
}
q1 <- function(data,n,p,i,f) {
np <- n*p;
i <<- floor(np)
f <<- np - i
qvalue <- (1-f)*data[i] + f*data[i+1]
}
q2 <- function(data,n,p,i,f) {
np <- (n+1)*p
i <<- floor(np)
f <<- np - i
qvalue <- (1-f)*data[i] + f*data[i+1]
}
q3 <- function(data,n,p,i,f) {
np <- n*p
i <<- floor(np)
f <<- np - i
if (f==0) {
qvalue <- data[i]
} else {
qvalue <- data[i+1]
}
}
q4 <- function(data,n,p,i,f) {
np <- n*p
i <<- floor(np)
f <<- np - i
if (f==0) {
qvalue <- (data[i]+data[i+1])/2
} else {
qvalue <- data[i+1]
}
}
q5 <- function(data,n,p,i,f) {
np <- (n-1)*p
i <<- floor(np)
f <<- np - i
if (f==0) {
qvalue <- data[i+1]
} else {
qvalue <- data[i+1] + f*(data[i+2]-data[i+1])
}
}
q6 <- function(data,n,p,i,f) {
np <- n*p+0.5
i <<- floor(np)
f <<- np - i
qvalue <- data[i]
}
q7 <- function(data,n,p,i,f) {
np <- (n+1)*p
i <<- floor(np)
f <<- np - i
if (f==0) {
qvalue <- data[i]
} else {
qvalue <- f*data[i] + (1-f)*data[i+1]
}
}
q8 <- function(data,n,p,i,f) {
np <- (n+1)*p
i <<- floor(np)
f <<- np - i
if (f==0) {
qvalue <- data[i]
} else {
if (f == 0.5) {
qvalue <- (data[i]+data[i+1])/2
} else {
if (f < 0.5) {
qvalue <- data[i]
} else {
qvalue <- data[i+1]
}
}
}
}
midmean <- function(x,def) {
x <-sort(x[!is.na(x)])
n<-length(x)
if (def==1) {
qvalue1 <- q1(x,n,0.25,i,f)
qvalue3 <- q1(x,n,0.75,i,f)
}
if (def==2) {
qvalue1 <- q2(x,n,0.25,i,f)
qvalue3 <- q2(x,n,0.75,i,f)
}
if (def==3) {
qvalue1 <- q3(x,n,0.25,i,f)
qvalue3 <- q3(x,n,0.75,i,f)
}
if (def==4) {
qvalue1 <- q4(x,n,0.25,i,f)
qvalue3 <- q4(x,n,0.75,i,f)
}
if (def==5) {
qvalue1 <- q5(x,n,0.25,i,f)
qvalue3 <- q5(x,n,0.75,i,f)
}
if (def==6) {
qvalue1 <- q6(x,n,0.25,i,f)
qvalue3 <- q6(x,n,0.75,i,f)
}
if (def==7) {
qvalue1 <- q7(x,n,0.25,i,f)
qvalue3 <- q7(x,n,0.75,i,f)
}
if (def==8) {
qvalue1 <- q8(x,n,0.25,i,f)
qvalue3 <- q8(x,n,0.75,i,f)
}
midm <- 0
myn <- 0
roundno4 <- round(n/4)
round3no4 <- round(3*n/4)
for (i in 1:n) {
if ((x[i]>=qvalue1) & (x[i]<=qvalue3)){
midm = midm + x[i]
myn = myn + 1
}
}
midm = midm / myn
return(midm)
}
(arm <- mean(x))
sqrtn <- sqrt(length(x))
(armse <- sd(x) / sqrtn)
(armose <- arm / armse)
(geo <- geomean(x))
(har <- harmean(x))
(qua <- quamean(x))
(win <- winmean(x))
(tri <- trimean(x))
(midr <- midrange(x))
midm <- array(NA,dim=8)
for (j in 1:8) midm[j] <- midmean(x,j)
midm
bitmap(file='test1.png')
lb <- win[,1] - 2*win[,2]
ub <- win[,1] + 2*win[,2]
if ((ylimmin == '') | (ylimmax == '')) plot(win[,1],type='b',main=main, xlab='j', pch=19, ylab='Winsorized Mean(j/n)', ylim=c(min(lb),max(ub))) else plot(win[,1],type='l',main=main, xlab='j', pch=19, ylab='Winsorized Mean(j/n)', ylim=c(ylimmin,ylimmax))
lines(ub,lty=3)
lines(lb,lty=3)
grid()
dev.off()
bitmap(file='test2.png')
lb <- tri[,1] - 2*tri[,2]
ub <- tri[,1] + 2*tri[,2]
if ((ylimmin == '') | (ylimmax == '')) plot(tri[,1],type='b',main=main, xlab='j', pch=19, ylab='Trimmed Mean(j/n)', ylim=c(min(lb),max(ub))) else plot(tri[,1],type='l',main=main, xlab='j', pch=19, ylab='Trimmed Mean(j/n)', ylim=c(ylimmin,ylimmax))
lines(ub,lty=3)
lines(lb,lty=3)
grid()
dev.off()
load(file='createtable')
a<-table.start()
a<-table.row.start(a)
a<-table.element(a,'Central Tendency - Ungrouped Data',4,TRUE)
a<-table.row.end(a)
a<-table.row.start(a)
a<-table.element(a,'Measure',header=TRUE)
a<-table.element(a,'Value',header=TRUE)
a<-table.element(a,'S.E.',header=TRUE)
a<-table.element(a,'Value/S.E.',header=TRUE)
a<-table.row.end(a)
a<-table.row.start(a)
a<-table.element(a,hyperlink('arithmetic_mean.htm', 'Arithmetic Mean', 'click to view the definition of the Arithmetic Mean'),header=TRUE)
a<-table.element(a,arm)
a<-table.element(a,hyperlink('arithmetic_mean_standard_error.htm', armse, 'click to view the definition of the Standard Error of the Arithmetic Mean'))
a<-table.element(a,armose)
a<-table.row.end(a)
a<-table.row.start(a)
a<-table.element(a,hyperlink('geometric_mean.htm', 'Geometric Mean', 'click to view the definition of the Geometric Mean'),header=TRUE)
a<-table.element(a,geo)
a<-table.element(a,'')
a<-table.row.end(a)
a<-table.row.start(a)
a<-table.element(a,hyperlink('harmonic_mean.htm', 'Harmonic Mean', 'click to view the definition of the Harmonic Mean'),header=TRUE)
a<-table.element(a,har)
a<-table.element(a,'')
a<-table.row.end(a)
a<-table.row.start(a)
a<-table.element(a,hyperlink('quadratic_mean.htm', 'Quadratic Mean', 'click to view the definition of the Quadratic Mean'),header=TRUE)
a<-table.element(a,qua)
a<-table.element(a,'')
a<-table.row.end(a)
for (j in 1:length(win[,1])) {
a<-table.row.start(a)
mylabel <- paste('Winsorized Mean (',j)
mylabel <- paste(mylabel,'/')
mylabel <- paste(mylabel,length(win[,1]))
mylabel <- paste(mylabel,')')
a<-table.element(a,hyperlink('winsorized_mean.htm', mylabel, 'click to view the definition of the Winsorized Mean'),header=TRUE)
a<-table.element(a,win[j,1])
a<-table.element(a,win[j,2])
a<-table.element(a,win[j,1]/win[j,2])
a<-table.row.end(a)
}
for (j in 1:length(tri[,1])) {
a<-table.row.start(a)
mylabel <- paste('Trimmed Mean (',j)
mylabel <- paste(mylabel,'/')
mylabel <- paste(mylabel,length(tri[,1]))
mylabel <- paste(mylabel,')')
a<-table.element(a,hyperlink('arithmetic_mean.htm', mylabel, 'click to view the definition of the Trimmed Mean'),header=TRUE)
a<-table.element(a,tri[j,1])
a<-table.element(a,tri[j,2])
a<-table.element(a,tri[j,1]/tri[j,2])
a<-table.row.end(a)
}
a<-table.row.start(a)
a<-table.element(a,hyperlink('median_1.htm', 'Median', 'click to view the definition of the Median'),header=TRUE)
a<-table.element(a,median(x))
a<-table.element(a,'')
a<-table.row.end(a)
a<-table.row.start(a)
a<-table.element(a,hyperlink('midrange.htm', 'Midrange', 'click to view the definition of the Midrange'),header=TRUE)
a<-table.element(a,midr)
a<-table.element(a,'')
a<-table.row.end(a)
a<-table.row.start(a)
mymid <- hyperlink('midmean.htm', 'Midmean', 'click to view the definition of the Midmean')
mylabel <- paste(mymid,hyperlink('method_1.htm','Weighted Average at Xnp',''),sep=' - ')
a<-table.element(a,mylabel,header=TRUE)
a<-table.element(a,midm[1])
a<-table.element(a,'')
a<-table.row.end(a)
a<-table.row.start(a)
mymid <- hyperlink('midmean.htm', 'Midmean', 'click to view the definition of the Midmean')
mylabel <- paste(mymid,hyperlink('method_2.htm','Weighted Average at X(n+1)p',''),sep=' - ')
a<-table.element(a,mylabel,header=TRUE)
a<-table.element(a,midm[2])
a<-table.element(a,'')
a<-table.row.end(a)
a<-table.row.start(a)
mymid <- hyperlink('midmean.htm', 'Midmean', 'click to view the definition of the Midmean')
mylabel <- paste(mymid,hyperlink('method_3.htm','Empirical Distribution Function',''),sep=' - ')
a<-table.element(a,mylabel,header=TRUE)
a<-table.element(a,midm[3])
a<-table.element(a,'')
a<-table.row.end(a)
a<-table.row.start(a)
mymid <- hyperlink('midmean.htm', 'Midmean', 'click to view the definition of the Midmean')
mylabel <- paste(mymid,hyperlink('method_4.htm','Empirical Distribution Function - Averaging',''),sep=' - ')
a<-table.element(a,mylabel,header=TRUE)
a<-table.element(a,midm[4])
a<-table.element(a,'')
a<-table.row.end(a)
a<-table.row.start(a)
mymid <- hyperlink('midmean.htm', 'Midmean', 'click to view the definition of the Midmean')
mylabel <- paste(mymid,hyperlink('method_5.htm','Empirical Distribution Function - Interpolation',''),sep=' - ')
a<-table.element(a,mylabel,header=TRUE)
a<-table.element(a,midm[5])
a<-table.element(a,'')
a<-table.row.end(a)
a<-table.row.start(a)
mymid <- hyperlink('midmean.htm', 'Midmean', 'click to view the definition of the Midmean')
mylabel <- paste(mymid,hyperlink('method_6.htm','Closest Observation',''),sep=' - ')
a<-table.element(a,mylabel,header=TRUE)
a<-table.element(a,midm[6])
a<-table.element(a,'')
a<-table.row.end(a)
a<-table.row.start(a)
mymid <- hyperlink('midmean.htm', 'Midmean', 'click to view the definition of the Midmean')
mylabel <- paste(mymid,hyperlink('method_7.htm','True Basic - Statistics Graphics Toolkit',''),sep=' - ')
a<-table.element(a,mylabel,header=TRUE)
a<-table.element(a,midm[7])
a<-table.element(a,'')
a<-table.row.end(a)
a<-table.row.start(a)
mymid <- hyperlink('midmean.htm', 'Midmean', 'click to view the definition of the Midmean')
mylabel <- paste(mymid,hyperlink('method_8.htm','MS Excel (old versions)',''),sep=' - ')
a<-table.element(a,mylabel,header=TRUE)
a<-table.element(a,midm[8])
a<-table.element(a,'')
a<-table.row.end(a)
a<-table.row.start(a)
a<-table.element(a,'Number of observations',header=TRUE)
a<-table.element(a,length(x))
a<-table.element(a,'')
a<-table.row.end(a)
a<-table.end(a)
table.save(a,file='mytable.tab')