Free Statistics

of Irreproducible Research!

Author's title

Author*Unverified author*
R Software Modulerwasp_autocorrelation.wasp
Title produced by software(Partial) Autocorrelation Function
Date of computationTue, 28 Jul 2009 08:01:47 -0600
Cite this page as followsStatistical Computations at FreeStatistics.org, Office for Research Development and Education, URL https://freestatistics.org/blog/index.php?v=date/2009/Jul/28/t1248790179x7afcle7gbxxia2.htm/, Retrieved Fri, 24 May 2024 23:13:21 +0000
Statistical Computations at FreeStatistics.org, Office for Research Development and Education, URL https://freestatistics.org/blog/index.php?pk=42420, Retrieved Fri, 24 May 2024 23:13:21 +0000
QR Codes:

Original text written by user:
IsPrivate?No (this computation is public)
User-defined keywords
Estimated Impact214
Family? (F = Feedback message, R = changed R code, M = changed R Module, P = changed Parameters, D = changed Data)
-     [(Partial) Autocorrelation Function] [] [2009-07-28 13:53:43] [3277f4fd1367f73c9bc433502ffbb1d3]
-   P     [(Partial) Autocorrelation Function] [] [2009-07-28 14:01:47] [b5b38cb8cda4101c154c09cb859ab89a] [Current]
Feedback Forum

Post a new message
Dataseries X:
6430
5124
4836
4629
4597
4490
4517
4560
4135
4559
4739
4886
5605
4616
4997
4607
4882
4555
4462
4476
4277
4369
4492
5183
6039
4923
4953
4892
4614
4363
4675
4556
4217
4664
4601
5428
5607
4869
5174
5031
4671
4491
4504
4615
4582
4800
4775
5791
5818
4714
4915
4598
4407
4383
4412
4274
4236
4637
4534
5271
5467
5204
5752
4724
4623
4451
4138
4140
4169
4603
4434
5185


Summary of computational transaction
Raw Inputview raw input (R code)
Raw Outputview raw output of R engine
Computing time1 seconds
R Server'George Udny Yule' @ 72.249.76.132

\begin{tabular}{lllllllll}
\hline
Summary of computational transaction \tabularnewline
Raw Input & view raw input (R code)  \tabularnewline
Raw Output & view raw output of R engine  \tabularnewline
Computing time & 1 seconds \tabularnewline
R Server & 'George Udny Yule' @ 72.249.76.132 \tabularnewline
\hline
\end{tabular}
%Source: https://freestatistics.org/blog/index.php?pk=42420&T=0

[TABLE]
[ROW][C]Summary of computational transaction[/C][/ROW]
[ROW][C]Raw Input[/C][C]view raw input (R code) [/C][/ROW]
[ROW][C]Raw Output[/C][C]view raw output of R engine [/C][/ROW]
[ROW][C]Computing time[/C][C]1 seconds[/C][/ROW]
[ROW][C]R Server[/C][C]'George Udny Yule' @ 72.249.76.132[/C][/ROW]
[/TABLE]
Source: https://freestatistics.org/blog/index.php?pk=42420&T=0

Globally Unique Identifier (entire table): ba.freestatistics.org/blog/index.php?pk=42420&T=0

As an alternative you can also use a QR Code:  

The GUIDs for individual cells are displayed in the table below:

Summary of computational transaction
Raw Inputview raw input (R code)
Raw Outputview raw output of R engine
Computing time1 seconds
R Server'George Udny Yule' @ 72.249.76.132


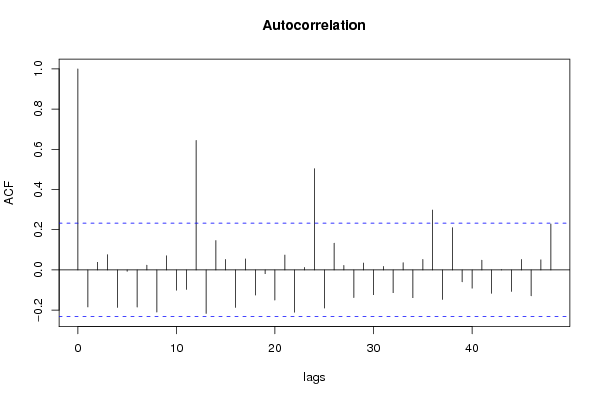
Autocorrelation Function
Time lag kACF(k)T-STATP-value
1-0.184494-1.55460.062247
20.0378290.31870.375426
30.0755130.63630.263319
4-0.187015-1.57580.059756
5-0.006847-0.05770.477078
6-0.184935-1.55830.061805
70.0236010.19890.421468
8-0.209749-1.76740.040731
90.0703970.59320.277474
10-0.100661-0.84820.199593
11-0.09725-0.81940.207639
120.6444445.43020
13-0.216651-1.82550.036063
140.1461361.23140.111125
150.0518780.43710.331671
16-0.186865-1.57450.059903
170.0548040.46180.322822
18-0.125383-1.05650.147162
19-0.018921-0.15940.436892
20-0.14988-1.26290.105376
210.0739340.6230.267647
22-0.210256-1.77170.040372
230.0122720.10340.458967
240.5039924.24673.2e-05
25-0.189682-1.59830.05721
260.1330731.12130.13297
270.0219610.18510.426859
28-0.137496-1.15860.125259
290.0341280.28760.387257
30-0.123618-1.04160.15056
310.0173080.14580.442229
32-0.113111-0.95310.17189
330.0361770.30480.380694
34-0.137925-1.16220.124527
350.0519320.43760.331506
360.2980762.51160.007147
37-0.146759-1.23660.110153
380.2098591.76830.040653
39-0.059315-0.49980.30938
40-0.090903-0.7660.223119
410.0483610.40750.342435
42-0.116515-0.98180.164773
430.0009080.00770.496959
44-0.107173-0.90310.184774
450.0524030.44160.330075
46-0.128856-1.08580.140628
470.0502990.42380.336487
480.228411.92460.029143

\begin{tabular}{lllllllll}
\hline
Autocorrelation Function \tabularnewline
Time lag k & ACF(k) & T-STAT & P-value \tabularnewline
1 & -0.184494 & -1.5546 & 0.062247 \tabularnewline
2 & 0.037829 & 0.3187 & 0.375426 \tabularnewline
3 & 0.075513 & 0.6363 & 0.263319 \tabularnewline
4 & -0.187015 & -1.5758 & 0.059756 \tabularnewline
5 & -0.006847 & -0.0577 & 0.477078 \tabularnewline
6 & -0.184935 & -1.5583 & 0.061805 \tabularnewline
7 & 0.023601 & 0.1989 & 0.421468 \tabularnewline
8 & -0.209749 & -1.7674 & 0.040731 \tabularnewline
9 & 0.070397 & 0.5932 & 0.277474 \tabularnewline
10 & -0.100661 & -0.8482 & 0.199593 \tabularnewline
11 & -0.09725 & -0.8194 & 0.207639 \tabularnewline
12 & 0.644444 & 5.4302 & 0 \tabularnewline
13 & -0.216651 & -1.8255 & 0.036063 \tabularnewline
14 & 0.146136 & 1.2314 & 0.111125 \tabularnewline
15 & 0.051878 & 0.4371 & 0.331671 \tabularnewline
16 & -0.186865 & -1.5745 & 0.059903 \tabularnewline
17 & 0.054804 & 0.4618 & 0.322822 \tabularnewline
18 & -0.125383 & -1.0565 & 0.147162 \tabularnewline
19 & -0.018921 & -0.1594 & 0.436892 \tabularnewline
20 & -0.14988 & -1.2629 & 0.105376 \tabularnewline
21 & 0.073934 & 0.623 & 0.267647 \tabularnewline
22 & -0.210256 & -1.7717 & 0.040372 \tabularnewline
23 & 0.012272 & 0.1034 & 0.458967 \tabularnewline
24 & 0.503992 & 4.2467 & 3.2e-05 \tabularnewline
25 & -0.189682 & -1.5983 & 0.05721 \tabularnewline
26 & 0.133073 & 1.1213 & 0.13297 \tabularnewline
27 & 0.021961 & 0.1851 & 0.426859 \tabularnewline
28 & -0.137496 & -1.1586 & 0.125259 \tabularnewline
29 & 0.034128 & 0.2876 & 0.387257 \tabularnewline
30 & -0.123618 & -1.0416 & 0.15056 \tabularnewline
31 & 0.017308 & 0.1458 & 0.442229 \tabularnewline
32 & -0.113111 & -0.9531 & 0.17189 \tabularnewline
33 & 0.036177 & 0.3048 & 0.380694 \tabularnewline
34 & -0.137925 & -1.1622 & 0.124527 \tabularnewline
35 & 0.051932 & 0.4376 & 0.331506 \tabularnewline
36 & 0.298076 & 2.5116 & 0.007147 \tabularnewline
37 & -0.146759 & -1.2366 & 0.110153 \tabularnewline
38 & 0.209859 & 1.7683 & 0.040653 \tabularnewline
39 & -0.059315 & -0.4998 & 0.30938 \tabularnewline
40 & -0.090903 & -0.766 & 0.223119 \tabularnewline
41 & 0.048361 & 0.4075 & 0.342435 \tabularnewline
42 & -0.116515 & -0.9818 & 0.164773 \tabularnewline
43 & 0.000908 & 0.0077 & 0.496959 \tabularnewline
44 & -0.107173 & -0.9031 & 0.184774 \tabularnewline
45 & 0.052403 & 0.4416 & 0.330075 \tabularnewline
46 & -0.128856 & -1.0858 & 0.140628 \tabularnewline
47 & 0.050299 & 0.4238 & 0.336487 \tabularnewline
48 & 0.22841 & 1.9246 & 0.029143 \tabularnewline
\hline
\end{tabular}
%Source: https://freestatistics.org/blog/index.php?pk=42420&T=1

[TABLE]
[ROW][C]Autocorrelation Function[/C][/ROW]
[ROW][C]Time lag k[/C][C]ACF(k)[/C][C]T-STAT[/C][C]P-value[/C][/ROW]
[ROW][C]1[/C][C]-0.184494[/C][C]-1.5546[/C][C]0.062247[/C][/ROW]
[ROW][C]2[/C][C]0.037829[/C][C]0.3187[/C][C]0.375426[/C][/ROW]
[ROW][C]3[/C][C]0.075513[/C][C]0.6363[/C][C]0.263319[/C][/ROW]
[ROW][C]4[/C][C]-0.187015[/C][C]-1.5758[/C][C]0.059756[/C][/ROW]
[ROW][C]5[/C][C]-0.006847[/C][C]-0.0577[/C][C]0.477078[/C][/ROW]
[ROW][C]6[/C][C]-0.184935[/C][C]-1.5583[/C][C]0.061805[/C][/ROW]
[ROW][C]7[/C][C]0.023601[/C][C]0.1989[/C][C]0.421468[/C][/ROW]
[ROW][C]8[/C][C]-0.209749[/C][C]-1.7674[/C][C]0.040731[/C][/ROW]
[ROW][C]9[/C][C]0.070397[/C][C]0.5932[/C][C]0.277474[/C][/ROW]
[ROW][C]10[/C][C]-0.100661[/C][C]-0.8482[/C][C]0.199593[/C][/ROW]
[ROW][C]11[/C][C]-0.09725[/C][C]-0.8194[/C][C]0.207639[/C][/ROW]
[ROW][C]12[/C][C]0.644444[/C][C]5.4302[/C][C]0[/C][/ROW]
[ROW][C]13[/C][C]-0.216651[/C][C]-1.8255[/C][C]0.036063[/C][/ROW]
[ROW][C]14[/C][C]0.146136[/C][C]1.2314[/C][C]0.111125[/C][/ROW]
[ROW][C]15[/C][C]0.051878[/C][C]0.4371[/C][C]0.331671[/C][/ROW]
[ROW][C]16[/C][C]-0.186865[/C][C]-1.5745[/C][C]0.059903[/C][/ROW]
[ROW][C]17[/C][C]0.054804[/C][C]0.4618[/C][C]0.322822[/C][/ROW]
[ROW][C]18[/C][C]-0.125383[/C][C]-1.0565[/C][C]0.147162[/C][/ROW]
[ROW][C]19[/C][C]-0.018921[/C][C]-0.1594[/C][C]0.436892[/C][/ROW]
[ROW][C]20[/C][C]-0.14988[/C][C]-1.2629[/C][C]0.105376[/C][/ROW]
[ROW][C]21[/C][C]0.073934[/C][C]0.623[/C][C]0.267647[/C][/ROW]
[ROW][C]22[/C][C]-0.210256[/C][C]-1.7717[/C][C]0.040372[/C][/ROW]
[ROW][C]23[/C][C]0.012272[/C][C]0.1034[/C][C]0.458967[/C][/ROW]
[ROW][C]24[/C][C]0.503992[/C][C]4.2467[/C][C]3.2e-05[/C][/ROW]
[ROW][C]25[/C][C]-0.189682[/C][C]-1.5983[/C][C]0.05721[/C][/ROW]
[ROW][C]26[/C][C]0.133073[/C][C]1.1213[/C][C]0.13297[/C][/ROW]
[ROW][C]27[/C][C]0.021961[/C][C]0.1851[/C][C]0.426859[/C][/ROW]
[ROW][C]28[/C][C]-0.137496[/C][C]-1.1586[/C][C]0.125259[/C][/ROW]
[ROW][C]29[/C][C]0.034128[/C][C]0.2876[/C][C]0.387257[/C][/ROW]
[ROW][C]30[/C][C]-0.123618[/C][C]-1.0416[/C][C]0.15056[/C][/ROW]
[ROW][C]31[/C][C]0.017308[/C][C]0.1458[/C][C]0.442229[/C][/ROW]
[ROW][C]32[/C][C]-0.113111[/C][C]-0.9531[/C][C]0.17189[/C][/ROW]
[ROW][C]33[/C][C]0.036177[/C][C]0.3048[/C][C]0.380694[/C][/ROW]
[ROW][C]34[/C][C]-0.137925[/C][C]-1.1622[/C][C]0.124527[/C][/ROW]
[ROW][C]35[/C][C]0.051932[/C][C]0.4376[/C][C]0.331506[/C][/ROW]
[ROW][C]36[/C][C]0.298076[/C][C]2.5116[/C][C]0.007147[/C][/ROW]
[ROW][C]37[/C][C]-0.146759[/C][C]-1.2366[/C][C]0.110153[/C][/ROW]
[ROW][C]38[/C][C]0.209859[/C][C]1.7683[/C][C]0.040653[/C][/ROW]
[ROW][C]39[/C][C]-0.059315[/C][C]-0.4998[/C][C]0.30938[/C][/ROW]
[ROW][C]40[/C][C]-0.090903[/C][C]-0.766[/C][C]0.223119[/C][/ROW]
[ROW][C]41[/C][C]0.048361[/C][C]0.4075[/C][C]0.342435[/C][/ROW]
[ROW][C]42[/C][C]-0.116515[/C][C]-0.9818[/C][C]0.164773[/C][/ROW]
[ROW][C]43[/C][C]0.000908[/C][C]0.0077[/C][C]0.496959[/C][/ROW]
[ROW][C]44[/C][C]-0.107173[/C][C]-0.9031[/C][C]0.184774[/C][/ROW]
[ROW][C]45[/C][C]0.052403[/C][C]0.4416[/C][C]0.330075[/C][/ROW]
[ROW][C]46[/C][C]-0.128856[/C][C]-1.0858[/C][C]0.140628[/C][/ROW]
[ROW][C]47[/C][C]0.050299[/C][C]0.4238[/C][C]0.336487[/C][/ROW]
[ROW][C]48[/C][C]0.22841[/C][C]1.9246[/C][C]0.029143[/C][/ROW]
[/TABLE]
Source: https://freestatistics.org/blog/index.php?pk=42420&T=1

Globally Unique Identifier (entire table): ba.freestatistics.org/blog/index.php?pk=42420&T=1

As an alternative you can also use a QR Code:  

The GUIDs for individual cells are displayed in the table below:

Autocorrelation Function
Time lag kACF(k)T-STATP-value
1-0.184494-1.55460.062247
20.0378290.31870.375426
30.0755130.63630.263319
4-0.187015-1.57580.059756
5-0.006847-0.05770.477078
6-0.184935-1.55830.061805
70.0236010.19890.421468
8-0.209749-1.76740.040731
90.0703970.59320.277474
10-0.100661-0.84820.199593
11-0.09725-0.81940.207639
120.6444445.43020
13-0.216651-1.82550.036063
140.1461361.23140.111125
150.0518780.43710.331671
16-0.186865-1.57450.059903
170.0548040.46180.322822
18-0.125383-1.05650.147162
19-0.018921-0.15940.436892
20-0.14988-1.26290.105376
210.0739340.6230.267647
22-0.210256-1.77170.040372
230.0122720.10340.458967
240.5039924.24673.2e-05
25-0.189682-1.59830.05721
260.1330731.12130.13297
270.0219610.18510.426859
28-0.137496-1.15860.125259
290.0341280.28760.387257
30-0.123618-1.04160.15056
310.0173080.14580.442229
32-0.113111-0.95310.17189
330.0361770.30480.380694
34-0.137925-1.16220.124527
350.0519320.43760.331506
360.2980762.51160.007147
37-0.146759-1.23660.110153
380.2098591.76830.040653
39-0.059315-0.49980.30938
40-0.090903-0.7660.223119
410.0483610.40750.342435
42-0.116515-0.98180.164773
430.0009080.00770.496959
44-0.107173-0.90310.184774
450.0524030.44160.330075
46-0.128856-1.08580.140628
470.0502990.42380.336487
480.228411.92460.029143


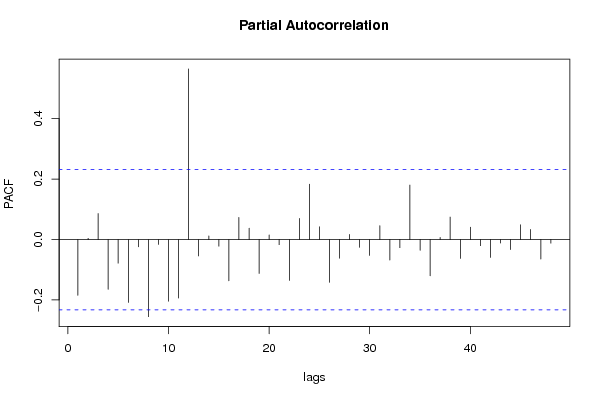
Partial Autocorrelation Function
Time lag kPACF(k)T-STATP-value
1-0.184494-1.55460.062247
20.0039240.03310.486857
30.0861210.72570.235212
4-0.164762-1.38830.084691
5-0.078123-0.65830.256246
6-0.208288-1.75510.041781
7-0.024001-0.20220.420154
8-0.255313-2.15130.017428
9-0.016313-0.13750.445531
10-0.204-1.71890.044992
11-0.193752-1.63260.053493
120.564824.75935e-06
13-0.054299-0.45750.324343
140.0118360.09970.460418
15-0.02187-0.18430.427158
16-0.13657-1.15080.126846
170.0732750.61740.269465
180.0377220.31780.375766
19-0.112026-0.94390.174199
200.015190.1280.449258
21-0.017133-0.14440.442811
22-0.135611-1.14270.128505
230.0699210.58920.27881
240.1834581.54580.063294
250.0421280.3550.36183
26-0.141475-1.19210.118598
27-0.061923-0.52180.301725
280.0170720.14380.443014
29-0.025927-0.21850.413847
30-0.05249-0.44230.329812
310.0460720.38820.349512
32-0.067902-0.57220.284512
33-0.026831-0.22610.410894
340.1803571.51970.066512
35-0.035749-0.30120.38206
36-0.119925-1.01050.157841
370.0068610.05780.477031
380.0744260.62710.266296
39-0.062687-0.52820.2995
400.0409960.34540.365393
41-0.020497-0.17270.431686
42-0.059119-0.49810.309961
43-0.011745-0.0990.460724
44-0.0332-0.27980.390241
450.0489570.41250.340602
460.0333320.28090.389818
47-0.064474-0.54330.294325
48-0.012271-0.10340.458968

\begin{tabular}{lllllllll}
\hline
Partial Autocorrelation Function \tabularnewline
Time lag k & PACF(k) & T-STAT & P-value \tabularnewline
1 & -0.184494 & -1.5546 & 0.062247 \tabularnewline
2 & 0.003924 & 0.0331 & 0.486857 \tabularnewline
3 & 0.086121 & 0.7257 & 0.235212 \tabularnewline
4 & -0.164762 & -1.3883 & 0.084691 \tabularnewline
5 & -0.078123 & -0.6583 & 0.256246 \tabularnewline
6 & -0.208288 & -1.7551 & 0.041781 \tabularnewline
7 & -0.024001 & -0.2022 & 0.420154 \tabularnewline
8 & -0.255313 & -2.1513 & 0.017428 \tabularnewline
9 & -0.016313 & -0.1375 & 0.445531 \tabularnewline
10 & -0.204 & -1.7189 & 0.044992 \tabularnewline
11 & -0.193752 & -1.6326 & 0.053493 \tabularnewline
12 & 0.56482 & 4.7593 & 5e-06 \tabularnewline
13 & -0.054299 & -0.4575 & 0.324343 \tabularnewline
14 & 0.011836 & 0.0997 & 0.460418 \tabularnewline
15 & -0.02187 & -0.1843 & 0.427158 \tabularnewline
16 & -0.13657 & -1.1508 & 0.126846 \tabularnewline
17 & 0.073275 & 0.6174 & 0.269465 \tabularnewline
18 & 0.037722 & 0.3178 & 0.375766 \tabularnewline
19 & -0.112026 & -0.9439 & 0.174199 \tabularnewline
20 & 0.01519 & 0.128 & 0.449258 \tabularnewline
21 & -0.017133 & -0.1444 & 0.442811 \tabularnewline
22 & -0.135611 & -1.1427 & 0.128505 \tabularnewline
23 & 0.069921 & 0.5892 & 0.27881 \tabularnewline
24 & 0.183458 & 1.5458 & 0.063294 \tabularnewline
25 & 0.042128 & 0.355 & 0.36183 \tabularnewline
26 & -0.141475 & -1.1921 & 0.118598 \tabularnewline
27 & -0.061923 & -0.5218 & 0.301725 \tabularnewline
28 & 0.017072 & 0.1438 & 0.443014 \tabularnewline
29 & -0.025927 & -0.2185 & 0.413847 \tabularnewline
30 & -0.05249 & -0.4423 & 0.329812 \tabularnewline
31 & 0.046072 & 0.3882 & 0.349512 \tabularnewline
32 & -0.067902 & -0.5722 & 0.284512 \tabularnewline
33 & -0.026831 & -0.2261 & 0.410894 \tabularnewline
34 & 0.180357 & 1.5197 & 0.066512 \tabularnewline
35 & -0.035749 & -0.3012 & 0.38206 \tabularnewline
36 & -0.119925 & -1.0105 & 0.157841 \tabularnewline
37 & 0.006861 & 0.0578 & 0.477031 \tabularnewline
38 & 0.074426 & 0.6271 & 0.266296 \tabularnewline
39 & -0.062687 & -0.5282 & 0.2995 \tabularnewline
40 & 0.040996 & 0.3454 & 0.365393 \tabularnewline
41 & -0.020497 & -0.1727 & 0.431686 \tabularnewline
42 & -0.059119 & -0.4981 & 0.309961 \tabularnewline
43 & -0.011745 & -0.099 & 0.460724 \tabularnewline
44 & -0.0332 & -0.2798 & 0.390241 \tabularnewline
45 & 0.048957 & 0.4125 & 0.340602 \tabularnewline
46 & 0.033332 & 0.2809 & 0.389818 \tabularnewline
47 & -0.064474 & -0.5433 & 0.294325 \tabularnewline
48 & -0.012271 & -0.1034 & 0.458968 \tabularnewline
\hline
\end{tabular}
%Source: https://freestatistics.org/blog/index.php?pk=42420&T=2

[TABLE]
[ROW][C]Partial Autocorrelation Function[/C][/ROW]
[ROW][C]Time lag k[/C][C]PACF(k)[/C][C]T-STAT[/C][C]P-value[/C][/ROW]
[ROW][C]1[/C][C]-0.184494[/C][C]-1.5546[/C][C]0.062247[/C][/ROW]
[ROW][C]2[/C][C]0.003924[/C][C]0.0331[/C][C]0.486857[/C][/ROW]
[ROW][C]3[/C][C]0.086121[/C][C]0.7257[/C][C]0.235212[/C][/ROW]
[ROW][C]4[/C][C]-0.164762[/C][C]-1.3883[/C][C]0.084691[/C][/ROW]
[ROW][C]5[/C][C]-0.078123[/C][C]-0.6583[/C][C]0.256246[/C][/ROW]
[ROW][C]6[/C][C]-0.208288[/C][C]-1.7551[/C][C]0.041781[/C][/ROW]
[ROW][C]7[/C][C]-0.024001[/C][C]-0.2022[/C][C]0.420154[/C][/ROW]
[ROW][C]8[/C][C]-0.255313[/C][C]-2.1513[/C][C]0.017428[/C][/ROW]
[ROW][C]9[/C][C]-0.016313[/C][C]-0.1375[/C][C]0.445531[/C][/ROW]
[ROW][C]10[/C][C]-0.204[/C][C]-1.7189[/C][C]0.044992[/C][/ROW]
[ROW][C]11[/C][C]-0.193752[/C][C]-1.6326[/C][C]0.053493[/C][/ROW]
[ROW][C]12[/C][C]0.56482[/C][C]4.7593[/C][C]5e-06[/C][/ROW]
[ROW][C]13[/C][C]-0.054299[/C][C]-0.4575[/C][C]0.324343[/C][/ROW]
[ROW][C]14[/C][C]0.011836[/C][C]0.0997[/C][C]0.460418[/C][/ROW]
[ROW][C]15[/C][C]-0.02187[/C][C]-0.1843[/C][C]0.427158[/C][/ROW]
[ROW][C]16[/C][C]-0.13657[/C][C]-1.1508[/C][C]0.126846[/C][/ROW]
[ROW][C]17[/C][C]0.073275[/C][C]0.6174[/C][C]0.269465[/C][/ROW]
[ROW][C]18[/C][C]0.037722[/C][C]0.3178[/C][C]0.375766[/C][/ROW]
[ROW][C]19[/C][C]-0.112026[/C][C]-0.9439[/C][C]0.174199[/C][/ROW]
[ROW][C]20[/C][C]0.01519[/C][C]0.128[/C][C]0.449258[/C][/ROW]
[ROW][C]21[/C][C]-0.017133[/C][C]-0.1444[/C][C]0.442811[/C][/ROW]
[ROW][C]22[/C][C]-0.135611[/C][C]-1.1427[/C][C]0.128505[/C][/ROW]
[ROW][C]23[/C][C]0.069921[/C][C]0.5892[/C][C]0.27881[/C][/ROW]
[ROW][C]24[/C][C]0.183458[/C][C]1.5458[/C][C]0.063294[/C][/ROW]
[ROW][C]25[/C][C]0.042128[/C][C]0.355[/C][C]0.36183[/C][/ROW]
[ROW][C]26[/C][C]-0.141475[/C][C]-1.1921[/C][C]0.118598[/C][/ROW]
[ROW][C]27[/C][C]-0.061923[/C][C]-0.5218[/C][C]0.301725[/C][/ROW]
[ROW][C]28[/C][C]0.017072[/C][C]0.1438[/C][C]0.443014[/C][/ROW]
[ROW][C]29[/C][C]-0.025927[/C][C]-0.2185[/C][C]0.413847[/C][/ROW]
[ROW][C]30[/C][C]-0.05249[/C][C]-0.4423[/C][C]0.329812[/C][/ROW]
[ROW][C]31[/C][C]0.046072[/C][C]0.3882[/C][C]0.349512[/C][/ROW]
[ROW][C]32[/C][C]-0.067902[/C][C]-0.5722[/C][C]0.284512[/C][/ROW]
[ROW][C]33[/C][C]-0.026831[/C][C]-0.2261[/C][C]0.410894[/C][/ROW]
[ROW][C]34[/C][C]0.180357[/C][C]1.5197[/C][C]0.066512[/C][/ROW]
[ROW][C]35[/C][C]-0.035749[/C][C]-0.3012[/C][C]0.38206[/C][/ROW]
[ROW][C]36[/C][C]-0.119925[/C][C]-1.0105[/C][C]0.157841[/C][/ROW]
[ROW][C]37[/C][C]0.006861[/C][C]0.0578[/C][C]0.477031[/C][/ROW]
[ROW][C]38[/C][C]0.074426[/C][C]0.6271[/C][C]0.266296[/C][/ROW]
[ROW][C]39[/C][C]-0.062687[/C][C]-0.5282[/C][C]0.2995[/C][/ROW]
[ROW][C]40[/C][C]0.040996[/C][C]0.3454[/C][C]0.365393[/C][/ROW]
[ROW][C]41[/C][C]-0.020497[/C][C]-0.1727[/C][C]0.431686[/C][/ROW]
[ROW][C]42[/C][C]-0.059119[/C][C]-0.4981[/C][C]0.309961[/C][/ROW]
[ROW][C]43[/C][C]-0.011745[/C][C]-0.099[/C][C]0.460724[/C][/ROW]
[ROW][C]44[/C][C]-0.0332[/C][C]-0.2798[/C][C]0.390241[/C][/ROW]
[ROW][C]45[/C][C]0.048957[/C][C]0.4125[/C][C]0.340602[/C][/ROW]
[ROW][C]46[/C][C]0.033332[/C][C]0.2809[/C][C]0.389818[/C][/ROW]
[ROW][C]47[/C][C]-0.064474[/C][C]-0.5433[/C][C]0.294325[/C][/ROW]
[ROW][C]48[/C][C]-0.012271[/C][C]-0.1034[/C][C]0.458968[/C][/ROW]
[/TABLE]
Source: https://freestatistics.org/blog/index.php?pk=42420&T=2

Globally Unique Identifier (entire table): ba.freestatistics.org/blog/index.php?pk=42420&T=2

As an alternative you can also use a QR Code:  

The GUIDs for individual cells are displayed in the table below:

Partial Autocorrelation Function
Time lag kPACF(k)T-STATP-value
1-0.184494-1.55460.062247
20.0039240.03310.486857
30.0861210.72570.235212
4-0.164762-1.38830.084691
5-0.078123-0.65830.256246
6-0.208288-1.75510.041781
7-0.024001-0.20220.420154
8-0.255313-2.15130.017428
9-0.016313-0.13750.445531
10-0.204-1.71890.044992
11-0.193752-1.63260.053493
120.564824.75935e-06
13-0.054299-0.45750.324343
140.0118360.09970.460418
15-0.02187-0.18430.427158
16-0.13657-1.15080.126846
170.0732750.61740.269465
180.0377220.31780.375766
19-0.112026-0.94390.174199
200.015190.1280.449258
21-0.017133-0.14440.442811
22-0.135611-1.14270.128505
230.0699210.58920.27881
240.1834581.54580.063294
250.0421280.3550.36183
26-0.141475-1.19210.118598
27-0.061923-0.52180.301725
280.0170720.14380.443014
29-0.025927-0.21850.413847
30-0.05249-0.44230.329812
310.0460720.38820.349512
32-0.067902-0.57220.284512
33-0.026831-0.22610.410894
340.1803571.51970.066512
35-0.035749-0.30120.38206
36-0.119925-1.01050.157841
370.0068610.05780.477031
380.0744260.62710.266296
39-0.062687-0.52820.2995
400.0409960.34540.365393
41-0.020497-0.17270.431686
42-0.059119-0.49810.309961
43-0.011745-0.0990.460724
44-0.0332-0.27980.390241
450.0489570.41250.340602
460.0333320.28090.389818
47-0.064474-0.54330.294325
48-0.012271-0.10340.458968


Parameters (Session):
par1 = 48 ; par2 = 1 ; par3 = 1 ; par4 = 0 ; par5 = 12 ;
Parameters (R input):
par1 = 48 ; par2 = 1 ; par3 = 1 ; par4 = 0 ; par5 = 12 ;
R code (references can be found in the software module):
if (par1 == 'Default') {
par1 = 10*log10(length(x))
} else {
par1 <- as.numeric(par1)
}
par2 <- as.numeric(par2)
par3 <- as.numeric(par3)
par4 <- as.numeric(par4)
par5 <- as.numeric(par5)
if (par2 == 0) {
x <- log(x)
} else {
x <- (x ^ par2 - 1) / par2
}
if (par3 > 0) x <- diff(x,lag=1,difference=par3)
if (par4 > 0) x <- diff(x,lag=par5,difference=par4)
bitmap(file='pic1.png')
racf <- acf(x,par1,main='Autocorrelation',xlab='lags',ylab='ACF')
dev.off()
bitmap(file='pic2.png')
rpacf <- pacf(x,par1,main='Partial Autocorrelation',xlab='lags',ylab='PACF')
dev.off()
(myacf <- c(racf$acf))
(mypacf <- c(rpacf$acf))
lengthx <- length(x)
sqrtn <- sqrt(lengthx)
load(file='createtable')
a<-table.start()
a<-table.row.start(a)
a<-table.element(a,'Autocorrelation Function',4,TRUE)
a<-table.row.end(a)
a<-table.row.start(a)
a<-table.element(a,'Time lag k',header=TRUE)
a<-table.element(a,hyperlink('basics.htm','ACF(k)','click here for more information about the Autocorrelation Function'),header=TRUE)
a<-table.element(a,'T-STAT',header=TRUE)
a<-table.element(a,'P-value',header=TRUE)
a<-table.row.end(a)
for (i in 2:(par1+1)) {
a<-table.row.start(a)
a<-table.element(a,i-1,header=TRUE)
a<-table.element(a,round(myacf[i],6))
mytstat <- myacf[i]*sqrtn
a<-table.element(a,round(mytstat,4))
a<-table.element(a,round(1-pt(abs(mytstat),lengthx),6))
a<-table.row.end(a)
}
a<-table.end(a)
table.save(a,file='mytable.tab')
a<-table.start()
a<-table.row.start(a)
a<-table.element(a,'Partial Autocorrelation Function',4,TRUE)
a<-table.row.end(a)
a<-table.row.start(a)
a<-table.element(a,'Time lag k',header=TRUE)
a<-table.element(a,hyperlink('basics.htm','PACF(k)','click here for more information about the Partial Autocorrelation Function'),header=TRUE)
a<-table.element(a,'T-STAT',header=TRUE)
a<-table.element(a,'P-value',header=TRUE)
a<-table.row.end(a)
for (i in 1:par1) {
a<-table.row.start(a)
a<-table.element(a,i,header=TRUE)
a<-table.element(a,round(mypacf[i],6))
mytstat <- mypacf[i]*sqrtn
a<-table.element(a,round(mytstat,4))
a<-table.element(a,round(1-pt(abs(mytstat),lengthx),6))
a<-table.row.end(a)
}
a<-table.end(a)
table.save(a,file='mytable1.tab')