Free Statistics

of Irreproducible Research!

Author's title

Author*Unverified author*
R Software Modulerwasp_autocorrelation.wasp
Title produced by software(Partial) Autocorrelation Function
Date of computationTue, 28 Jul 2009 07:53:43 -0600
Cite this page as followsStatistical Computations at FreeStatistics.org, Office for Research Development and Education, URL https://freestatistics.org/blog/index.php?v=date/2009/Jul/28/t1248789441nwbkbi8s3qx9ejo.htm/, Retrieved Sat, 18 May 2024 15:22:17 +0000
Statistical Computations at FreeStatistics.org, Office for Research Development and Education, URL https://freestatistics.org/blog/index.php?pk=42418, Retrieved Sat, 18 May 2024 15:22:17 +0000
QR Codes:

Original text written by user:
IsPrivate?No (this computation is public)
User-defined keywords
Estimated Impact209
Family? (F = Feedback message, R = changed R code, M = changed R Module, P = changed Parameters, D = changed Data)
-       [(Partial) Autocorrelation Function] [] [2009-07-28 13:53:43] [b5b38cb8cda4101c154c09cb859ab89a] [Current]
-   P     [(Partial) Autocorrelation Function] [] [2009-07-28 14:01:47] [3277f4fd1367f73c9bc433502ffbb1d3]
- RMPD    [Bootstrap Plot - Central Tendency] [] [2009-07-28 14:35:37] [3277f4fd1367f73c9bc433502ffbb1d3]
Feedback Forum

Post a new message
Dataseries X:
6430
5124
4836
4629
4597
4490
4517
4560
4135
4559
4739
4886
5605
4616
4997
4607
4882
4555
4462
4476
4277
4369
4492
5183
6039
4923
4953
4892
4614
4363
4675
4556
4217
4664
4601
5428
5607
4869
5174
5031
4671
4491
4504
4615
4582
4800
4775
5791
5818
4714
4915
4598
4407
4383
4412
4274
4236
4637
4534
5271
5467
5204
5752
4724
4623
4451
4138
4140
4169
4603
4434
5185


Summary of computational transaction
Raw Inputview raw input (R code)
Raw Outputview raw output of R engine
Computing time2 seconds
R Server'Sir Ronald Aylmer Fisher' @ 193.190.124.24

\begin{tabular}{lllllllll}
\hline
Summary of computational transaction \tabularnewline
Raw Input & view raw input (R code)  \tabularnewline
Raw Output & view raw output of R engine  \tabularnewline
Computing time & 2 seconds \tabularnewline
R Server & 'Sir Ronald Aylmer Fisher' @ 193.190.124.24 \tabularnewline
\hline
\end{tabular}
%Source: https://freestatistics.org/blog/index.php?pk=42418&T=0

[TABLE]
[ROW][C]Summary of computational transaction[/C][/ROW]
[ROW][C]Raw Input[/C][C]view raw input (R code) [/C][/ROW]
[ROW][C]Raw Output[/C][C]view raw output of R engine [/C][/ROW]
[ROW][C]Computing time[/C][C]2 seconds[/C][/ROW]
[ROW][C]R Server[/C][C]'Sir Ronald Aylmer Fisher' @ 193.190.124.24[/C][/ROW]
[/TABLE]
Source: https://freestatistics.org/blog/index.php?pk=42418&T=0

Globally Unique Identifier (entire table): ba.freestatistics.org/blog/index.php?pk=42418&T=0

As an alternative you can also use a QR Code:  

The GUIDs for individual cells are displayed in the table below:

Summary of computational transaction
Raw Inputview raw input (R code)
Raw Outputview raw output of R engine
Computing time2 seconds
R Server'Sir Ronald Aylmer Fisher' @ 193.190.124.24


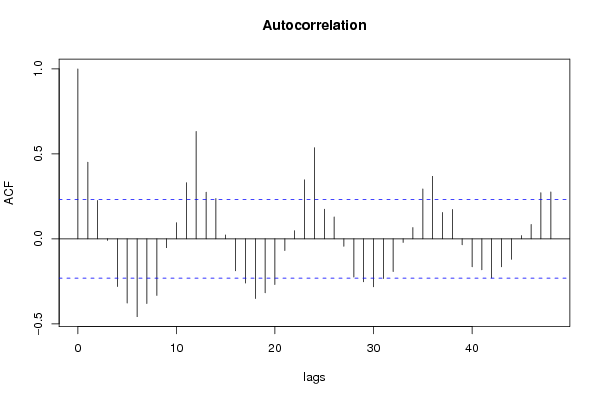
Autocorrelation Function
Time lag kACF(k)T-STATP-value
10.4509263.82620.000137
20.2253491.91210.029918
3-0.009373-0.07950.468415
4-0.280859-2.38320.009902
5-0.377971-3.20720.001
6-0.45809-3.8870.000112
7-0.380314-3.22710.000942
8-0.33309-2.82640.003045
9-0.051955-0.44090.33032
100.0952450.80820.210825
110.3300642.80070.003272
120.632045.3630
130.2745852.32990.011309
140.2369882.01090.02404
150.0227660.19320.423683
16-0.188504-1.59950.057044
17-0.259718-2.20380.015369
18-0.350907-2.97750.001978
19-0.317518-2.69420.004387
20-0.269366-2.28560.01261
21-0.068451-0.58080.281584
220.0473340.40160.344567
230.347382.94760.002157
240.5358734.5471.1e-05
250.1744631.48040.071569
260.1284141.08960.139754
27-0.04367-0.37060.35603
28-0.224701-1.90660.030278
29-0.252473-2.14230.017776
30-0.282766-2.39940.009507
31-0.233141-1.97830.025862
32-0.192019-1.62930.053805
33-0.021152-0.17950.429031
340.0662280.5620.287944
350.29372.49210.0075
360.3678763.12150.001295
370.1547341.3130.096682
380.1730331.46820.073198
39-0.035181-0.29850.383083
40-0.16441-1.39510.083643
41-0.182635-1.54970.062798
42-0.229912-1.95090.027483
43-0.165021-1.40030.082867
44-0.119854-1.0170.15628
450.0190040.16130.436171
460.0849450.72080.236688
470.2712722.30180.01212
480.2761632.34330.010939

\begin{tabular}{lllllllll}
\hline
Autocorrelation Function \tabularnewline
Time lag k & ACF(k) & T-STAT & P-value \tabularnewline
1 & 0.450926 & 3.8262 & 0.000137 \tabularnewline
2 & 0.225349 & 1.9121 & 0.029918 \tabularnewline
3 & -0.009373 & -0.0795 & 0.468415 \tabularnewline
4 & -0.280859 & -2.3832 & 0.009902 \tabularnewline
5 & -0.377971 & -3.2072 & 0.001 \tabularnewline
6 & -0.45809 & -3.887 & 0.000112 \tabularnewline
7 & -0.380314 & -3.2271 & 0.000942 \tabularnewline
8 & -0.33309 & -2.8264 & 0.003045 \tabularnewline
9 & -0.051955 & -0.4409 & 0.33032 \tabularnewline
10 & 0.095245 & 0.8082 & 0.210825 \tabularnewline
11 & 0.330064 & 2.8007 & 0.003272 \tabularnewline
12 & 0.63204 & 5.363 & 0 \tabularnewline
13 & 0.274585 & 2.3299 & 0.011309 \tabularnewline
14 & 0.236988 & 2.0109 & 0.02404 \tabularnewline
15 & 0.022766 & 0.1932 & 0.423683 \tabularnewline
16 & -0.188504 & -1.5995 & 0.057044 \tabularnewline
17 & -0.259718 & -2.2038 & 0.015369 \tabularnewline
18 & -0.350907 & -2.9775 & 0.001978 \tabularnewline
19 & -0.317518 & -2.6942 & 0.004387 \tabularnewline
20 & -0.269366 & -2.2856 & 0.01261 \tabularnewline
21 & -0.068451 & -0.5808 & 0.281584 \tabularnewline
22 & 0.047334 & 0.4016 & 0.344567 \tabularnewline
23 & 0.34738 & 2.9476 & 0.002157 \tabularnewline
24 & 0.535873 & 4.547 & 1.1e-05 \tabularnewline
25 & 0.174463 & 1.4804 & 0.071569 \tabularnewline
26 & 0.128414 & 1.0896 & 0.139754 \tabularnewline
27 & -0.04367 & -0.3706 & 0.35603 \tabularnewline
28 & -0.224701 & -1.9066 & 0.030278 \tabularnewline
29 & -0.252473 & -2.1423 & 0.017776 \tabularnewline
30 & -0.282766 & -2.3994 & 0.009507 \tabularnewline
31 & -0.233141 & -1.9783 & 0.025862 \tabularnewline
32 & -0.192019 & -1.6293 & 0.053805 \tabularnewline
33 & -0.021152 & -0.1795 & 0.429031 \tabularnewline
34 & 0.066228 & 0.562 & 0.287944 \tabularnewline
35 & 0.2937 & 2.4921 & 0.0075 \tabularnewline
36 & 0.367876 & 3.1215 & 0.001295 \tabularnewline
37 & 0.154734 & 1.313 & 0.096682 \tabularnewline
38 & 0.173033 & 1.4682 & 0.073198 \tabularnewline
39 & -0.035181 & -0.2985 & 0.383083 \tabularnewline
40 & -0.16441 & -1.3951 & 0.083643 \tabularnewline
41 & -0.182635 & -1.5497 & 0.062798 \tabularnewline
42 & -0.229912 & -1.9509 & 0.027483 \tabularnewline
43 & -0.165021 & -1.4003 & 0.082867 \tabularnewline
44 & -0.119854 & -1.017 & 0.15628 \tabularnewline
45 & 0.019004 & 0.1613 & 0.436171 \tabularnewline
46 & 0.084945 & 0.7208 & 0.236688 \tabularnewline
47 & 0.271272 & 2.3018 & 0.01212 \tabularnewline
48 & 0.276163 & 2.3433 & 0.010939 \tabularnewline
\hline
\end{tabular}
%Source: https://freestatistics.org/blog/index.php?pk=42418&T=1

[TABLE]
[ROW][C]Autocorrelation Function[/C][/ROW]
[ROW][C]Time lag k[/C][C]ACF(k)[/C][C]T-STAT[/C][C]P-value[/C][/ROW]
[ROW][C]1[/C][C]0.450926[/C][C]3.8262[/C][C]0.000137[/C][/ROW]
[ROW][C]2[/C][C]0.225349[/C][C]1.9121[/C][C]0.029918[/C][/ROW]
[ROW][C]3[/C][C]-0.009373[/C][C]-0.0795[/C][C]0.468415[/C][/ROW]
[ROW][C]4[/C][C]-0.280859[/C][C]-2.3832[/C][C]0.009902[/C][/ROW]
[ROW][C]5[/C][C]-0.377971[/C][C]-3.2072[/C][C]0.001[/C][/ROW]
[ROW][C]6[/C][C]-0.45809[/C][C]-3.887[/C][C]0.000112[/C][/ROW]
[ROW][C]7[/C][C]-0.380314[/C][C]-3.2271[/C][C]0.000942[/C][/ROW]
[ROW][C]8[/C][C]-0.33309[/C][C]-2.8264[/C][C]0.003045[/C][/ROW]
[ROW][C]9[/C][C]-0.051955[/C][C]-0.4409[/C][C]0.33032[/C][/ROW]
[ROW][C]10[/C][C]0.095245[/C][C]0.8082[/C][C]0.210825[/C][/ROW]
[ROW][C]11[/C][C]0.330064[/C][C]2.8007[/C][C]0.003272[/C][/ROW]
[ROW][C]12[/C][C]0.63204[/C][C]5.363[/C][C]0[/C][/ROW]
[ROW][C]13[/C][C]0.274585[/C][C]2.3299[/C][C]0.011309[/C][/ROW]
[ROW][C]14[/C][C]0.236988[/C][C]2.0109[/C][C]0.02404[/C][/ROW]
[ROW][C]15[/C][C]0.022766[/C][C]0.1932[/C][C]0.423683[/C][/ROW]
[ROW][C]16[/C][C]-0.188504[/C][C]-1.5995[/C][C]0.057044[/C][/ROW]
[ROW][C]17[/C][C]-0.259718[/C][C]-2.2038[/C][C]0.015369[/C][/ROW]
[ROW][C]18[/C][C]-0.350907[/C][C]-2.9775[/C][C]0.001978[/C][/ROW]
[ROW][C]19[/C][C]-0.317518[/C][C]-2.6942[/C][C]0.004387[/C][/ROW]
[ROW][C]20[/C][C]-0.269366[/C][C]-2.2856[/C][C]0.01261[/C][/ROW]
[ROW][C]21[/C][C]-0.068451[/C][C]-0.5808[/C][C]0.281584[/C][/ROW]
[ROW][C]22[/C][C]0.047334[/C][C]0.4016[/C][C]0.344567[/C][/ROW]
[ROW][C]23[/C][C]0.34738[/C][C]2.9476[/C][C]0.002157[/C][/ROW]
[ROW][C]24[/C][C]0.535873[/C][C]4.547[/C][C]1.1e-05[/C][/ROW]
[ROW][C]25[/C][C]0.174463[/C][C]1.4804[/C][C]0.071569[/C][/ROW]
[ROW][C]26[/C][C]0.128414[/C][C]1.0896[/C][C]0.139754[/C][/ROW]
[ROW][C]27[/C][C]-0.04367[/C][C]-0.3706[/C][C]0.35603[/C][/ROW]
[ROW][C]28[/C][C]-0.224701[/C][C]-1.9066[/C][C]0.030278[/C][/ROW]
[ROW][C]29[/C][C]-0.252473[/C][C]-2.1423[/C][C]0.017776[/C][/ROW]
[ROW][C]30[/C][C]-0.282766[/C][C]-2.3994[/C][C]0.009507[/C][/ROW]
[ROW][C]31[/C][C]-0.233141[/C][C]-1.9783[/C][C]0.025862[/C][/ROW]
[ROW][C]32[/C][C]-0.192019[/C][C]-1.6293[/C][C]0.053805[/C][/ROW]
[ROW][C]33[/C][C]-0.021152[/C][C]-0.1795[/C][C]0.429031[/C][/ROW]
[ROW][C]34[/C][C]0.066228[/C][C]0.562[/C][C]0.287944[/C][/ROW]
[ROW][C]35[/C][C]0.2937[/C][C]2.4921[/C][C]0.0075[/C][/ROW]
[ROW][C]36[/C][C]0.367876[/C][C]3.1215[/C][C]0.001295[/C][/ROW]
[ROW][C]37[/C][C]0.154734[/C][C]1.313[/C][C]0.096682[/C][/ROW]
[ROW][C]38[/C][C]0.173033[/C][C]1.4682[/C][C]0.073198[/C][/ROW]
[ROW][C]39[/C][C]-0.035181[/C][C]-0.2985[/C][C]0.383083[/C][/ROW]
[ROW][C]40[/C][C]-0.16441[/C][C]-1.3951[/C][C]0.083643[/C][/ROW]
[ROW][C]41[/C][C]-0.182635[/C][C]-1.5497[/C][C]0.062798[/C][/ROW]
[ROW][C]42[/C][C]-0.229912[/C][C]-1.9509[/C][C]0.027483[/C][/ROW]
[ROW][C]43[/C][C]-0.165021[/C][C]-1.4003[/C][C]0.082867[/C][/ROW]
[ROW][C]44[/C][C]-0.119854[/C][C]-1.017[/C][C]0.15628[/C][/ROW]
[ROW][C]45[/C][C]0.019004[/C][C]0.1613[/C][C]0.436171[/C][/ROW]
[ROW][C]46[/C][C]0.084945[/C][C]0.7208[/C][C]0.236688[/C][/ROW]
[ROW][C]47[/C][C]0.271272[/C][C]2.3018[/C][C]0.01212[/C][/ROW]
[ROW][C]48[/C][C]0.276163[/C][C]2.3433[/C][C]0.010939[/C][/ROW]
[/TABLE]
Source: https://freestatistics.org/blog/index.php?pk=42418&T=1

Globally Unique Identifier (entire table): ba.freestatistics.org/blog/index.php?pk=42418&T=1

As an alternative you can also use a QR Code:  

The GUIDs for individual cells are displayed in the table below:

Autocorrelation Function
Time lag kACF(k)T-STATP-value
10.4509263.82620.000137
20.2253491.91210.029918
3-0.009373-0.07950.468415
4-0.280859-2.38320.009902
5-0.377971-3.20720.001
6-0.45809-3.8870.000112
7-0.380314-3.22710.000942
8-0.33309-2.82640.003045
9-0.051955-0.44090.33032
100.0952450.80820.210825
110.3300642.80070.003272
120.632045.3630
130.2745852.32990.011309
140.2369882.01090.02404
150.0227660.19320.423683
16-0.188504-1.59950.057044
17-0.259718-2.20380.015369
18-0.350907-2.97750.001978
19-0.317518-2.69420.004387
20-0.269366-2.28560.01261
21-0.068451-0.58080.281584
220.0473340.40160.344567
230.347382.94760.002157
240.5358734.5471.1e-05
250.1744631.48040.071569
260.1284141.08960.139754
27-0.04367-0.37060.35603
28-0.224701-1.90660.030278
29-0.252473-2.14230.017776
30-0.282766-2.39940.009507
31-0.233141-1.97830.025862
32-0.192019-1.62930.053805
33-0.021152-0.17950.429031
340.0662280.5620.287944
350.29372.49210.0075
360.3678763.12150.001295
370.1547341.3130.096682
380.1730331.46820.073198
39-0.035181-0.29850.383083
40-0.16441-1.39510.083643
41-0.182635-1.54970.062798
42-0.229912-1.95090.027483
43-0.165021-1.40030.082867
44-0.119854-1.0170.15628
450.0190040.16130.436171
460.0849450.72080.236688
470.2712722.30180.01212
480.2761632.34330.010939


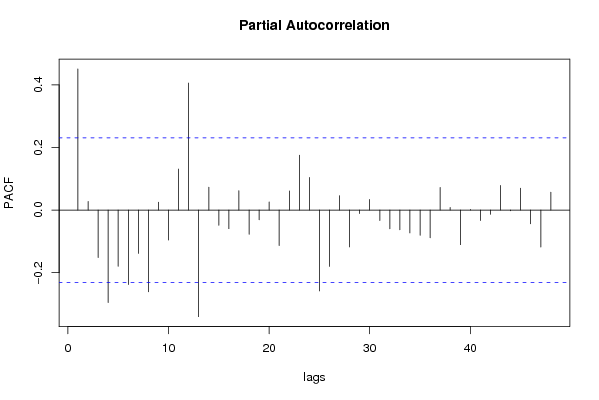
Partial Autocorrelation Function
Time lag kPACF(k)T-STATP-value
10.4509263.82620.000137
20.0276330.23450.407641
3-0.151548-1.28590.101294
4-0.295168-2.50460.007262
5-0.179239-1.52090.066333
6-0.237539-2.01560.023788
7-0.138328-1.17380.122181
8-0.261108-2.21560.014942
90.0251670.21360.41575
10-0.095621-0.81140.209913
110.1311311.11270.134773
120.4056563.44210.000482
13-0.340275-2.88730.002563
140.0730290.61970.268715
15-0.048261-0.40950.34169
16-0.059271-0.50290.308273
170.0617410.52390.300983
18-0.07736-0.65640.256823
19-0.030949-0.26260.396799
200.0258430.21930.413524
21-0.11284-0.95750.170765
220.0612620.51980.302389
230.1755771.48980.070319
240.1043570.88550.189417
25-0.258118-2.19020.015874
26-0.179857-1.52610.065678
270.045730.3880.349568
28-0.117427-0.99640.161196
29-0.0111-0.09420.46261
300.0337950.28680.387561
31-0.033289-0.28250.389199
32-0.059769-0.50720.306796
33-0.062559-0.53080.298585
34-0.072838-0.6180.269247
35-0.080662-0.68440.247947
36-0.088564-0.75150.227403
370.0721240.6120.271237
380.0085020.07210.471346
39-0.110214-0.93520.176407
400.0018020.01530.493921
41-0.033158-0.28140.389621
42-0.013211-0.11210.45553
430.0789340.66980.252571
44-0.002356-0.020.492052
450.0702280.59590.276554
46-0.043528-0.36930.356477
47-0.118162-1.00260.159698
480.0573220.48640.314084

\begin{tabular}{lllllllll}
\hline
Partial Autocorrelation Function \tabularnewline
Time lag k & PACF(k) & T-STAT & P-value \tabularnewline
1 & 0.450926 & 3.8262 & 0.000137 \tabularnewline
2 & 0.027633 & 0.2345 & 0.407641 \tabularnewline
3 & -0.151548 & -1.2859 & 0.101294 \tabularnewline
4 & -0.295168 & -2.5046 & 0.007262 \tabularnewline
5 & -0.179239 & -1.5209 & 0.066333 \tabularnewline
6 & -0.237539 & -2.0156 & 0.023788 \tabularnewline
7 & -0.138328 & -1.1738 & 0.122181 \tabularnewline
8 & -0.261108 & -2.2156 & 0.014942 \tabularnewline
9 & 0.025167 & 0.2136 & 0.41575 \tabularnewline
10 & -0.095621 & -0.8114 & 0.209913 \tabularnewline
11 & 0.131131 & 1.1127 & 0.134773 \tabularnewline
12 & 0.405656 & 3.4421 & 0.000482 \tabularnewline
13 & -0.340275 & -2.8873 & 0.002563 \tabularnewline
14 & 0.073029 & 0.6197 & 0.268715 \tabularnewline
15 & -0.048261 & -0.4095 & 0.34169 \tabularnewline
16 & -0.059271 & -0.5029 & 0.308273 \tabularnewline
17 & 0.061741 & 0.5239 & 0.300983 \tabularnewline
18 & -0.07736 & -0.6564 & 0.256823 \tabularnewline
19 & -0.030949 & -0.2626 & 0.396799 \tabularnewline
20 & 0.025843 & 0.2193 & 0.413524 \tabularnewline
21 & -0.11284 & -0.9575 & 0.170765 \tabularnewline
22 & 0.061262 & 0.5198 & 0.302389 \tabularnewline
23 & 0.175577 & 1.4898 & 0.070319 \tabularnewline
24 & 0.104357 & 0.8855 & 0.189417 \tabularnewline
25 & -0.258118 & -2.1902 & 0.015874 \tabularnewline
26 & -0.179857 & -1.5261 & 0.065678 \tabularnewline
27 & 0.04573 & 0.388 & 0.349568 \tabularnewline
28 & -0.117427 & -0.9964 & 0.161196 \tabularnewline
29 & -0.0111 & -0.0942 & 0.46261 \tabularnewline
30 & 0.033795 & 0.2868 & 0.387561 \tabularnewline
31 & -0.033289 & -0.2825 & 0.389199 \tabularnewline
32 & -0.059769 & -0.5072 & 0.306796 \tabularnewline
33 & -0.062559 & -0.5308 & 0.298585 \tabularnewline
34 & -0.072838 & -0.618 & 0.269247 \tabularnewline
35 & -0.080662 & -0.6844 & 0.247947 \tabularnewline
36 & -0.088564 & -0.7515 & 0.227403 \tabularnewline
37 & 0.072124 & 0.612 & 0.271237 \tabularnewline
38 & 0.008502 & 0.0721 & 0.471346 \tabularnewline
39 & -0.110214 & -0.9352 & 0.176407 \tabularnewline
40 & 0.001802 & 0.0153 & 0.493921 \tabularnewline
41 & -0.033158 & -0.2814 & 0.389621 \tabularnewline
42 & -0.013211 & -0.1121 & 0.45553 \tabularnewline
43 & 0.078934 & 0.6698 & 0.252571 \tabularnewline
44 & -0.002356 & -0.02 & 0.492052 \tabularnewline
45 & 0.070228 & 0.5959 & 0.276554 \tabularnewline
46 & -0.043528 & -0.3693 & 0.356477 \tabularnewline
47 & -0.118162 & -1.0026 & 0.159698 \tabularnewline
48 & 0.057322 & 0.4864 & 0.314084 \tabularnewline
\hline
\end{tabular}
%Source: https://freestatistics.org/blog/index.php?pk=42418&T=2

[TABLE]
[ROW][C]Partial Autocorrelation Function[/C][/ROW]
[ROW][C]Time lag k[/C][C]PACF(k)[/C][C]T-STAT[/C][C]P-value[/C][/ROW]
[ROW][C]1[/C][C]0.450926[/C][C]3.8262[/C][C]0.000137[/C][/ROW]
[ROW][C]2[/C][C]0.027633[/C][C]0.2345[/C][C]0.407641[/C][/ROW]
[ROW][C]3[/C][C]-0.151548[/C][C]-1.2859[/C][C]0.101294[/C][/ROW]
[ROW][C]4[/C][C]-0.295168[/C][C]-2.5046[/C][C]0.007262[/C][/ROW]
[ROW][C]5[/C][C]-0.179239[/C][C]-1.5209[/C][C]0.066333[/C][/ROW]
[ROW][C]6[/C][C]-0.237539[/C][C]-2.0156[/C][C]0.023788[/C][/ROW]
[ROW][C]7[/C][C]-0.138328[/C][C]-1.1738[/C][C]0.122181[/C][/ROW]
[ROW][C]8[/C][C]-0.261108[/C][C]-2.2156[/C][C]0.014942[/C][/ROW]
[ROW][C]9[/C][C]0.025167[/C][C]0.2136[/C][C]0.41575[/C][/ROW]
[ROW][C]10[/C][C]-0.095621[/C][C]-0.8114[/C][C]0.209913[/C][/ROW]
[ROW][C]11[/C][C]0.131131[/C][C]1.1127[/C][C]0.134773[/C][/ROW]
[ROW][C]12[/C][C]0.405656[/C][C]3.4421[/C][C]0.000482[/C][/ROW]
[ROW][C]13[/C][C]-0.340275[/C][C]-2.8873[/C][C]0.002563[/C][/ROW]
[ROW][C]14[/C][C]0.073029[/C][C]0.6197[/C][C]0.268715[/C][/ROW]
[ROW][C]15[/C][C]-0.048261[/C][C]-0.4095[/C][C]0.34169[/C][/ROW]
[ROW][C]16[/C][C]-0.059271[/C][C]-0.5029[/C][C]0.308273[/C][/ROW]
[ROW][C]17[/C][C]0.061741[/C][C]0.5239[/C][C]0.300983[/C][/ROW]
[ROW][C]18[/C][C]-0.07736[/C][C]-0.6564[/C][C]0.256823[/C][/ROW]
[ROW][C]19[/C][C]-0.030949[/C][C]-0.2626[/C][C]0.396799[/C][/ROW]
[ROW][C]20[/C][C]0.025843[/C][C]0.2193[/C][C]0.413524[/C][/ROW]
[ROW][C]21[/C][C]-0.11284[/C][C]-0.9575[/C][C]0.170765[/C][/ROW]
[ROW][C]22[/C][C]0.061262[/C][C]0.5198[/C][C]0.302389[/C][/ROW]
[ROW][C]23[/C][C]0.175577[/C][C]1.4898[/C][C]0.070319[/C][/ROW]
[ROW][C]24[/C][C]0.104357[/C][C]0.8855[/C][C]0.189417[/C][/ROW]
[ROW][C]25[/C][C]-0.258118[/C][C]-2.1902[/C][C]0.015874[/C][/ROW]
[ROW][C]26[/C][C]-0.179857[/C][C]-1.5261[/C][C]0.065678[/C][/ROW]
[ROW][C]27[/C][C]0.04573[/C][C]0.388[/C][C]0.349568[/C][/ROW]
[ROW][C]28[/C][C]-0.117427[/C][C]-0.9964[/C][C]0.161196[/C][/ROW]
[ROW][C]29[/C][C]-0.0111[/C][C]-0.0942[/C][C]0.46261[/C][/ROW]
[ROW][C]30[/C][C]0.033795[/C][C]0.2868[/C][C]0.387561[/C][/ROW]
[ROW][C]31[/C][C]-0.033289[/C][C]-0.2825[/C][C]0.389199[/C][/ROW]
[ROW][C]32[/C][C]-0.059769[/C][C]-0.5072[/C][C]0.306796[/C][/ROW]
[ROW][C]33[/C][C]-0.062559[/C][C]-0.5308[/C][C]0.298585[/C][/ROW]
[ROW][C]34[/C][C]-0.072838[/C][C]-0.618[/C][C]0.269247[/C][/ROW]
[ROW][C]35[/C][C]-0.080662[/C][C]-0.6844[/C][C]0.247947[/C][/ROW]
[ROW][C]36[/C][C]-0.088564[/C][C]-0.7515[/C][C]0.227403[/C][/ROW]
[ROW][C]37[/C][C]0.072124[/C][C]0.612[/C][C]0.271237[/C][/ROW]
[ROW][C]38[/C][C]0.008502[/C][C]0.0721[/C][C]0.471346[/C][/ROW]
[ROW][C]39[/C][C]-0.110214[/C][C]-0.9352[/C][C]0.176407[/C][/ROW]
[ROW][C]40[/C][C]0.001802[/C][C]0.0153[/C][C]0.493921[/C][/ROW]
[ROW][C]41[/C][C]-0.033158[/C][C]-0.2814[/C][C]0.389621[/C][/ROW]
[ROW][C]42[/C][C]-0.013211[/C][C]-0.1121[/C][C]0.45553[/C][/ROW]
[ROW][C]43[/C][C]0.078934[/C][C]0.6698[/C][C]0.252571[/C][/ROW]
[ROW][C]44[/C][C]-0.002356[/C][C]-0.02[/C][C]0.492052[/C][/ROW]
[ROW][C]45[/C][C]0.070228[/C][C]0.5959[/C][C]0.276554[/C][/ROW]
[ROW][C]46[/C][C]-0.043528[/C][C]-0.3693[/C][C]0.356477[/C][/ROW]
[ROW][C]47[/C][C]-0.118162[/C][C]-1.0026[/C][C]0.159698[/C][/ROW]
[ROW][C]48[/C][C]0.057322[/C][C]0.4864[/C][C]0.314084[/C][/ROW]
[/TABLE]
Source: https://freestatistics.org/blog/index.php?pk=42418&T=2

Globally Unique Identifier (entire table): ba.freestatistics.org/blog/index.php?pk=42418&T=2

As an alternative you can also use a QR Code:  

The GUIDs for individual cells are displayed in the table below:

Partial Autocorrelation Function
Time lag kPACF(k)T-STATP-value
10.4509263.82620.000137
20.0276330.23450.407641
3-0.151548-1.28590.101294
4-0.295168-2.50460.007262
5-0.179239-1.52090.066333
6-0.237539-2.01560.023788
7-0.138328-1.17380.122181
8-0.261108-2.21560.014942
90.0251670.21360.41575
10-0.095621-0.81140.209913
110.1311311.11270.134773
120.4056563.44210.000482
13-0.340275-2.88730.002563
140.0730290.61970.268715
15-0.048261-0.40950.34169
16-0.059271-0.50290.308273
170.0617410.52390.300983
18-0.07736-0.65640.256823
19-0.030949-0.26260.396799
200.0258430.21930.413524
21-0.11284-0.95750.170765
220.0612620.51980.302389
230.1755771.48980.070319
240.1043570.88550.189417
25-0.258118-2.19020.015874
26-0.179857-1.52610.065678
270.045730.3880.349568
28-0.117427-0.99640.161196
29-0.0111-0.09420.46261
300.0337950.28680.387561
31-0.033289-0.28250.389199
32-0.059769-0.50720.306796
33-0.062559-0.53080.298585
34-0.072838-0.6180.269247
35-0.080662-0.68440.247947
36-0.088564-0.75150.227403
370.0721240.6120.271237
380.0085020.07210.471346
39-0.110214-0.93520.176407
400.0018020.01530.493921
41-0.033158-0.28140.389621
42-0.013211-0.11210.45553
430.0789340.66980.252571
44-0.002356-0.020.492052
450.0702280.59590.276554
46-0.043528-0.36930.356477
47-0.118162-1.00260.159698
480.0573220.48640.314084


Parameters (Session):
par1 = 48 ; par2 = 1 ; par3 = 0 ; par4 = 0 ; par5 = 12 ;
Parameters (R input):
par1 = 48 ; par2 = 1 ; par3 = 0 ; par4 = 0 ; par5 = 12 ;
R code (references can be found in the software module):
if (par1 == 'Default') {
par1 = 10*log10(length(x))
} else {
par1 <- as.numeric(par1)
}
par2 <- as.numeric(par2)
par3 <- as.numeric(par3)
par4 <- as.numeric(par4)
par5 <- as.numeric(par5)
if (par2 == 0) {
x <- log(x)
} else {
x <- (x ^ par2 - 1) / par2
}
if (par3 > 0) x <- diff(x,lag=1,difference=par3)
if (par4 > 0) x <- diff(x,lag=par5,difference=par4)
bitmap(file='pic1.png')
racf <- acf(x,par1,main='Autocorrelation',xlab='lags',ylab='ACF')
dev.off()
bitmap(file='pic2.png')
rpacf <- pacf(x,par1,main='Partial Autocorrelation',xlab='lags',ylab='PACF')
dev.off()
(myacf <- c(racf$acf))
(mypacf <- c(rpacf$acf))
lengthx <- length(x)
sqrtn <- sqrt(lengthx)
load(file='createtable')
a<-table.start()
a<-table.row.start(a)
a<-table.element(a,'Autocorrelation Function',4,TRUE)
a<-table.row.end(a)
a<-table.row.start(a)
a<-table.element(a,'Time lag k',header=TRUE)
a<-table.element(a,hyperlink('basics.htm','ACF(k)','click here for more information about the Autocorrelation Function'),header=TRUE)
a<-table.element(a,'T-STAT',header=TRUE)
a<-table.element(a,'P-value',header=TRUE)
a<-table.row.end(a)
for (i in 2:(par1+1)) {
a<-table.row.start(a)
a<-table.element(a,i-1,header=TRUE)
a<-table.element(a,round(myacf[i],6))
mytstat <- myacf[i]*sqrtn
a<-table.element(a,round(mytstat,4))
a<-table.element(a,round(1-pt(abs(mytstat),lengthx),6))
a<-table.row.end(a)
}
a<-table.end(a)
table.save(a,file='mytable.tab')
a<-table.start()
a<-table.row.start(a)
a<-table.element(a,'Partial Autocorrelation Function',4,TRUE)
a<-table.row.end(a)
a<-table.row.start(a)
a<-table.element(a,'Time lag k',header=TRUE)
a<-table.element(a,hyperlink('basics.htm','PACF(k)','click here for more information about the Partial Autocorrelation Function'),header=TRUE)
a<-table.element(a,'T-STAT',header=TRUE)
a<-table.element(a,'P-value',header=TRUE)
a<-table.row.end(a)
for (i in 1:par1) {
a<-table.row.start(a)
a<-table.element(a,i,header=TRUE)
a<-table.element(a,round(mypacf[i],6))
mytstat <- mypacf[i]*sqrtn
a<-table.element(a,round(mytstat,4))
a<-table.element(a,round(1-pt(abs(mytstat),lengthx),6))
a<-table.row.end(a)
}
a<-table.end(a)
table.save(a,file='mytable1.tab')