Free Statistics
of Irreproducible Research!
Description of Statistical Computation | |
|---|---|
| Author's title | |
| Author | *The author of this computation has been verified* |
| R Software Module | Rscript (source code is shown below) |
| Title produced by software | R console |
| Date of computation | Tue, 21 Jul 2009 06:30:22 -0600 |
| Cite this page as follows | Statistical Computations at FreeStatistics.org, Office for Research Development and Education, URL https://freestatistics.org/blog/index.php?v=date/2009/Jul/21/t1248179424qolz09qbm15j88u.htm/, Retrieved Sat, 18 May 2024 15:53:53 +0000 |
| Statistical Computations at FreeStatistics.org, Office for Research Development and Education, URL https://freestatistics.org/blog/index.php?pk=42380, Retrieved Sat, 18 May 2024 15:53:53 +0000 | |
| QR Codes: | |
|
| |
| Original text written by user: | This computation is used in the tutorial. |
| IsPrivate? | No (this computation is public) |
| User-defined keywords | tutorial, sample.1 |
| Estimated Impact | 237 |
Tree of Dependent Computations | |
| Family? (F = Feedback message, R = changed R code, M = changed R Module, P = changed Parameters, D = changed Data) | |
| - [R console] [Tutorial Sample 1] [2009-07-21 12:30:22] [256f657a32c6b2b7628dddcfa9a822d0] [Current] | |
| Feedback Forum | |
Post a new message | |
Dataset | |
| Dataseries X: | |
0.503140133534359 -1.09036940474723 1.02628782840365 -1.56241363779876 0.857482117871175 -0.430504144780696 2.08722403683173 1.10766639744747 -1.39189278402237 -0.0725937372397294 -0.42583796250288 1.17648503094921 -1.63769689155953 -0.692168216461429 -0.226723968433443 0.55360803493981 -1.35934295052209 -0.281938642327998 -2.76362659940029 1.44940196320694 -0.25042262446091 0.644498526585659 -1.37097337254234 1.36347331510461 0.0721827821439972 0.701744543011758 -0.520515569074843 -0.35213149201446 0.333658506264107 1.45610122083158 1.10998697082768 1.67532643424203 -1.38406958018692 0.93024295668478 -0.0646249199225753 0.495279081791104 0.307356993181252 0.292644321880828 1.53102992949817 2.06478194120867 0.246134792176907 -0.231904140877915 -0.463445505769942 0.524532843480574 0.0826441263631753 0.421088649804614 -2.34166737177109 0.0535969395663543 -0.549241091097916 -1.16308597562510 -0.74535580889003 0.177282254985397 -0.634579227311761 -1.16609439507151 1.60663945745938 -0.455885819181523 0.381087996145789 -0.0876106318251849 -0.51882060575655 -0.169501249996659 -0.180653145004701 -0.535302609160717 -0.424077291016305 -0.175728554434138 -1.04906041038933 0.153800811686238 -0.088639501486462 1.87520169938816 0.175025438137739 -0.719362417584472 -0.0436861930308889 -0.113296578712956 -1.01234631585376 -0.83228668573173 -0.424367624495367 -0.00414611353550937 -0.0742952023339881 0.521909412231691 0.821066576615022 -0.268592244137806 -1.66135563765645 -0.405458454495011 0.455772347036255 -0.160650556569371 -0.941397199047165 0.114762270119693 0.2462183925762 -0.37196078208437 0.448143282134386 -1.29697802930848 -1.74113033914433 0.197230825228707 -0.965075278052927 0.0290195354065068 -1.3236759072094 -0.500218544884783 -0.371554810411588 -0.619302723082279 -0.127268893883615 -1.10690254056942 | |
Tables (Output of Computation) | |
RC 1.0.1-r25> first_number = 5
RC 1.0.1-r25> second_number = 7
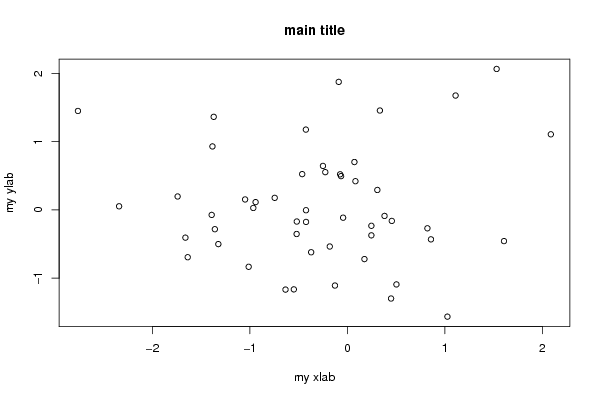
RC 1.0.1-r25> strpar = 'main title'
RC 1.0.1-r25> {
... myfun <- function(x, y) {
... x + y
... }
... plot(RCx, main = strpar, xlab = 'my xlab', ylab = 'my ylab')
... .... [TRUNCATED]
[1] 12
| |
Figures (Output of Computation) | |
Input Parameters & R Code | |
| Parameters (Session): | |
| par1 = 5 ; par2 = 7 ; par3 = maintitle ; | |
| Parameters (R input): | |
| R code (body of R function): | |
{ | |