Free Statistics
of Irreproducible Research!
Description of Statistical Computation | |
|---|---|
| Author's title | |
| Author | *The author of this computation has been verified* |
| R Software Module | Rscript (source code is shown below) |
| Title produced by software | R console |
| Date of computation | Thu, 09 Jul 2009 10:51:52 -0600 |
| Cite this page as follows | Statistical Computations at FreeStatistics.org, Office for Research Development and Education, URL https://freestatistics.org/blog/index.php?v=date/2009/Jul/09/t12471583146m0vkdg9f29t5tf.htm/, Retrieved Sat, 18 May 2024 16:46:34 +0000 |
| Statistical Computations at FreeStatistics.org, Office for Research Development and Education, URL https://freestatistics.org/blog/index.php?pk=42347, Retrieved Sat, 18 May 2024 16:46:34 +0000 | |
| QR Codes: | |
|
| |
| Original text written by user: | This computation is used in the tutorial. |
| IsPrivate? | No (this computation is public) |
| User-defined keywords | tutorial, sample.1 |
| Estimated Impact | 206 |
Tree of Dependent Computations | |
| Family? (F = Feedback message, R = changed R code, M = changed R Module, P = changed Parameters, D = changed Data) | |
| - [R console] [Tutorial Sample 1] [2009-07-09 16:51:52] [256f657a32c6b2b7628dddcfa9a822d0] [Current] | |
| Feedback Forum | |
Post a new message | |
Dataset | |
| Dataseries X: | |
0.0984925426600135 -2.84210080860945 -3.19322417547575 -0.108792442868191 -0.0666271257800098 0.882823255570303 1.18063280321597 -1.36503288261850 -2.3803429175797 1.56913494409552 -0.395595211026753 1.71755943409010 0.68256987381883 1.23519601492493 0.695451593996436 -1.15292429799292 -2.61194632595955 -0.0747713801759176 -1.40289900994828 -1.10830408454899 -0.544432257406389 -0.682726302473614 -1.76598302095648 -1.49943805061235 -0.853922867606386 0.28527285144689 1.12238531266937 -0.366560701144654 -0.31953138373852 -0.51706542005673 -0.597444736969574 -0.706250645781588 -0.081797539741288 -0.406312967286986 -0.996174144752856 0.481261304079344 0.136322762581828 0.490228677150172 -0.324811650364908 -0.0297583369524186 -1.22556089238082 -1.71426941611089 -0.703784374902881 -0.79484063924557 1.06228949202200 0.372719638497268 1.06200372447075 0.656499549459895 0.704969187354907 0.773580966482494 -0.764943083423531 -0.162579127287588 -0.288349262178128 -0.366635532424699 -0.614392956255724 1.18539702425004 0.340001374708241 1.80121229209784 -1.01138294006798 -0.970425155277038 0.564855566663895 0.564073585073756 0.473305362778216 0.82840522877101 0.514792568431529 -1.76703989362781 -0.690347101169251 -0.192527513249738 -0.102979555663601 -0.726979092580789 -0.344298254401635 -2.07805749564920 -1.52021151154742 0.3419510295594 1.57069064546504 0.217564530097772 -0.995063712370248 1.35592038666309 0.124079982324069 0.574836763988332 -3.83442593520861 -0.128998123043678 1.68529772820844 -0.477608406067771 -1.11494096265913 2.19648942405217 0.0530298502803937 -0.267689774221168 0.343969116075049 -1.15249966589909 -0.650595855377119 0.227906721323714 -0.709223777806932 2.02680843881315 -1.10277454391924 -0.390788639932783 1.47143729528824 0.638674040213693 0.247846390993265 -0.914971804855574 | |
Tables (Output of Computation) | |
RC 1.0.1-r17> first_number = 5
RC 1.0.1-r17> second_number = 7
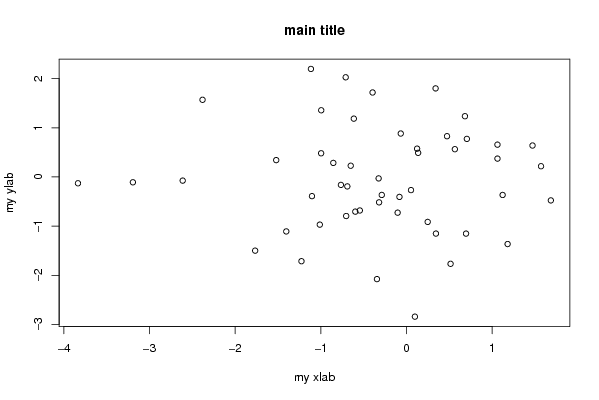
RC 1.0.1-r17> strpar = 'main title'
RC 1.0.1-r17> {
... myfun <- function(x, y) {
... x + y
... }
... plot(RCx, main = strpar, xlab = 'my xlab', ylab = 'my ylab')
... .... [TRUNCATED]
[1] 12
| |
Figures (Output of Computation) | |
Input Parameters & R Code | |
| Parameters (Session): | |
| par1 = 5 ; par2 = 7 ; par3 = maintitle ; | |
| Parameters (R input): | |
| R code (body of R function): | |
{ | |