Free Statistics
of Irreproducible Research!
Description of Statistical Computation | |
|---|---|
| Author's title | |
| Author | *Unverified author* |
| R Software Module | Rscript (source code is shown below) |
| Title produced by software | R console |
| Date of computation | Thu, 02 Jul 2009 10:36:05 -0600 |
| Cite this page as follows | Statistical Computations at FreeStatistics.org, Office for Research Development and Education, URL https://freestatistics.org/blog/index.php?v=date/2009/Jul/02/t1246552566bf26cbt2i965qhy.htm/, Retrieved Sat, 18 May 2024 16:43:58 +0000 |
| Statistical Computations at FreeStatistics.org, Office for Research Development and Education, URL https://freestatistics.org/blog/index.php?pk=42309, Retrieved Sat, 18 May 2024 16:43:58 +0000 | |
| QR Codes: | |
|
| |
| Original text written by user: | |
| IsPrivate? | No (this computation is public) |
| User-defined keywords | |
| Estimated Impact | 202 |
Tree of Dependent Computations | |
| Family? (F = Feedback message, R = changed R code, M = changed R Module, P = changed Parameters, D = changed Data) | |
| - [R console] [test] [2009-07-02 16:36:05] [b768c7adc2675864c15627b87ad9ef22] [Current] | |
| Feedback Forum | |
Post a new message | |
Dataset | |
| Dataseries X: | |
-0.330472814413265 -2.87941440947497 0.293210787482313 -1.03284267594555 -0.96343794418645 -0.471337940332343 -0.876177531187175 1.52750862653855 -1.28886279503077 0.172537604692346 -1.01006499263325 1.34678068563918 0.388761244561996 0.449810952679198 -1.04557966521892 -0.239927119454908 -0.607706452119483 -1.11704846782809 -1.55732064255127 1.64166220938781 1.16995824607252 -0.636304493176091 0.332838769559168 -0.569370606713777 -1.64080794849059 0.767884916278581 -0.751889859694597 1.90585169977091 -0.293148335199369 -0.72381380028787 -0.839241746549862 0.205590245708358 -1.75926298277923 -0.6201017907195 1.31616020223783 -0.621006214414478 0.570572313800334 0.520499433044694 1.81961358671490 0.867311877311224 0.722945542311633 -0.27544708430718 -0.939301998198645 -0.0108261015000026 -0.402816323315199 -0.118442724191449 -1.15783180082373 2.11346071828422 -0.891068130069039 0.0744866067747154 -0.175608437236784 -0.0888252686721144 0.252346210421695 -0.203464113015825 -0.485494313329517 -1.19201682694511 0.607607520318196 -1.04870813667468 -1.71779406443502 0.634061299844793 -1.21585109758577 0.75483891620495 -1.01324580196691 -0.535763251837013 1.1228506971783 0.854884826926977 0.916121140349148 0.880253935565975 -0.241182218552365 -1.41624223283733 -0.556102473618204 -0.807822377285562 1.11480252777639 -0.457490839290415 0.0307091098298389 -0.486977432875482 -3.01144737011136 2.12836382973881 -2.16579028768838 -1.52983878950213 -1.50439913556054 1.17763298850966 -0.219466540365136 0.657944883252586 -1.10208903720702 2.30628136914897 0.336994463495017 -0.449036757933449 0.365338301104021 -1.64467322926719 1.50719617255699 0.679039686620025 0.495359389571329 -0.832759692633619 -1.79651758507369 -1.01400282843025 -0.328998859166547 -0.137803882187834 1.40299646896204 0.0346916244594450 | |
Tables (Output of Computation) | |
> first_number = 5
> second_number = 7
> strpar = 'main title'
> {
+ myfun <- function(x, y) {
+ x + y
+ }
+
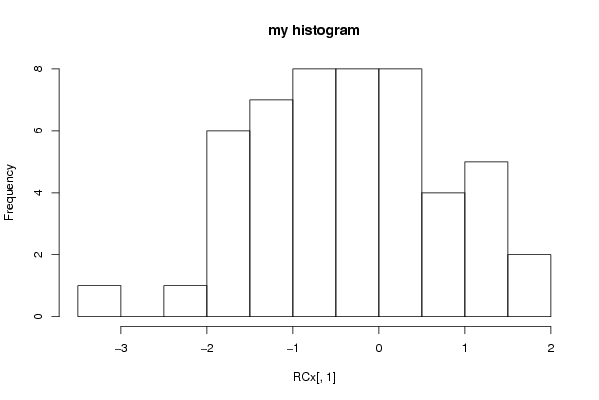
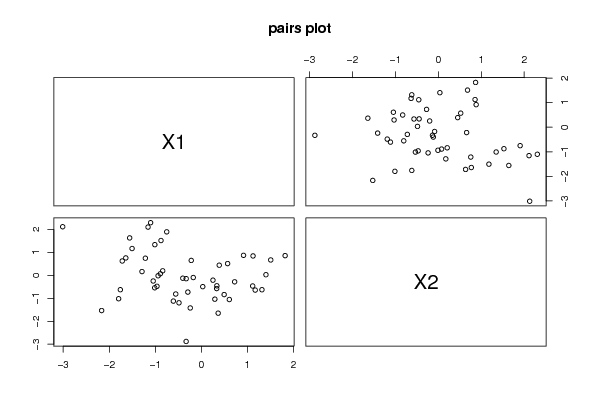
+ plot(RCx, main = strpar, xlab = 'my xlab', ylab = 'my ylab')
+ hist(R .... [TRUNCATED]
[1] 12
| |
Figures (Output of Computation) | |
Input Parameters & R Code | |
| Parameters (Session): | |
| par1 = 5 ; par2 = 7 ; par3 = maintitle ; | |
| Parameters (R input): | |
| R code (body of R function): | |
{ | |