Free Statistics
of Irreproducible Research!
Description of Statistical Computation | |
|---|---|
| Author's title | |
| Author | *Unverified author* |
| R Software Module | Rscript (source code is shown below) |
| Title produced by software | R console |
| Date of computation | Thu, 02 Jul 2009 10:33:12 -0600 |
| Cite this page as follows | Statistical Computations at FreeStatistics.org, Office for Research Development and Education, URL https://freestatistics.org/blog/index.php?v=date/2009/Jul/02/t12465523938ulgyo1p2123722.htm/, Retrieved Wed, 09 Jul 2025 06:54:34 +0000 |
| Statistical Computations at FreeStatistics.org, Office for Research Development and Education, URL https://freestatistics.org/blog/index.php?pk=42308, Retrieved Wed, 09 Jul 2025 06:54:34 +0000 | |
| QR Codes: | |
|
| |
| Original text written by user: | |
| IsPrivate? | No (this computation is public) |
| User-defined keywords | |
| Estimated Impact | 288 |
Tree of Dependent Computations | |
| Family? (F = Feedback message, R = changed R code, M = changed R Module, P = changed Parameters, D = changed Data) | |
| - [R console] [test] [2009-07-02 16:33:12] [b768c7adc2675864c15627b87ad9ef22] [Current] | |
| Feedback Forum | |
Post a new message | |
Dataset | |
| Dataseries X: | |
-0.390594781549666 0.894157282575543 0.0780424626275521 0.677241041088153 -2.20761339112847 0.469894128630461 -0.100184269142211 1.96873930919045 0.230763516741608 0.384499786816645 0.236322625966731 -0.70966341460005 -1.23780932200968 -0.00428609108156234 1.07277089113867 -0.306118956236393 1.09196874012076 1.35953321976345 -0.272514798196394 0.875912594603897 0.474268989360306 0.626031880469765 0.284711792759105 -1.01992676776341 -1.71048978703418 1.63597370008890 0.315393446023880 -0.53938556814634 1.5969908769883 -0.84743279774848 0.439960685946015 -0.712131250218537 -0.137146399189448 0.625115270695083 1.18542298008970 0.0796435060344855 1.69338172943747 -0.0148806910250951 0.148637146815658 1.98282064523952 -0.0764467706062057 0.443908938699778 0.61968359830117 -0.264257232313119 2.29601726806072 0.398910207283457 -0.485901873053868 -0.572189923957081 -0.640036812721584 -0.973729051552992 0.839219164354185 0.331511215365516 0.623095404591001 0.725009131668375 -0.494197616449156 -0.195574957630149 0.722345944870775 -0.749698046815636 0.904312292253311 1.58453322719314 0.410949083422722 0.630503367682317 -0.556166378246472 1.55237034291542 0.0257889779697628 -0.678107209583864 -0.199851279036790 -0.143256800720204 0.936552259845767 -0.33243094894175 0.279984967245415 -0.945070780374533 -0.0196714612368141 0.95753400412723 -0.66019048147276 -0.064830392001398 -2.29634321035967 0.174958045157842 -2.06815447768251 -1.86001349401034 -0.712543855689119 -0.701053714334548 -0.315550384973133 1.01953817115890 -1.65117465445627 0.148964420636390 -1.02862302612164 0.646267797351548 0.385494234743974 -0.945086631032032 -1.34010716745325 -0.915310193171756 0.66927491460122 0.262261138663175 0.576883995655196 -2.4976841774291 1.47721562253185 -1.83799840571743 1.25804439927672 0.303666412821006 | |
Tables (Output of Computation) | |
> first_number = 5
> second_number = 7
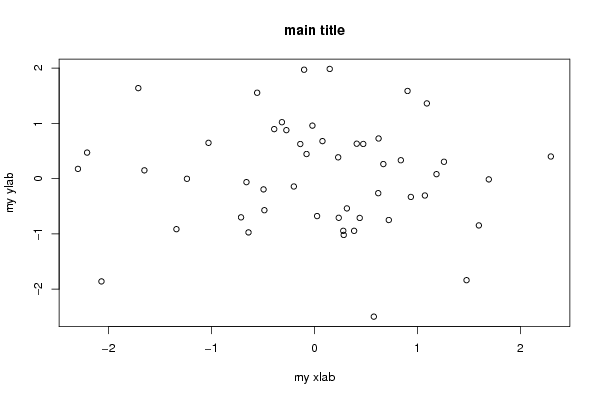
> strpar = 'main title'
> {
+ myfun <- function(x, y) {
+ x + y
+ }
+
+ plot(RCx, main = strpar, xlab = 'my xlab', ylab = 'my ylab')
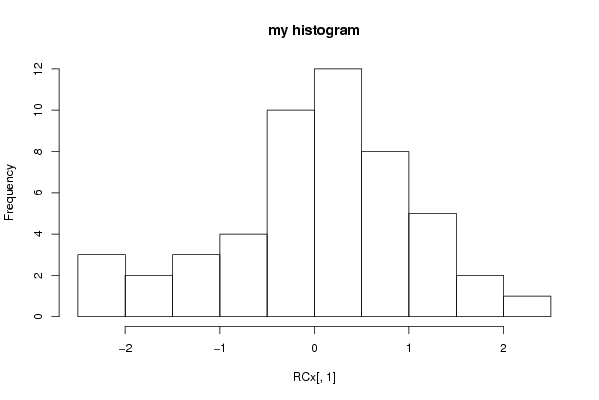
+ hist(R .... [TRUNCATED]
[1] 12
| |
Figures (Output of Computation) | |
Input Parameters & R Code | |
| Parameters (Session): | |
| par1 = 5 ; par2 = 7 ; par3 = maintitle ; | |
| Parameters (R input): | |
| R code (body of R function): | |
{ | |