Free Statistics
of Irreproducible Research!
Description of Statistical Computation | |
|---|---|
| Author's title | |
| Author | *Unverified author* |
| R Software Module | Rscript (source code is shown below) |
| Title produced by software | R console |
| Date of computation | Thu, 02 Jul 2009 08:58:35 -0600 |
| Cite this page as follows | Statistical Computations at FreeStatistics.org, Office for Research Development and Education, URL https://freestatistics.org/blog/index.php?v=date/2009/Jul/02/t12465467161d3s24idxkyeysq.htm/, Retrieved Fri, 04 Jul 2025 02:13:24 +0000 |
| Statistical Computations at FreeStatistics.org, Office for Research Development and Education, URL https://freestatistics.org/blog/index.php?pk=42305, Retrieved Fri, 04 Jul 2025 02:13:24 +0000 | |
| QR Codes: | |
|
| |
| Original text written by user: | |
| IsPrivate? | No (this computation is public) |
| User-defined keywords | |
| Estimated Impact | 243 |
Tree of Dependent Computations | |
| Family? (F = Feedback message, R = changed R code, M = changed R Module, P = changed Parameters, D = changed Data) | |
| - [R console] [test] [2009-07-02 14:58:35] [b768c7adc2675864c15627b87ad9ef22] [Current] | |
| Feedback Forum | |
Post a new message | |
Dataset | |
| Dataseries X: | |
1.21504353956168 -0.211635070070257 1.07773086840828 -1.84756603469335 -0.961990899760645 -0.659041194403959 0.612556572296148 0.126297527702478 -0.904023108571603 -1.45016953381481 -1.67286020143751 -0.619632832922727 -0.680389739773482 1.26767883880568 -0.219789322820781 -0.316542317537195 0.350315475934222 -1.02173519648339 0.604290569281558 -0.334524582827923 -0.78711203860536 -0.516846885492522 0.839079153971293 0.946743991887601 2.29567301238602 0.173125157813039 -0.0283311682651663 -0.276643922826476 -0.741856677460505 0.811239399989254 -1.16016001718462 0.59092735478794 -2.21320945436812 0.309738841393581 -0.720833613595646 -1.44713824158334 -1.31010121226152 -0.0798265919731649 0.116329418506516 0.0388077907844135 0.399365392859801 0.17856835040233 -1.08038915903389 0.935806880477825 1.56443550383895 0.338603040792365 0.21068663812471 -0.536354741503534 0.631044607409602 0.535391836595907 0.824145875786217 -1.05260872825359 -1.68168138721683 0.921427705618044 0.326676772610807 -0.241877303789405 1.88178799142854 0.402041815153251 -1.00294897550153 -0.174871046227575 -0.345513533753455 0.806145466195087 0.60722054932305 -0.543321376232358 0.299199990070754 -0.119634885834987 0.276637976411443 0.586904363036954 0.790141044618173 -1.21499142527710 0.168573273100909 -0.636797262681397 -0.0606147713801967 -1.26904293460779 -0.719467408335917 -0.0620811402506643 -1.6926013951568 -0.207787710240524 1.00036345266672 1.11796318289573 0.412296040527949 0.906761878186365 -0.415234500444102 -0.207504719383359 -0.563183234658532 0.909196825645577 -1.77758189147441 1.48863318793584 0.633169293023966 -0.397400026042593 -0.0269285975125400 0.850756372359247 2.14448542069025 -0.853779301720051 -1.15775403555446 -0.0440171238283219 -0.871930306970168 -0.659776336432462 0.490120468326297 1.67441169240949 | |
Tables (Output of Computation) | |
> first_number = 5
> second_number = 7
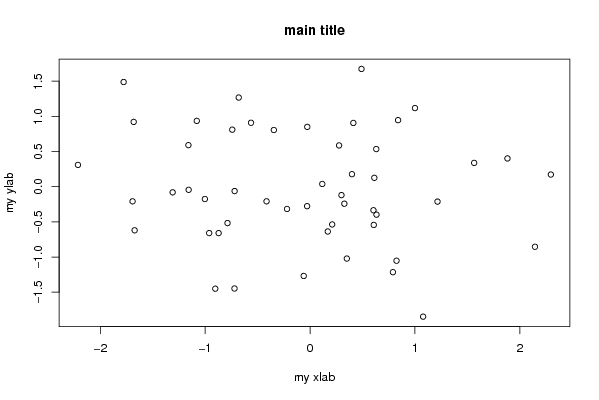
> strpar = 'main title'
> {
+ myfun <- function(x, y) {
+ x + y
+ }
+
+ plot(RCx, main = strpar, xlab = 'my xlab', ylab = 'my ylab')
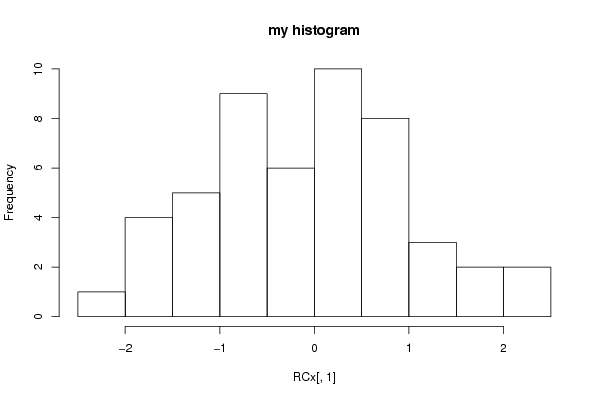
+ hist(R .... [TRUNCATED]
[1] 12
| |
Figures (Output of Computation) | |
Input Parameters & R Code | |
| Parameters (Session): | |
| par1 = 5 ; par2 = 7 ; par3 = maintitle ; | |
| Parameters (R input): | |
| R code (body of R function): | |
{ | |