Free Statistics
of Irreproducible Research!
Description of Statistical Computation | |
|---|---|
| Author's title | |
| Author | *Unverified author* |
| R Software Module | Rscript (source code is shown below) |
| Title produced by software | R console |
| Date of computation | Thu, 02 Jul 2009 08:57:48 -0600 |
| Cite this page as follows | Statistical Computations at FreeStatistics.org, Office for Research Development and Education, URL https://freestatistics.org/blog/index.php?v=date/2009/Jul/02/t12465466699xilajme1i29skx.htm/, Retrieved Sat, 18 May 2024 17:59:27 +0000 |
| Statistical Computations at FreeStatistics.org, Office for Research Development and Education, URL https://freestatistics.org/blog/index.php?pk=42304, Retrieved Sat, 18 May 2024 17:59:27 +0000 | |
| QR Codes: | |
|
| |
| Original text written by user: | |
| IsPrivate? | No (this computation is public) |
| User-defined keywords | |
| Estimated Impact | 197 |
Tree of Dependent Computations | |
| Family? (F = Feedback message, R = changed R code, M = changed R Module, P = changed Parameters, D = changed Data) | |
| - [R console] [test] [2009-07-02 14:57:48] [b768c7adc2675864c15627b87ad9ef22] [Current] | |
| Feedback Forum | |
Post a new message | |
Dataset | |
| Dataseries X: | |
0.830710192124743 -0.571681705606806 1.50343834120643 0.290534946318737 0.415686510754828 -0.625857367982668 0.970909705429631 0.691009399289078 -1.54077988100395 0.84158350270883 -0.324124055714054 1.45988062164192 0.650793862871785 -0.83139937067498 -1.34511898602625 -0.0803958307508665 1.27085370530255 -0.258051921767716 -0.289884006972857 1.59707457592423 0.500677186707278 -0.447714019319433 -0.0593512308176653 -1.15177842979296 0.390422239395661 1.13787936274444 -1.57827493842326 -0.00492380499717139 0.225505382874677 0.440821365075023 -0.227919075402212 1.31569770869402 1.33239149779103 1.92731612715415 1.27595965152669 -0.589291333534057 -0.606200424335232 -1.19977234815158 -0.956015952180273 -1.56802527277435 -1.01775895164868 -2.39036633016245 -0.812814348403802 -0.804737941580674 -0.0447737579312091 2.05508055299428 0.884398958164155 0.655871871184925 -0.0637002232926207 0.900415212655926 0.81306813079882 0.108772688790735 1.90631673818235 0.39418475653405 -0.956771796054503 1.55423871113658 2.82879847150269 -0.158665216379542 0.138464279392597 -0.385204698343391 0.445406156475304 1.56209545635979 0.00145153969378510 0.497637672076569 1.23210533419745 -0.619741567391762 -0.532040886288621 0.0531991112062756 0.509377757466757 -2.23475391414882 -0.417702360701464 -0.243391696518411 -0.0807781978820954 0.370112770320066 -1.14957387293742 0.401554174039298 -0.437507273663319 -0.115904059321322 -0.156445958637372 2.14830925630874 -0.0488745894487232 0.400409667626689 -0.0496013924439859 2.40689938848331 -0.312432633537939 1.05178225361838 1.35119653220601 -0.514269440559212 0.97522814309159 -0.0944108229887077 0.0957078281129242 1.01405502689123 -0.529967589988024 0.448104350454131 0.68445599623843 -1.41742901070679 -0.0173080223464107 0.830508939670365 -1.13765176650610 -0.615826632672115 | |
Tables (Output of Computation) | |
> first_number = 5
> second_number = 7
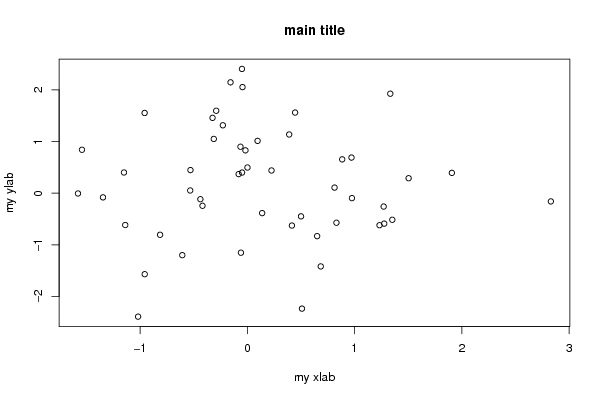
> strpar = 'main title'
> {
+ myfun <- function(x, y) {
+ x + y
+ }
+
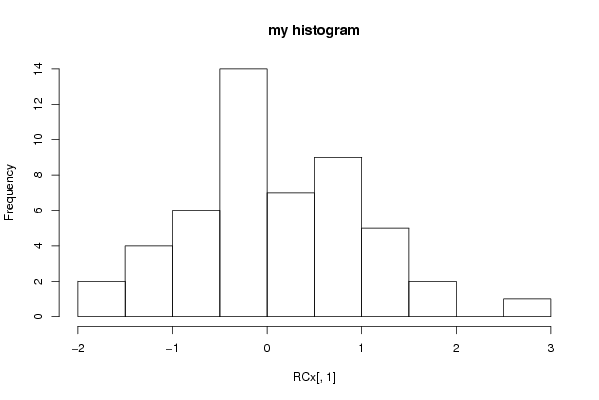
+ plot(RCx, main = strpar, xlab = 'my xlab', ylab = 'my ylab')
+ hist(R .... [TRUNCATED]
[1] 12
| |
Figures (Output of Computation) | |
Input Parameters & R Code | |
| Parameters (Session): | |
| par1 = 5 ; par2 = 7 ; par3 = maintitle ; | |
| Parameters (R input): | |
| R code (body of R function): | |
{ | |