Free Statistics
of Irreproducible Research!
Description of Statistical Computation | |
|---|---|
| Author's title | |
| Author | *Unverified author* |
| R Software Module | Rscript (source code is shown below) |
| Title produced by software | R console |
| Date of computation | Thu, 02 Jul 2009 08:56:12 -0600 |
| Cite this page as follows | Statistical Computations at FreeStatistics.org, Office for Research Development and Education, URL https://freestatistics.org/blog/index.php?v=date/2009/Jul/02/t1246546574ewqr867gwqakhx6.htm/, Retrieved Sat, 18 May 2024 16:20:56 +0000 |
| Statistical Computations at FreeStatistics.org, Office for Research Development and Education, URL https://freestatistics.org/blog/index.php?pk=42303, Retrieved Sat, 18 May 2024 16:20:56 +0000 | |
| QR Codes: | |
|
| |
| Original text written by user: | |
| IsPrivate? | No (this computation is public) |
| User-defined keywords | |
| Estimated Impact | 183 |
Tree of Dependent Computations | |
| Family? (F = Feedback message, R = changed R code, M = changed R Module, P = changed Parameters, D = changed Data) | |
| - [R console] [test] [2009-07-02 14:56:12] [b768c7adc2675864c15627b87ad9ef22] [Current] | |
| Feedback Forum | |
Post a new message | |
Dataset | |
| Dataseries X: | |
0.225724242996574 -1.05418841117255 1.00953026158492 -0.290009794061106 -0.605162280821309 1.21594223520666 0.461759341387659 0.243250343679942 1.41073254433380 0.929114495061694 -0.176583252567251 -0.58395450828483 0.472881203236393 -1.38706444869101 -1.08876011131750 -1.86152930622042 1.60747794033339 0.223695493488407 -0.0717391324659655 0.0978053490263838 -0.562539724685104 0.598801195091151 -0.0841300000129031 -0.472626184389176 -1.68462022014980 -0.842531337870776 0.738155192024576 1.83028317109537 1.34037915021625 -0.416381722022833 -0.3093031465067 -0.482400359869481 1.88167722748093 1.35182190846614 1.10578770172246 0.698286847297623 0.0305965714911852 0.590552989615085 0.468283783314141 0.121747943825524 0.460403309923147 0.223567668868502 -0.909521467164826 -0.430198074032417 1.75784349579064 0.695203763961647 0.127010141366555 0.0740168591612905 1.19404403301194 -0.114948509358229 -0.0675297803894218 -0.113664341485514 -0.292932768729293 1.02547470800294 -0.104933719320372 0.831953092762792 2.28542182723962 2.78830769923776 -0.30684737595315 0.520078130839351 0.483856406702245 1.86640206935992 -0.797439143988167 2.14911171393993 -0.398657329882781 0.164584733366075 -0.332256822681064 0.476002570942296 -0.558854350733432 1.67955775739654 -0.080905837227234 0.163915161362803 -1.18558704327156 -1.8230433419856 0.698108642545705 -0.376789119873227 1.20228280126862 0.70757784566725 -0.272180345360888 0.18774353556605 -0.256451988227971 0.134506232298992 0.173463928927994 0.0674825956775126 0.926260705118741 -0.389024029033795 0.704035171177175 -0.00653746705895802 0.0152733664503795 1.14556974518761 -1.31502750101675 1.46039499980722 1.99238341549879 -1.13499640343398 -0.569594554242799 -0.234413432804843 0.474722634249746 -1.15022788207525 0.100491256456059 -1.52347203645619 | |
Tables (Output of Computation) | |
> first_number = 5
> second_number = 7
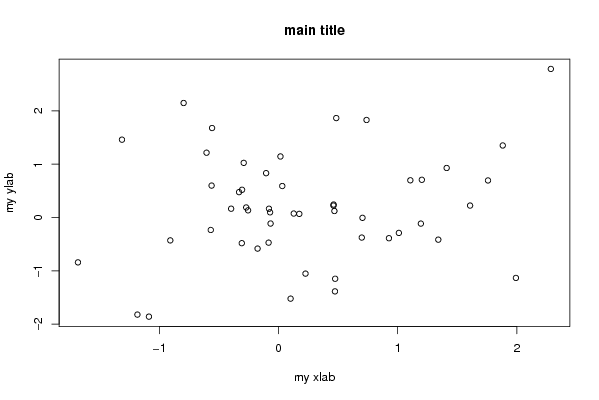
> strpar = 'main title'
> {
+ myfun <- function(x, y) {
+ x + y
+ }
+
+ plot(RCx, main = strpar, xlab = 'my xlab', ylab = 'my ylab')
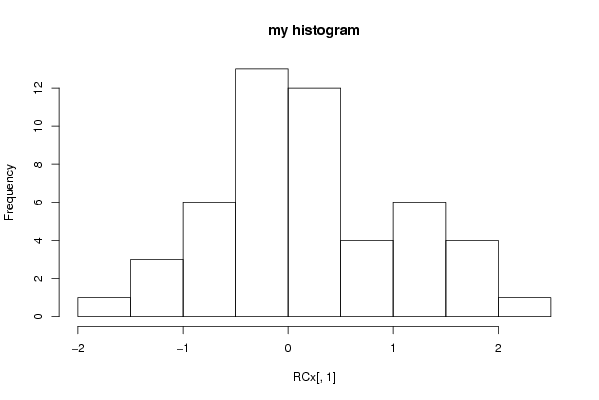
+ hist(R .... [TRUNCATED]
[1] 12
| |
Figures (Output of Computation) | |
Input Parameters & R Code | |
| Parameters (Session): | |
| par1 = 5 ; par2 = 7 ; par3 = maintitle ; | |
| Parameters (R input): | |
| R code (body of R function): | |
{ | |