Free Statistics
of Irreproducible Research!
Description of Statistical Computation | |||||||||||||||||||||||||||||||||||||||||
|---|---|---|---|---|---|---|---|---|---|---|---|---|---|---|---|---|---|---|---|---|---|---|---|---|---|---|---|---|---|---|---|---|---|---|---|---|---|---|---|---|---|
| Author's title | |||||||||||||||||||||||||||||||||||||||||
| Author | *Unverified author* | ||||||||||||||||||||||||||||||||||||||||
| R Software Module | rwasp_univariatedataseries.wasp | ||||||||||||||||||||||||||||||||||||||||
| Title produced by software | Univariate Data Series | ||||||||||||||||||||||||||||||||||||||||
| Date of computation | Thu, 25 Sep 2008 01:30:21 -0600 | ||||||||||||||||||||||||||||||||||||||||
| Cite this page as follows | Statistical Computations at FreeStatistics.org, Office for Research Development and Education, URL https://freestatistics.org/blog/index.php?v=date/2008/Sep/25/t1222328039t9k7cu1tkd1tpw6.htm/, Retrieved Sat, 18 May 2024 13:52:06 +0000 | ||||||||||||||||||||||||||||||||||||||||
| Statistical Computations at FreeStatistics.org, Office for Research Development and Education, URL https://freestatistics.org/blog/index.php?pk=14754, Retrieved Sat, 18 May 2024 13:52:06 +0000 | |||||||||||||||||||||||||||||||||||||||||
| QR Codes: | |||||||||||||||||||||||||||||||||||||||||
|
| |||||||||||||||||||||||||||||||||||||||||
| Original text written by user: | |||||||||||||||||||||||||||||||||||||||||
| IsPrivate? | No (this computation is public) | ||||||||||||||||||||||||||||||||||||||||
| User-defined keywords | |||||||||||||||||||||||||||||||||||||||||
| Estimated Impact | 262 | ||||||||||||||||||||||||||||||||||||||||
Tree of Dependent Computations | |||||||||||||||||||||||||||||||||||||||||
| Family? (F = Feedback message, R = changed R code, M = changed R Module, P = changed Parameters, D = changed Data) | |||||||||||||||||||||||||||||||||||||||||
| - [Univariate Data Series] [Datareeks - Prijs...] [2008-09-25 07:30:21] [d41d8cd98f00b204e9800998ecf8427e] [Current] - RMPD [Harrell-Davis Quantiles] [H-D Decielen prij...] [2008-10-18 18:27:57] [74be16979710d4c4e7c6647856088456] - RMPD [Harrell-Davis Quantiles] [H-D Percentielen ...] [2008-10-18 18:33:55] [74be16979710d4c4e7c6647856088456] | |||||||||||||||||||||||||||||||||||||||||
| Feedback Forum | |||||||||||||||||||||||||||||||||||||||||
Post a new message | |||||||||||||||||||||||||||||||||||||||||
Dataset | |||||||||||||||||||||||||||||||||||||||||
| Dataseries X: | |||||||||||||||||||||||||||||||||||||||||
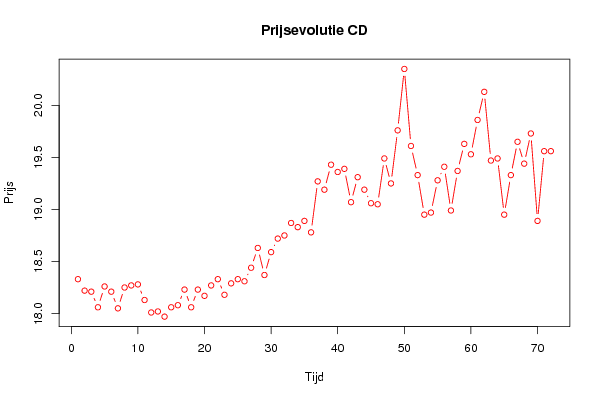
18.33 18.22 18.21 18.06 18.26 18.21 18.05 18.25 18.27 18.28 18.13 18.01 18.02 17.97 18.06 18.08 18.23 18.06 18.23 18.17 18.27 18.33 18.18 18.29 18.33 18.31 18.44 18.63 18.37 18.59 18.72 18.75 18.87 18.83 18.89 18.78 19.27 19.19 19.43 19.36 19.39 19.07 19.31 19.19 19.06 19.05 19.49 19.25 19.76 20.35 19.61 19.33 18.95 18.97 19.28 19.41 18.99 19.37 19.63 19.53 19.86 20.13 19.47 19.49 18.95 19.33 19.65 19.44 19.73 18.89 19.56 19.56 | |||||||||||||||||||||||||||||||||||||||||
Tables (Output of Computation) | |||||||||||||||||||||||||||||||||||||||||
| |||||||||||||||||||||||||||||||||||||||||
Figures (Output of Computation) | |||||||||||||||||||||||||||||||||||||||||
Input Parameters & R Code | |||||||||||||||||||||||||||||||||||||||||
| Parameters (Session): | |||||||||||||||||||||||||||||||||||||||||
| par1 = Prijsevolutie CD ; par2 = Belgostat ; par3 = Prijsevolutie van O1/1999 tot 12/2004 ; | |||||||||||||||||||||||||||||||||||||||||
| Parameters (R input): | |||||||||||||||||||||||||||||||||||||||||
| par1 = Prijsevolutie CD ; par2 = Belgostat ; par3 = Prijsevolutie van O1/1999 tot 12/2004 ; | |||||||||||||||||||||||||||||||||||||||||
| R code (references can be found in the software module): | |||||||||||||||||||||||||||||||||||||||||
bitmap(file='test1.png') | |||||||||||||||||||||||||||||||||||||||||