Free Statistics
of Irreproducible Research!
Description of Statistical Computation | |
|---|---|
| Author's title | |
| Author | *The author of this computation has been verified* |
| R Software Module | Rscript (source code is shown below) |
| Title produced by software | R console |
| Date of computation | Mon, 01 Sep 2008 03:15:07 -0600 |
| Cite this page as follows | Statistical Computations at FreeStatistics.org, Office for Research Development and Education, URL https://freestatistics.org/blog/index.php?v=date/2008/Sep/01/t1220260510r4gvcrmaqcwwxcb.htm/, Retrieved Fri, 04 Jul 2025 04:28:42 +0000 |
| Statistical Computations at FreeStatistics.org, Office for Research Development and Education, URL https://freestatistics.org/blog/index.php?pk=14304, Retrieved Fri, 04 Jul 2025 04:28:42 +0000 | |
| QR Codes: | |
|
| |
| Original text written by user: | no comments |
| IsPrivate? | No (this computation is public) |
| User-defined keywords | key1,key2 |
| Estimated Impact | 325 |
Tree of Dependent Computations | |
| Family? (F = Feedback message, R = changed R code, M = changed R Module, P = changed Parameters, D = changed Data) | |
| - [R console] [my R test (plot 1...] [2008-09-01 09:15:07] [d41d8cd98f00b204e9800998ecf8427e] [Current] | |
| Feedback Forum | |
Post a new message | |
Dataset | |
| Dataseries X: | |
1.54543899298254 -0.517937171050309 -1.74576422473763 0.752452077480602 -1.18834585046649 1.02711365739466 1.62183867079856 0.650128812603194 -0.59449330616851 0.324560399233157 -1.10005879321768 0.353341617047049 0.181860311443919 1.32081725496438 -0.552528180976819 -1.48725346957336 -1.15442126459426 -0.0232856232132458 1.64015480032560 0.263551574237426 1.08762157232616 1.01731512618295 1.23401928759431 -0.0549977230866598 0.936141133623252 0.0921387554590111 -0.492192206234964 0.807684926573625 0.00274856143693057 -0.151847784634650 -1.32422846413979 -0.105961760409630 -0.277313977290764 -0.673232561167655 -0.181746997517083 1.15380119973665 0.380892153944836 0.55368776713554 -0.839829950982667 1.57982750501591 1.06238849744143 1.55869226213648 -1.58796242789370 -0.584209204232725 0.280847384011108 -2.28792325463517 0.402823405703386 -1.23113944858728 -0.379230528056363 1.60961435525828 -0.157395527692957 -0.119874656752865 -1.98090598404544 -1.12834063700115 -0.00695471109278643 0.583724027206254 -1.0528659254986 1.73695930016974 -0.88973314527057 0.586699072198714 0.125061367131308 0.475732293906341 -0.744212634164514 -0.670009961987214 -0.794645048325264 2.05292234196236 -0.644489012325216 0.346841776336768 -1.49752665045227 -0.914111023084948 1.23529399093031 -0.359584852024464 1.20643050180716 0.130078916625241 -0.377411216501518 1.61435325684598 -1.63373574784827 0.625841453900981 -0.633194762857642 0.452240934911276 -0.399554488609473 1.71325062387524 1.90001333734246 1.341291174324 -0.816769722259723 -0.637000139024174 1.51802443338371 0.162395518189918 0.50768499386623 0.920691952976967 0.295223545985601 -0.399394638578958 -0.46913596631342 0.0465811482842244 -0.123957264563073 0.269252464210224 -1.55210636856672 0.339776945563065 0.537321686442488 -0.0101194017044254 | |
Tables (Output of Computation) | |
> first_number = 5

> second_number = 7

> strpar = 'hello'

> {
+     myfun <- function(x, y) {
+             x + y
+         }
+
+     print(myfun(first_number, second_number))
+     print(strpar)
+     print .... [TRUNCATED]
[1] 12
[1] 'hello'
              [,1]        [,2]
 [1,]  1.545438993 -0.51793717
 [2,] -1.745764225  0.75245208
 [3,] -1.188345850  1.02711366
 [4,]  1.621838671  0.65012881
 [5,] -0.594493306  0.32456040
 [6,] -1.100058793  0.35334162
 [7,]  0.181860311  1.32081725
 [8,] -0.552528181 -1.48725347
 [9,] -1.154421265 -0.02328562
[10,]  1.640154800  0.26355157
[11,]  1.087621572  1.01731513
[12,]  1.234019288 -0.05499772
[13,]  0.936141134  0.09213876
[14,] -0.492192206  0.80768493
[15,]  0.002748561 -0.15184778
[16,] -1.324228464 -0.10596176
[17,] -0.277313977 -0.67323256
[18,] -0.181746998  1.15380120
[19,]  0.380892154  0.55368777
[20,] -0.839829951  1.57982751
[21,]  1.062388497  1.55869226
[22,] -1.587962428 -0.58420920
[23,]  0.280847384 -2.28792325
[24,]  0.402823406 -1.23113945
[25,] -0.379230528  1.60961436
[26,] -0.157395528 -0.11987466
[27,] -1.980905984 -1.12834064
[28,] -0.006954711  0.58372403
[29,] -1.052865925  1.73695930
[30,] -0.889733145  0.58669907
[31,]  0.125061367  0.47573229
[32,] -0.744212634 -0.67000996
[33,] -0.794645048  2.05292234
[34,] -0.644489012  0.34684178
[35,] -1.497526650 -0.91411102
[36,]  1.235293991 -0.35958485
[37,]  1.206430502  0.13007892
[38,] -0.377411217  1.61435326
[39,] -1.633735748  0.62584145
[40,] -0.633194763  0.45224093
[41,] -0.399554489  1.71325062
[42,]  1.900013337  1.34129117
[43,] -0.816769722 -0.63700014
[44,]  1.518024433  0.16239552
[45,]  0.507684994  0.92069195
[46,]  0.295223546 -0.39939464
[47,] -0.469135966  0.04658115
[48,] -0.123957265  0.26925246
[49,] -1.552106369  0.33977695
[50,]  0.537321686 -0.01011940
| |
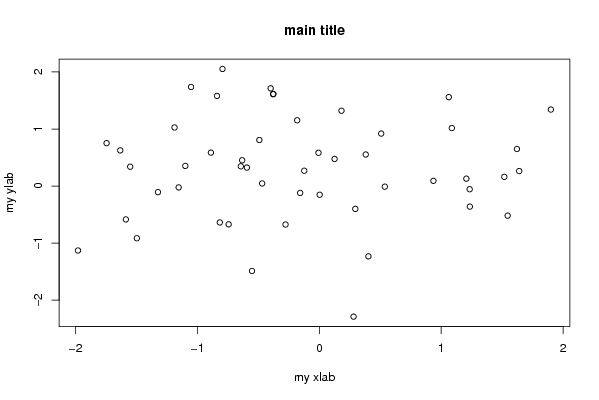
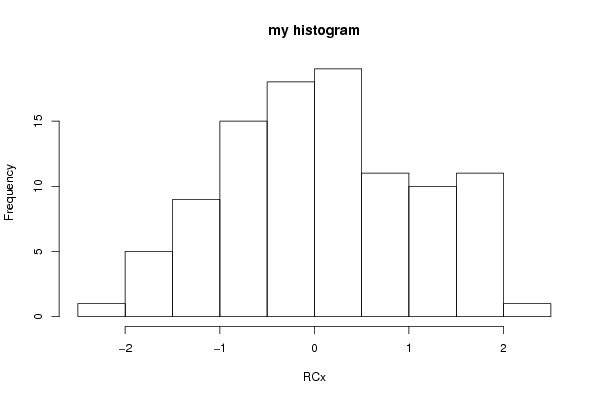
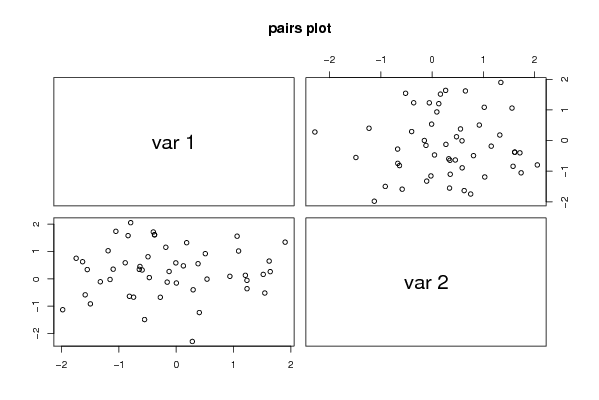
Figures (Output of Computation) | |
Input Parameters & R Code | |
| Parameters (Session): | |
| par1 = 5 ; par2 = 7 ; par3 = hello ; | |
| Parameters (R input): | |
| R code (body of R function): | |
{ | |