Free Statistics

of Irreproducible Research!

Author's title

Author*Unverified author*
R Software Modulerwasp_notchedbox1.wasp
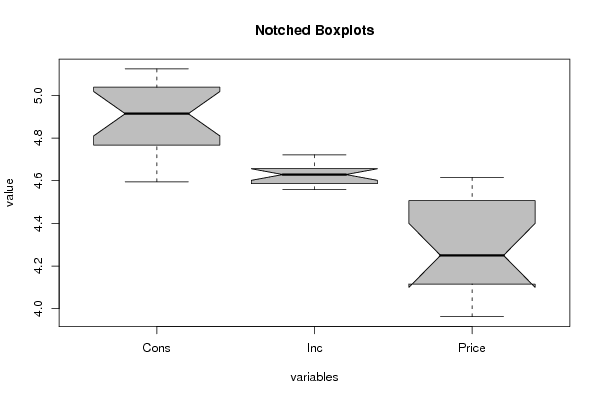
Title produced by softwareNotched Boxplots
Date of computationThu, 30 Oct 2008 11:22:47 -0600
Cite this page as followsStatistical Computations at FreeStatistics.org, Office for Research Development and Education, URL https://freestatistics.org/blog/index.php?v=date/2008/Oct/30/t12253874624wl0vo7pddws58d.htm/, Retrieved Sun, 19 May 2024 16:35:00 +0000
Statistical Computations at FreeStatistics.org, Office for Research Development and Education, URL https://freestatistics.org/blog/index.php?pk=20129, Retrieved Sun, 19 May 2024 16:35:00 +0000
QR Codes:

Original text written by user:
IsPrivate?No (this computation is public)
User-defined keywords
Estimated Impact165
Family? (F = Feedback message, R = changed R code, M = changed R Module, P = changed Parameters, D = changed Data)
F     [Mean Plot] [q2 mean plot] [2008-10-30 14:52:35] [85134b6edb9973b9193450dd2306c65b]
F RM D  [Notched Boxplots] [task 2 notched bo...] [2008-10-30 17:01:13] [85134b6edb9973b9193450dd2306c65b]
F R PD      [Notched Boxplots] [task 3 notched bo...] [2008-10-30 17:22:47] [4940af498c7c54f3992f17142bd40069] [Current]
Feedback Forum
2008-11-09 13:03:29 [Nathalie Boden] [reply
Zo zie ik dat ik de r-code fout heb ingevuld. Ik moet log(z) invullen in de eerste regel van de r-code. We moeten er wel op letten dat een logaritme van een negatief getal niet kan. Via de aanpassing van deze code wordt ervoor gezorgd dat grote schommelingen in de datareeks worden afgevlakt en dat de kleine schommelingen groter worden. De outliers komen veel meer naar het gemiddelde. Je gaat dus met andere woorden de spreiding gaan verkleinen/aanpassen.
2008-11-11 13:26:36 [Dries Van Gheluwe] [reply
Bij deze verbetering kan ik niets toevoegen. Door een logaritme krijg je gewoon kleinere waarden.

Post a new message
Dataseries X:
99.2	96.7	101.0
99.0	98.1	100.1
100.0	100.0	100.0
111.6	104.9	90.6
122.2	104.9	86.5
117.6	109.5	89.7
121.1	110.8	90.6
136.0	112.3	82.8
154.2	109.3	70.1
153.6	105.3	65.4
158.5	101.7	61.3
140.6	95.4	62.5
136.2	96.4	63.6
168.0	97.6	52.6
154.3	102.4	59.7
149.0	101.6	59.5
165.5	103.8	61.3


Summary of computational transaction
Raw Inputview raw input (R code)
Raw Outputview raw output of R engine
Computing time2 seconds
R Server'George Udny Yule' @ 72.249.76.132

\begin{tabular}{lllllllll}
\hline
Summary of computational transaction \tabularnewline
Raw Input & view raw input (R code)  \tabularnewline
Raw Output & view raw output of R engine  \tabularnewline
Computing time & 2 seconds \tabularnewline
R Server & 'George Udny Yule' @ 72.249.76.132 \tabularnewline
\hline
\end{tabular}
%Source: https://freestatistics.org/blog/index.php?pk=20129&T=0

[TABLE]
[ROW][C]Summary of computational transaction[/C][/ROW]
[ROW][C]Raw Input[/C][C]view raw input (R code) [/C][/ROW]
[ROW][C]Raw Output[/C][C]view raw output of R engine [/C][/ROW]
[ROW][C]Computing time[/C][C]2 seconds[/C][/ROW]
[ROW][C]R Server[/C][C]'George Udny Yule' @ 72.249.76.132[/C][/ROW]
[/TABLE]
Source: https://freestatistics.org/blog/index.php?pk=20129&T=0

Globally Unique Identifier (entire table): ba.freestatistics.org/blog/index.php?pk=20129&T=0

As an alternative you can also use a QR Code:  

The GUIDs for individual cells are displayed in the table below:

Summary of computational transaction
Raw Inputview raw input (R code)
Raw Outputview raw output of R engine
Computing time2 seconds
R Server'George Udny Yule' @ 72.249.76.132


Boxplot statistics
Variablelower whiskerlower hingemedianupper hingeupper whisker
Cons4.595119850134594.767289035464534.914124393715415.038250461129235.12396397940326
Inc4.558078578454244.585987366571324.628886712605414.656813419139934.7211738617444
Price3.962716119743664.115779842942174.249922794040544.506454213048934.61512051684126

\begin{tabular}{lllllllll}
\hline
Boxplot statistics \tabularnewline
Variable & lower whisker & lower hinge & median & upper hinge & upper whisker \tabularnewline
Cons & 4.59511985013459 & 4.76728903546453 & 4.91412439371541 & 5.03825046112923 & 5.12396397940326 \tabularnewline
Inc & 4.55807857845424 & 4.58598736657132 & 4.62888671260541 & 4.65681341913993 & 4.7211738617444 \tabularnewline
Price & 3.96271611974366 & 4.11577984294217 & 4.24992279404054 & 4.50645421304893 & 4.61512051684126 \tabularnewline
\hline
\end{tabular}
%Source: https://freestatistics.org/blog/index.php?pk=20129&T=1

[TABLE]
[ROW][C]Boxplot statistics[/C][/ROW]
[ROW][C]Variable[/C][C]lower whisker[/C][C]lower hinge[/C][C]median[/C][C]upper hinge[/C][C]upper whisker[/C][/ROW]
[ROW][C]Cons[/C][C]4.59511985013459[/C][C]4.76728903546453[/C][C]4.91412439371541[/C][C]5.03825046112923[/C][C]5.12396397940326[/C][/ROW]
[ROW][C]Inc[/C][C]4.55807857845424[/C][C]4.58598736657132[/C][C]4.62888671260541[/C][C]4.65681341913993[/C][C]4.7211738617444[/C][/ROW]
[ROW][C]Price[/C][C]3.96271611974366[/C][C]4.11577984294217[/C][C]4.24992279404054[/C][C]4.50645421304893[/C][C]4.61512051684126[/C][/ROW]
[/TABLE]
Source: https://freestatistics.org/blog/index.php?pk=20129&T=1

Globally Unique Identifier (entire table): ba.freestatistics.org/blog/index.php?pk=20129&T=1

As an alternative you can also use a QR Code:  

The GUIDs for individual cells are displayed in the table below:

Boxplot statistics
Variablelower whiskerlower hingemedianupper hingeupper whisker
Cons4.595119850134594.767289035464534.914124393715415.038250461129235.12396397940326
Inc4.558078578454244.585987366571324.628886712605414.656813419139934.7211738617444
Price3.962716119743664.115779842942174.249922794040544.506454213048934.61512051684126


Boxplot Notches
Variablelower boundmedianupper bound
Cons4.810290271715184.914124393715415.01795851571564
Inc4.601745723938244.628886712605414.65602770127257
Price4.10021391902814.249922794040544.39963166905299

\begin{tabular}{lllllllll}
\hline
Boxplot Notches \tabularnewline
Variable & lower bound & median & upper bound \tabularnewline
Cons & 4.81029027171518 & 4.91412439371541 & 5.01795851571564 \tabularnewline
Inc & 4.60174572393824 & 4.62888671260541 & 4.65602770127257 \tabularnewline
Price & 4.1002139190281 & 4.24992279404054 & 4.39963166905299 \tabularnewline
\hline
\end{tabular}
%Source: https://freestatistics.org/blog/index.php?pk=20129&T=2

[TABLE]
[ROW][C]Boxplot Notches[/C][/ROW]
[ROW][C]Variable[/C][C]lower bound[/C][C]median[/C][C]upper bound[/C][/ROW]
[ROW][C]Cons[/C][C]4.81029027171518[/C][C]4.91412439371541[/C][C]5.01795851571564[/C][/ROW]
[ROW][C]Inc[/C][C]4.60174572393824[/C][C]4.62888671260541[/C][C]4.65602770127257[/C][/ROW]
[ROW][C]Price[/C][C]4.1002139190281[/C][C]4.24992279404054[/C][C]4.39963166905299[/C][/ROW]
[/TABLE]
Source: https://freestatistics.org/blog/index.php?pk=20129&T=2

Globally Unique Identifier (entire table): ba.freestatistics.org/blog/index.php?pk=20129&T=2

As an alternative you can also use a QR Code:  

The GUIDs for individual cells are displayed in the table below:

Boxplot Notches
Variablelower boundmedianupper bound
Cons4.810290271715184.914124393715415.01795851571564
Inc4.601745723938244.628886712605414.65602770127257
Price4.10021391902814.249922794040544.39963166905299


Parameters (Session):
par1 = grey ;
Parameters (R input):
par1 = grey ;
R code (references can be found in the software module):
z <- as.data.frame(t(y))
bitmap(file='test1.png')
(r<-boxplot(log (z) ,xlab=xlab,ylab=ylab,main=main,notch=TRUE,col=par1))
dev.off()
load(file='createtable')
a<-table.start()
a<-table.row.start(a)
a<-table.element(a,hyperlink('overview.htm','Boxplot statistics','Boxplot overview'),6,TRUE)
a<-table.row.end(a)
a<-table.row.start(a)
a<-table.element(a,'Variable',1,TRUE)
a<-table.element(a,hyperlink('lower_whisker.htm','lower whisker','definition of lower whisker'),1,TRUE)
a<-table.element(a,hyperlink('lower_hinge.htm','lower hinge','definition of lower hinge'),1,TRUE)
a<-table.element(a,hyperlink('central_tendency.htm','median','definitions about measures of central tendency'),1,TRUE)
a<-table.element(a,hyperlink('upper_hinge.htm','upper hinge','definition of upper hinge'),1,TRUE)
a<-table.element(a,hyperlink('upper_whisker.htm','upper whisker','definition of upper whisker'),1,TRUE)
a<-table.row.end(a)
for (i in 1:length(y[,1]))
{
a<-table.row.start(a)
a<-table.element(a,dimnames(t(x))[[2]][i],1,TRUE)
for (j in 1:5)
{
a<-table.element(a,r$stats[j,i])
}
a<-table.row.end(a)
}
a<-table.end(a)
table.save(a,file='mytable.tab')
a<-table.start()
a<-table.row.start(a)
a<-table.element(a,'Boxplot Notches',4,TRUE)
a<-table.row.end(a)
a<-table.row.start(a)
a<-table.element(a,'Variable',1,TRUE)
a<-table.element(a,'lower bound',1,TRUE)
a<-table.element(a,'median',1,TRUE)
a<-table.element(a,'upper bound',1,TRUE)
a<-table.row.end(a)
for (i in 1:length(y[,1]))
{
a<-table.row.start(a)
a<-table.element(a,dimnames(t(x))[[2]][i],1,TRUE)
a<-table.element(a,r$conf[1,i])
a<-table.element(a,r$stats[3,i])
a<-table.element(a,r$conf[2,i])
a<-table.row.end(a)
}
a<-table.end(a)
table.save(a,file='mytable1.tab')