Free Statistics

of Irreproducible Research!

Author's title

Author*The author of this computation has been verified*
R Software Modulerwasp_meanplot.wasp
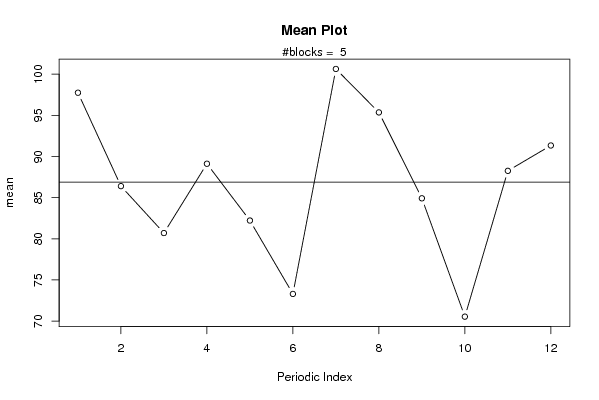
Title produced by softwareMean Plot
Date of computationThu, 30 Oct 2008 10:05:14 -0600
Cite this page as followsStatistical Computations at FreeStatistics.org, Office for Research Development and Education, URL https://freestatistics.org/blog/index.php?v=date/2008/Oct/30/t12253827803mqm6zit5iglb2h.htm/, Retrieved Wed, 29 May 2024 00:10:59 +0000
Statistical Computations at FreeStatistics.org, Office for Research Development and Education, URL https://freestatistics.org/blog/index.php?pk=20111, Retrieved Wed, 29 May 2024 00:10:59 +0000
QR Codes:

Original text written by user:
IsPrivate?No (this computation is public)
User-defined keywords
Estimated Impact179
Family? (F = Feedback message, R = changed R code, M = changed R Module, P = changed Parameters, D = changed Data)
F     [Mean Plot] [workshop 3] [2007-10-26 12:14:28] [e9ffc5de6f8a7be62f22b142b5b6b1a8]
F    D    [Mean Plot] [Q2 Mean plot] [2008-10-30 16:05:14] [e4cb5a8878d0401c2e8d19a1768b515b] [Current]
F R  D      [Mean Plot] [Task 4] [2008-11-03 19:33:38] [cf9c64468d04c2c4dd548cc66b4e3677]
F    D      [Mean Plot] [TAsk 5] [2008-11-03 19:53:26] [cf9c64468d04c2c4dd548cc66b4e3677]
Feedback Forum
2008-11-08 19:53:33 [Jan Van Riet] [reply
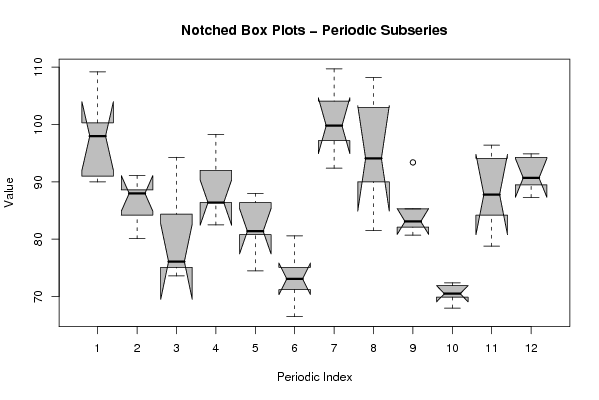
Op de notched boxplots-periodic subseries kunnen we duidelijk wel aflezen dat er seizonaliteit heerst in augustus en steptember. Mijn antwoord is dus fout.
2008-11-09 16:37:07 [Kenny Simons] [reply
Je antwoord was inderdaad fout Jan. Elk punt van de grafiek van het mean plot geeft een periodiek gemiddelde weer van een bepaalde maand over een x-aantal jaren. Hierdoor kan je wel degelijk uit de grafiek afleiden of er seizoenaliteit is in bepaalde maanden.

We zien op de grafiek dat het gemiddelde van de maand augustus duidelijk anders is als het gemiddelde van de maand september, maar aan de hand van deze grafiek kunnen we nog niet zeggen dat dit verschil significant is.

Hierdoor moeten we ook de grafiek van de notched box plots bestuderen. Als we naar deze grafiek kijken, merken we dat er een groot verschil is tussen de boxplot van de maand maart en deze van augustus en september.

Doordat het verschil zowel te zien is op de grafiek van de mean plot als op de grafiek van de notched box plots kunnen we stellen dat het verschil wel degelijk significant is en dat er wel degelijk seizoenliteit is in deze tijdreeks.
2008-11-11 15:36:33 [Michaël De Kuyer] [reply
Het antwoord is inderdaad fout. De student moest de blockwitdh instellen 12 : http://www.freestatistics.org/blog/date/2008/Nov/05/t1225907740u81va5u7pjjlkvn.htm. Als men zich baseert op de mean plot kan ik onder andere vaststellen dat de waarde in de zesde maand beduidend lager ligt dan van de zevende maand. Aan de hand van de notched boxplot kan men vaststellen dat het gaat over een significant verschil, aangezien het betrouwbaarheidsinterval van maand 6 dat van maand 7 niet overlapt. We kunnen dus spreken van seizonaliteit in de tijdreeks.
2008-11-11 23:21:51 [Joris Deboel] [reply
Seizoenaliteit is wel duidelijk aanwezig als we naar de grafiek gaan kijken. De conclusie is dus fout getrokken.

Post a new message
Dataseries X:
109,20
88,60
94,30
98,30
86,40
80,60
104,10
108,20
93,40
71,90
94,10
94,90
96,40
91,10
84,40
86,40
88,00
75,10
109,70
103,00
82,10
68,00
96,40
94,30
90,00
88,00
76,10
82,50
81,40
66,50
97,20
94,10
80,70
70,50
87,80
89,50
99,60
84,20
75,10
92,00
80,80
73,10
99,80
90,00
83,10
72,40
78,80
87,30
91,00
80,10
73,60
86,40
74,50
71,20
92,40
81,50
85,30
69,90
84,20
90,70
100,30


Summary of computational transaction
Raw Inputview raw input (R code)
Raw Outputview raw output of R engine
Computing time2 seconds
R Server'Gwilym Jenkins' @ 72.249.127.135

\begin{tabular}{lllllllll}
\hline
Summary of computational transaction \tabularnewline
Raw Input & view raw input (R code)  \tabularnewline
Raw Output & view raw output of R engine  \tabularnewline
Computing time & 2 seconds \tabularnewline
R Server & 'Gwilym Jenkins' @ 72.249.127.135 \tabularnewline
\hline
\end{tabular}
%Source: https://freestatistics.org/blog/index.php?pk=20111&T=0

[TABLE]
[ROW][C]Summary of computational transaction[/C][/ROW]
[ROW][C]Raw Input[/C][C]view raw input (R code) [/C][/ROW]
[ROW][C]Raw Output[/C][C]view raw output of R engine [/C][/ROW]
[ROW][C]Computing time[/C][C]2 seconds[/C][/ROW]
[ROW][C]R Server[/C][C]'Gwilym Jenkins' @ 72.249.127.135[/C][/ROW]
[/TABLE]
Source: https://freestatistics.org/blog/index.php?pk=20111&T=0

Globally Unique Identifier (entire table): ba.freestatistics.org/blog/index.php?pk=20111&T=0

As an alternative you can also use a QR Code:  

The GUIDs for individual cells are displayed in the table below:

Summary of computational transaction
Raw Inputview raw input (R code)
Raw Outputview raw output of R engine
Computing time2 seconds
R Server'Gwilym Jenkins' @ 72.249.127.135


Parameters (Session):
par1 = 12 ;
Parameters (R input):
par1 = 12 ;
R code (references can be found in the software module):
par1 <- as.numeric(par1)
(n <- length(x))
(np <- floor(n / par1))
arr <- array(NA,dim=c(par1,np+1))
ari <- array(0,dim=par1)
j <- 0
for (i in 1:n)
{
j = j + 1
ari[j] = ari[j] + 1
arr[j,ari[j]] <- x[i]
if (j == par1) j = 0
}
ari
arr
arr.mean <- array(NA,dim=par1)
arr.median <- array(NA,dim=par1)
arr.midrange <- array(NA,dim=par1)
for (j in 1:par1)
{
arr.mean[j] <- mean(arr[j,],na.rm=TRUE)
arr.median[j] <- median(arr[j,],na.rm=TRUE)
arr.midrange[j] <- (quantile(arr[j,],0.75,na.rm=TRUE) + quantile(arr[j,],0.25,na.rm=TRUE)) / 2
}
overall.mean <- mean(x)
overall.median <- median(x)
overall.midrange <- (quantile(x,0.75) + quantile(x,0.25)) / 2
bitmap(file='plot1.png')
plot(arr.mean,type='b',ylab='mean',main='Mean Plot',xlab='Periodic Index')
mtext(paste('#blocks = ',np))
abline(overall.mean,0)
dev.off()
bitmap(file='plot2.png')
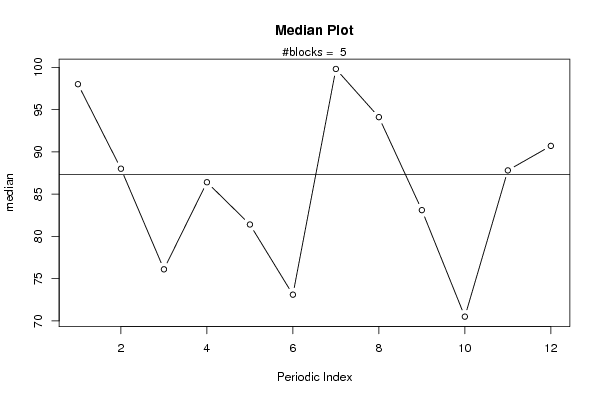
plot(arr.median,type='b',ylab='median',main='Median Plot',xlab='Periodic Index')
mtext(paste('#blocks = ',np))
abline(overall.median,0)
dev.off()
bitmap(file='plot3.png')
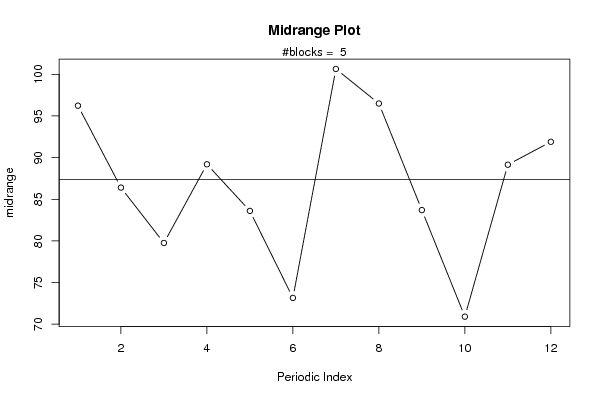
plot(arr.midrange,type='b',ylab='midrange',main='Midrange Plot',xlab='Periodic Index')
mtext(paste('#blocks = ',np))
abline(overall.midrange,0)
dev.off()
bitmap(file='plot4.png')
z <- data.frame(t(arr))
names(z) <- c(1:par1)
(boxplot(z,notch=TRUE,col='grey',xlab='Periodic Index',ylab='Value',main='Notched Box Plots - Periodic Subseries'))
dev.off()
bitmap(file='plot5.png')
z <- data.frame(arr)
names(z) <- c(1:np)
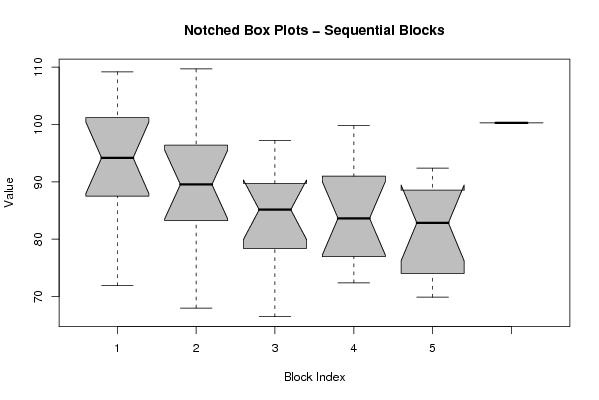
(boxplot(z,notch=TRUE,col='grey',xlab='Block Index',ylab='Value',main='Notched Box Plots - Sequential Blocks'))
dev.off()
bitmap(file='plot6.png')
z <- data.frame(cbind(arr.mean,arr.median,arr.midrange))
names(z) <- list('mean','median','midrange')
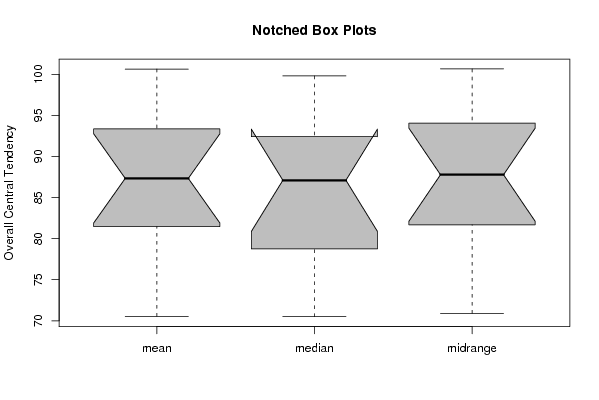
(boxplot(z,notch=TRUE,col='grey',ylab='Overall Central Tendency',main='Notched Box Plots'))
dev.off()