Free Statistics

of Irreproducible Research!

Author's title

Author*The author of this computation has been verified*
R Software Modulerwasp_pairs.wasp
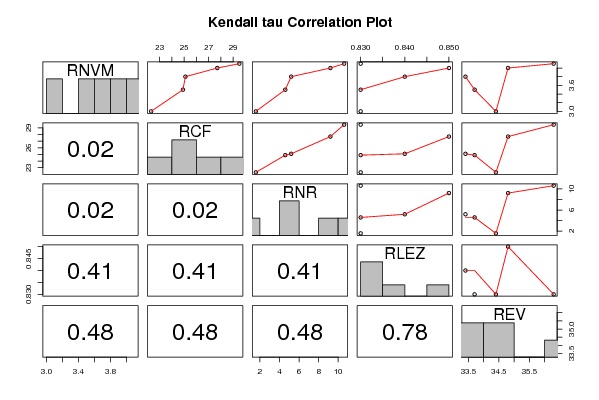
Title produced by softwareKendall tau Correlation Matrix
Date of computationThu, 30 Oct 2008 08:28:38 -0600
Cite this page as followsStatistical Computations at FreeStatistics.org, Office for Research Development and Education, URL https://freestatistics.org/blog/index.php?v=date/2008/Oct/30/t1225377371dbiafudo7uawftt.htm/, Retrieved Sun, 19 May 2024 15:58:25 +0000
Statistical Computations at FreeStatistics.org, Office for Research Development and Education, URL https://freestatistics.org/blog/index.php?pk=20064, Retrieved Sun, 19 May 2024 15:58:25 +0000
QR Codes:

Original text written by user:
IsPrivate?No (this computation is public)
User-defined keywords
Estimated Impact165
Family? (F = Feedback message, R = changed R code, M = changed R Module, P = changed Parameters, D = changed Data)
F     [Mean Plot] [workshop 3] [2007-10-26 12:14:28] [e9ffc5de6f8a7be62f22b142b5b6b1a8]
F RMPD  [Blocked Bootstrap Plot - Central Tendency] [vraag 4] [2008-10-29 19:47:27] [c45c87b96bbf32ffc2144fc37d767b2e]
F RMPD    [Kendall tau Correlation Matrix] [vraag 1] [2008-10-30 14:09:39] [c45c87b96bbf32ffc2144fc37d767b2e]
F    D        [Kendall tau Correlation Matrix] [vraag 1] [2008-10-30 14:28:38] [3dc594a6c62226e1e98766c4d385bfaa] [Current]
Feedback Forum
2008-11-06 12:23:21 [Ken Van den Heuvel] [reply
Ten eerste snap ik niet waarom je de data van voor 1993 buiten beschouwing laat.
In principe geldt: hoe groter je tijdsbestek hoe beter dit is om voorspelling te kunnen maken. Deze keuze lijkt mij dan ook bijzonder vreemd. Boven dien bekom je hier nogal vreemde resultaten (in de tabel van je berekening zie je zo onderandere dat RNVM 100% gecorreleerd is met RCF en RNR). Hadden we de gegevens niet gewijzigd dan bekomen we toch opmerkelijk andere resultaten...
http://www.freestatistics.org/blog/date/2008/Oct/30/t12253759155j12ohqs6khyzlf.htm

Ten tweede interpreteer je de geplote figuur verkeerd. De waarden die hierin voorkomen zijn de p-waarden, de betrouwbaarheid van de correlaties (p-waarde onder 0,05 wijst op een betrouwbare correlatie) ! In de tabel die erboven staat staan de werkelijke correlaties (onder tau).

Uit jouw productie met de gewijzigde gegevens zou dit oftewel RCF of RNVM moeten zijn met dezelfde correlatie van 100% en de kleinste p-waarde. Bekijken we dit nu opnieuw met alle gegevens dan blijkt RCF het meest geschikt te zijn met de hoogste correlatie en de kleinste p-waarde.

Post a new message
Dataseries X:
3	22.3	1.6	0.83	34.4
3.8	25.1	5.2	0.84	33.4
4	27.7	9.2	0.85	34.8
3.5	24.9	4.6	0.83	33.7
4.1	29.5	10.6	0.83	36.3


Summary of computational transaction
Raw Inputview raw input (R code)
Raw Outputview raw output of R engine
Computing time1 seconds
R Server'Gwilym Jenkins' @ 72.249.127.135

\begin{tabular}{lllllllll}
\hline
Summary of computational transaction \tabularnewline
Raw Input & view raw input (R code)  \tabularnewline
Raw Output & view raw output of R engine  \tabularnewline
Computing time & 1 seconds \tabularnewline
R Server & 'Gwilym Jenkins' @ 72.249.127.135 \tabularnewline
\hline
\end{tabular}
%Source: https://freestatistics.org/blog/index.php?pk=20064&T=0

[TABLE]
[ROW][C]Summary of computational transaction[/C][/ROW]
[ROW][C]Raw Input[/C][C]view raw input (R code) [/C][/ROW]
[ROW][C]Raw Output[/C][C]view raw output of R engine [/C][/ROW]
[ROW][C]Computing time[/C][C]1 seconds[/C][/ROW]
[ROW][C]R Server[/C][C]'Gwilym Jenkins' @ 72.249.127.135[/C][/ROW]
[/TABLE]
Source: https://freestatistics.org/blog/index.php?pk=20064&T=0

Globally Unique Identifier (entire table): ba.freestatistics.org/blog/index.php?pk=20064&T=0

As an alternative you can also use a QR Code:  

The GUIDs for individual cells are displayed in the table below:

Summary of computational transaction
Raw Inputview raw input (R code)
Raw Outputview raw output of R engine
Computing time1 seconds
R Server'Gwilym Jenkins' @ 72.249.127.135


Kendall tau rank correlations for all pairs of data series
pairtaup-value
tau( RNVM , RCF )10.0166666666666666
tau( RNVM , RNR )10.0166666666666666
tau( RNVM , RLEZ )0.3585685828003180.405380556458943
tau( RNVM , REV )0.40.483333333333333
tau( RCF , RNR )10.0166666666666666
tau( RCF , RLEZ )0.3585685828003180.405380556458943
tau( RCF , REV )0.40.483333333333333
tau( RNR , RLEZ )0.3585685828003180.405380556458943
tau( RNR , REV )0.40.483333333333333
tau( RLEZ , REV )-0.1195228609334390.781511294998713

\begin{tabular}{lllllllll}
\hline
Kendall tau rank correlations for all pairs of data series \tabularnewline
pair & tau & p-value \tabularnewline
tau( RNVM , RCF ) & 1 & 0.0166666666666666 \tabularnewline
tau( RNVM , RNR ) & 1 & 0.0166666666666666 \tabularnewline
tau( RNVM , RLEZ ) & 0.358568582800318 & 0.405380556458943 \tabularnewline
tau( RNVM , REV ) & 0.4 & 0.483333333333333 \tabularnewline
tau( RCF , RNR ) & 1 & 0.0166666666666666 \tabularnewline
tau( RCF , RLEZ ) & 0.358568582800318 & 0.405380556458943 \tabularnewline
tau( RCF , REV ) & 0.4 & 0.483333333333333 \tabularnewline
tau( RNR , RLEZ ) & 0.358568582800318 & 0.405380556458943 \tabularnewline
tau( RNR , REV ) & 0.4 & 0.483333333333333 \tabularnewline
tau( RLEZ , REV ) & -0.119522860933439 & 0.781511294998713 \tabularnewline
\hline
\end{tabular}
%Source: https://freestatistics.org/blog/index.php?pk=20064&T=1

[TABLE]
[ROW][C]Kendall tau rank correlations for all pairs of data series[/C][/ROW]
[ROW][C]pair[/C][C]tau[/C][C]p-value[/C][/ROW]
[ROW][C]tau( RNVM , RCF )[/C][C]1[/C][C]0.0166666666666666[/C][/ROW]
[ROW][C]tau( RNVM , RNR )[/C][C]1[/C][C]0.0166666666666666[/C][/ROW]
[ROW][C]tau( RNVM , RLEZ )[/C][C]0.358568582800318[/C][C]0.405380556458943[/C][/ROW]
[ROW][C]tau( RNVM , REV )[/C][C]0.4[/C][C]0.483333333333333[/C][/ROW]
[ROW][C]tau( RCF , RNR )[/C][C]1[/C][C]0.0166666666666666[/C][/ROW]
[ROW][C]tau( RCF , RLEZ )[/C][C]0.358568582800318[/C][C]0.405380556458943[/C][/ROW]
[ROW][C]tau( RCF , REV )[/C][C]0.4[/C][C]0.483333333333333[/C][/ROW]
[ROW][C]tau( RNR , RLEZ )[/C][C]0.358568582800318[/C][C]0.405380556458943[/C][/ROW]
[ROW][C]tau( RNR , REV )[/C][C]0.4[/C][C]0.483333333333333[/C][/ROW]
[ROW][C]tau( RLEZ , REV )[/C][C]-0.119522860933439[/C][C]0.781511294998713[/C][/ROW]
[/TABLE]
Source: https://freestatistics.org/blog/index.php?pk=20064&T=1

Globally Unique Identifier (entire table): ba.freestatistics.org/blog/index.php?pk=20064&T=1

As an alternative you can also use a QR Code:  

The GUIDs for individual cells are displayed in the table below:

Kendall tau rank correlations for all pairs of data series
pairtaup-value
tau( RNVM , RCF )10.0166666666666666
tau( RNVM , RNR )10.0166666666666666
tau( RNVM , RLEZ )0.3585685828003180.405380556458943
tau( RNVM , REV )0.40.483333333333333
tau( RCF , RNR )10.0166666666666666
tau( RCF , RLEZ )0.3585685828003180.405380556458943
tau( RCF , REV )0.40.483333333333333
tau( RNR , RLEZ )0.3585685828003180.405380556458943
tau( RNR , REV )0.40.483333333333333
tau( RLEZ , REV )-0.1195228609334390.781511294998713


Parameters (Session):
Parameters (R input):
R code (references can be found in the software module):
panel.tau <- function(x, y, digits=2, prefix='', cex.cor)
{
usr <- par('usr'); on.exit(par(usr))
par(usr = c(0, 1, 0, 1))
rr <- cor.test(x, y, method='kendall')
r <- round(rr$p.value,2)
txt <- format(c(r, 0.123456789), digits=digits)[1]
txt <- paste(prefix, txt, sep='')
if(missing(cex.cor)) cex <- 0.5/strwidth(txt)
text(0.5, 0.5, txt, cex = cex)
}
panel.hist <- function(x, ...)
{
usr <- par('usr'); on.exit(par(usr))
par(usr = c(usr[1:2], 0, 1.5) )
h <- hist(x, plot = FALSE)
breaks <- h$breaks; nB <- length(breaks)
y <- h$counts; y <- y/max(y)
rect(breaks[-nB], 0, breaks[-1], y, col='grey', ...)
}
bitmap(file='test1.png')
pairs(t(y),diag.panel=panel.hist, upper.panel=panel.smooth, lower.panel=panel.tau, main=main)
dev.off()
load(file='createtable')
a<-table.start()
a<-table.row.start(a)
a<-table.element(a,'Kendall tau rank correlations for all pairs of data series',3,TRUE)
a<-table.row.end(a)
a<-table.row.start(a)
a<-table.element(a,'pair',1,TRUE)
a<-table.element(a,'tau',1,TRUE)
a<-table.element(a,'p-value',1,TRUE)
a<-table.row.end(a)
n <- length(y[,1])
n
cor.test(y[1,],y[2,],method='kendall')
for (i in 1:(n-1))
{
for (j in (i+1):n)
{
a<-table.row.start(a)
dum <- paste('tau(',dimnames(t(x))[[2]][i])
dum <- paste(dum,',')
dum <- paste(dum,dimnames(t(x))[[2]][j])
dum <- paste(dum,')')
a<-table.element(a,dum,header=TRUE)
r <- cor.test(y[i,],y[j,],method='kendall')
a<-table.element(a,r$estimate)
a<-table.element(a,r$p.value)
a<-table.row.end(a)
}
}
a<-table.end(a)
table.save(a,file='mytable.tab')