Free Statistics

of Irreproducible Research!

Author's title

Author*The author of this computation has been verified*
R Software Modulerwasp_notchedbox1.wasp
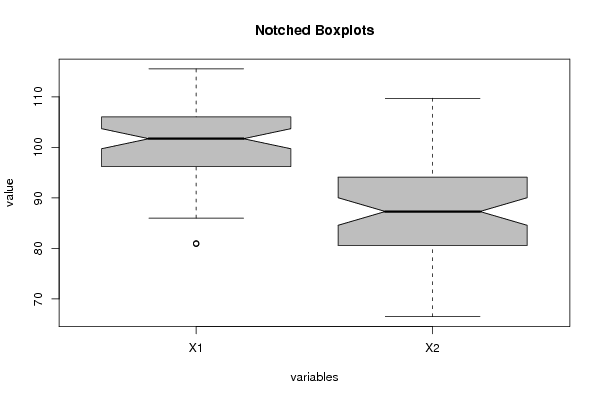
Title produced by softwareNotched Boxplots
Date of computationThu, 30 Oct 2008 06:39:44 -0600
Cite this page as followsStatistical Computations at FreeStatistics.org, Office for Research Development and Education, URL https://freestatistics.org/blog/index.php?v=date/2008/Oct/30/t1225370500ofy3siptoh11b3k.htm/, Retrieved Sun, 19 May 2024 14:41:57 +0000
Statistical Computations at FreeStatistics.org, Office for Research Development and Education, URL https://freestatistics.org/blog/index.php?pk=19992, Retrieved Sun, 19 May 2024 14:41:57 +0000
QR Codes:

Original text written by user:
IsPrivate?No (this computation is public)
User-defined keywords
Estimated Impact220
Family? (F = Feedback message, R = changed R code, M = changed R Module, P = changed Parameters, D = changed Data)
F     [Notched Boxplots] [workshop 3] [2007-10-26 13:31:48] [e9ffc5de6f8a7be62f22b142b5b6b1a8]
F    D    [Notched Boxplots] [Hypothesis Testin...] [2008-10-30 12:39:44] [284c7cdb9fcda2adcbb08e211682c8d6] [Current]
F    D      [Notched Boxplots] [Hypothesis Testin...] [2008-10-30 14:07:27] [82970caad4b026be9dd352fdec547fe4]
F R  D        [Notched Boxplots] [Hypothesis Testin...] [2008-10-30 14:20:57] [82970caad4b026be9dd352fdec547fe4]
F               [Notched Boxplots] [Hypothesis Testin...] [2008-11-02 13:49:53] [d32f94eec6fe2d8c421bd223368a5ced]
-               [Notched Boxplots] [Hypothesis Testin...] [2008-11-06 18:24:18] [c65b85921bf03b2616bf1bee11088685]
F    D        [Notched Boxplots] [Hypothesis Testin...] [2008-11-02 13:47:08] [d32f94eec6fe2d8c421bd223368a5ced]
-    D        [Notched Boxplots] [Hypothesis Testin...] [2008-11-06 18:22:11] [c65b85921bf03b2616bf1bee11088685]
F           [Notched Boxplots] [Hypothesis Testin...] [2008-11-02 13:34:47] [d32f94eec6fe2d8c421bd223368a5ced]
Feedback Forum
2008-11-06 13:38:55 [Nathalie Koulouris] [reply
De student heeft deze vraag correct opgelost. Hij had zijn antwoord nog beter kunnen maken door te vermelden dat de mediaan significant lager ligt en dus niet te wijten is aan het toeval.
2008-11-06 17:39:46 [Romina Machiels] [reply
De student heeft de vraag goed beantwoord. Een extra detail dat hij er had kunnen bijvoegen was te zeggen dat de mediaan van de kledingproductie significant lager ligt dan deze van de totale productie, dat dit dus niet te wijten is aan toevalligheid. Dit kan men afleiden door de uiteinden van de notches van de kledingproductie door te trekken tot aan de grafiek van de totale productie. Deze lijnen komen niet in de buurt van de uiteinden van de nothces van de totale productie en daaruit kan je dan besluiten dat het verschil significant is.
2008-11-07 13:05:02 [Jeroen Aerts] [reply
Inderdaad, zoals de vorige 2 posts hierboven had de student het woord 'significant' of 'beduidend' lager/hoger moeten gebruiken wanneer hij concludeerde dat de totale production hoger ligt dan de clothing production. en dat zien we inderdaad doordat, wanneer we de betrouwbaarheidsintervallen op elkaar box plotten projecteren, deze niet op elkaar vallen.

Wat hierboven nog niet is vermeld, is dat de student wel een fout heeft gemaakt, namelijk hij concludeert dat je hierop geen spreiding kan aflezen terwijl je dit visueel wel kan. Het aambeeld van x1 is namelijk kleiner dan het aambeeld van x2, dat wil dus zeggen dat 50% van de punten dichter bij elkaar ligt, dus kan je al vaststellen dat de spreiding ook kleiner zal zijn dan x2, waar het aambeeld visueel groter is.

De student had uit de box plot ook nog het volgende kunnen concluderen:
je kan namelijk visueel waarnemen dat de mediaan van x1 boven de 100 ligt, en x2 duidelijk onder 100 ligt. Hieruit kan je concluderen dat de total production een beetje gestegen is tov het basisjaar en de clothing production gedaald is. Aangezien 100 op de verticale as staat voor het basisjaar.
2008-11-07 14:52:03 [Mehmet Yilmaz] [reply
De student heeft een correcte antwoord gegeven. De mediaan ligt significant lager. Want de betrouwbaarheidsinterval van kleding is ver van de betrouwbaarheidsinterval van de totale productie.
2008-11-08 14:28:52 [Kim Huysmans] [reply
Het klopt inderdaad dat de student deze vraag juist heeft opgelost, maar had er misschien nog iets meer uitleg kunnen bijzetten. Aangezien de mediaan van de totale productie iets boven de index van 100 ligt kunnen we stellen dat de industriële productie licht gestegen is t.o.v. het basisjaar. De inkepingen die we vaststellen in de boxplots stellen de 95% betrouwbaarheidsintervallen voor. Tussen dit betrouwbaarheidsinterval kan de mediaan verschuiven. Als we de lijnen van het betrouwbaarheidsinterval door trekken zien we dat deze elkaar niet overlappen en kunnen we stellen dat de mediaan van de kledingproductie significant lager ligt dan de mediaan van de totale productie. En kunnen we hierdoor toeval uitsluiten.
2008-11-11 11:50:56 [Jeroen Michel] [reply
Bij deze berekening wordt een correcte grafiek weergegeven. Bij x2 (kledij) is er inderdaad een daling tov. het jaar dat als basis geldt. De industriële productie daarentegen is wel lichtjes gestegen tov. het basisjaar.

Net zoals één van de vorige studenten zegt is het van belang te vermelden dat de mediaan significant lager ligt dan de mediaan van de totale productie.
2008-11-11 13:44:46 [Sanne Kerckhofs] [reply
Ik ben akkoord met de feedbacks van de vorige studenten betreffende het significante verschil.
Ik merk wel op dat er sprake is van plagiaat (niet vanuit Pieter) want ik heb deze link in iemand anders zijn werk teruggevonden.

Post a new message
Dataseries X:
110.40	109.20
96.40	88.60
101.90	94.30
106.20	98.30
81.00	86.40
94.70	80.60
101.00	104.10
109.40	108.20
102.30	93.40
90.70	71.90
96.20	94.10
96.10	94.90
106.00	96.40
103.10	91.10
102.00	84.40
104.70	86.40
86.00	88.00
92.10	75.10
106.90	109.70
112.60	103.00
101.70	82.10
92.00	68.00
97.40	96.40
97.00	94.30
105.40	90.00
102.70	88.00
98.10	76.10
104.50	82.50
87.40	81.40
89.90	66.50
109.80	97.20
111.70	94.10
98.60	80.70
96.90	70.50
95.10	87.80
97.00	89.50
112.70	99.60
102.90	84.20
97.40	75.10
111.40	92.00
87.40	80.80
96.80	73.10
114.10	99.80
110.30	90.00
103.90	83.10
101.60	72.40
94.60	78.80
95.90	87.30
104.70	91.00
102.80	80.10
98.10	73.60
113.90	86.40
80.90	74.50
95.70	71.20
113.20	92.40
105.90	81.50
108.80	85.30
102.30	69.90
99.00	84.20
100.70	90.70
115.50	100.30


Summary of computational transaction
Raw Inputview raw input (R code)
Raw Outputview raw output of R engine
Computing time7 seconds
R Server'Sir Ronald Aylmer Fisher' @ 193.190.124.24

\begin{tabular}{lllllllll}
\hline
Summary of computational transaction \tabularnewline
Raw Input & view raw input (R code)  \tabularnewline
Raw Output & view raw output of R engine  \tabularnewline
Computing time & 7 seconds \tabularnewline
R Server & 'Sir Ronald Aylmer Fisher' @ 193.190.124.24 \tabularnewline
\hline
\end{tabular}
%Source: https://freestatistics.org/blog/index.php?pk=19992&T=0

[TABLE]
[ROW][C]Summary of computational transaction[/C][/ROW]
[ROW][C]Raw Input[/C][C]view raw input (R code) [/C][/ROW]
[ROW][C]Raw Output[/C][C]view raw output of R engine [/C][/ROW]
[ROW][C]Computing time[/C][C]7 seconds[/C][/ROW]
[ROW][C]R Server[/C][C]'Sir Ronald Aylmer Fisher' @ 193.190.124.24[/C][/ROW]
[/TABLE]
Source: https://freestatistics.org/blog/index.php?pk=19992&T=0

Globally Unique Identifier (entire table): ba.freestatistics.org/blog/index.php?pk=19992&T=0

As an alternative you can also use a QR Code:  

The GUIDs for individual cells are displayed in the table below:

Summary of computational transaction
Raw Inputview raw input (R code)
Raw Outputview raw output of R engine
Computing time7 seconds
R Server'Sir Ronald Aylmer Fisher' @ 193.190.124.24


Boxplot statistics
Variablelower whiskerlower hingemedianupper hingeupper whisker
X18696.2101.7106115.5
X266.580.687.394.1109.7

\begin{tabular}{lllllllll}
\hline
Boxplot statistics \tabularnewline
Variable & lower whisker & lower hinge & median & upper hinge & upper whisker \tabularnewline
X1 & 86 & 96.2 & 101.7 & 106 & 115.5 \tabularnewline
X2 & 66.5 & 80.6 & 87.3 & 94.1 & 109.7 \tabularnewline
\hline
\end{tabular}
%Source: https://freestatistics.org/blog/index.php?pk=19992&T=1

[TABLE]
[ROW][C]Boxplot statistics[/C][/ROW]
[ROW][C]Variable[/C][C]lower whisker[/C][C]lower hinge[/C][C]median[/C][C]upper hinge[/C][C]upper whisker[/C][/ROW]
[ROW][C]X1[/C][C]86[/C][C]96.2[/C][C]101.7[/C][C]106[/C][C]115.5[/C][/ROW]
[ROW][C]X2[/C][C]66.5[/C][C]80.6[/C][C]87.3[/C][C]94.1[/C][C]109.7[/C][/ROW]
[/TABLE]
Source: https://freestatistics.org/blog/index.php?pk=19992&T=1

Globally Unique Identifier (entire table): ba.freestatistics.org/blog/index.php?pk=19992&T=1

As an alternative you can also use a QR Code:  

The GUIDs for individual cells are displayed in the table below:

Boxplot statistics
Variablelower whiskerlower hingemedianupper hingeupper whisker
X18696.2101.7106115.5
X266.580.687.394.1109.7


Boxplot Notches
Variablelower boundmedianupper bound
X199.717476951119101.7103.682523048881
X284.568973351031387.390.0310266489687

\begin{tabular}{lllllllll}
\hline
Boxplot Notches \tabularnewline
Variable & lower bound & median & upper bound \tabularnewline
X1 & 99.717476951119 & 101.7 & 103.682523048881 \tabularnewline
X2 & 84.5689733510313 & 87.3 & 90.0310266489687 \tabularnewline
\hline
\end{tabular}
%Source: https://freestatistics.org/blog/index.php?pk=19992&T=2

[TABLE]
[ROW][C]Boxplot Notches[/C][/ROW]
[ROW][C]Variable[/C][C]lower bound[/C][C]median[/C][C]upper bound[/C][/ROW]
[ROW][C]X1[/C][C]99.717476951119[/C][C]101.7[/C][C]103.682523048881[/C][/ROW]
[ROW][C]X2[/C][C]84.5689733510313[/C][C]87.3[/C][C]90.0310266489687[/C][/ROW]
[/TABLE]
Source: https://freestatistics.org/blog/index.php?pk=19992&T=2

Globally Unique Identifier (entire table): ba.freestatistics.org/blog/index.php?pk=19992&T=2

As an alternative you can also use a QR Code:  

The GUIDs for individual cells are displayed in the table below:

Boxplot Notches
Variablelower boundmedianupper bound
X199.717476951119101.7103.682523048881
X284.568973351031387.390.0310266489687


Parameters (Session):
par1 = grey ;
Parameters (R input):
par1 = grey ;
R code (references can be found in the software module):
z <- as.data.frame(t(y))
bitmap(file='test1.png')
(r<-boxplot(z ,xlab=xlab,ylab=ylab,main=main,notch=TRUE,col=par1))
dev.off()
load(file='createtable')
a<-table.start()
a<-table.row.start(a)
a<-table.element(a,hyperlink('overview.htm','Boxplot statistics','Boxplot overview'),6,TRUE)
a<-table.row.end(a)
a<-table.row.start(a)
a<-table.element(a,'Variable',1,TRUE)
a<-table.element(a,hyperlink('lower_whisker.htm','lower whisker','definition of lower whisker'),1,TRUE)
a<-table.element(a,hyperlink('lower_hinge.htm','lower hinge','definition of lower hinge'),1,TRUE)
a<-table.element(a,hyperlink('central_tendency.htm','median','definitions about measures of central tendency'),1,TRUE)
a<-table.element(a,hyperlink('upper_hinge.htm','upper hinge','definition of upper hinge'),1,TRUE)
a<-table.element(a,hyperlink('upper_whisker.htm','upper whisker','definition of upper whisker'),1,TRUE)
a<-table.row.end(a)
for (i in 1:length(y[,1]))
{
a<-table.row.start(a)
a<-table.element(a,dimnames(t(x))[[2]][i],1,TRUE)
for (j in 1:5)
{
a<-table.element(a,r$stats[j,i])
}
a<-table.row.end(a)
}
a<-table.end(a)
table.save(a,file='mytable.tab')
a<-table.start()
a<-table.row.start(a)
a<-table.element(a,'Boxplot Notches',4,TRUE)
a<-table.row.end(a)
a<-table.row.start(a)
a<-table.element(a,'Variable',1,TRUE)
a<-table.element(a,'lower bound',1,TRUE)
a<-table.element(a,'median',1,TRUE)
a<-table.element(a,'upper bound',1,TRUE)
a<-table.row.end(a)
for (i in 1:length(y[,1]))
{
a<-table.row.start(a)
a<-table.element(a,dimnames(t(x))[[2]][i],1,TRUE)
a<-table.element(a,r$conf[1,i])
a<-table.element(a,r$stats[3,i])
a<-table.element(a,r$conf[2,i])
a<-table.row.end(a)
}
a<-table.end(a)
table.save(a,file='mytable1.tab')