Free Statistics

of Irreproducible Research!

Author's title

Author*The author of this computation has been verified*
R Software Modulerwasp_meanplot.wasp
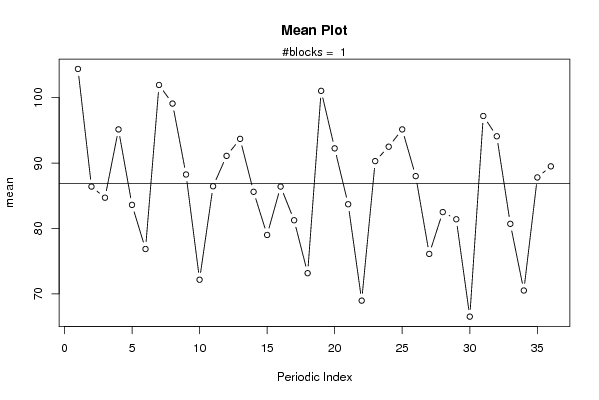
Title produced by softwareMean Plot
Date of computationWed, 29 Oct 2008 06:00:41 -0600
Cite this page as followsStatistical Computations at FreeStatistics.org, Office for Research Development and Education, URL https://freestatistics.org/blog/index.php?v=date/2008/Oct/29/t122528169272z33dbibi44dhr.htm/, Retrieved Sun, 19 May 2024 13:06:11 +0000
Statistical Computations at FreeStatistics.org, Office for Research Development and Education, URL https://freestatistics.org/blog/index.php?pk=19823, Retrieved Sun, 19 May 2024 13:06:11 +0000
QR Codes:

Original text written by user:
IsPrivate?No (this computation is public)
User-defined keywords
Estimated Impact229
Family? (F = Feedback message, R = changed R code, M = changed R Module, P = changed Parameters, D = changed Data)
F     [Mean Plot] [q2] [2008-10-28 14:30:39] [c5a66f1c8528a963efc2b82a8519f117]
F   PD    [Mean Plot] [Q2 op 36 maanden] [2008-10-29 12:00:41] [b4fc5040f26b33db57f84cfb8d1d2b82] [Current]
Feedback Forum
2008-11-07 11:54:23 [Christy Masson] [reply
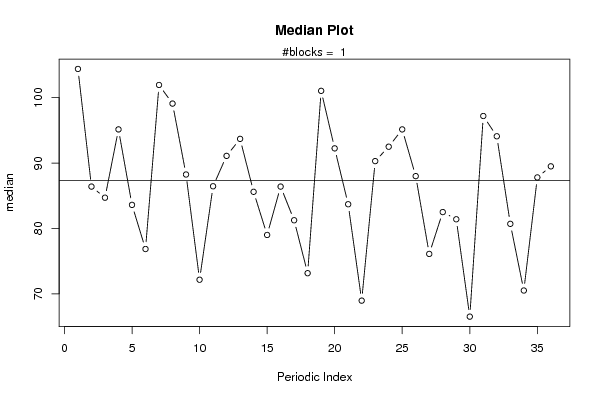
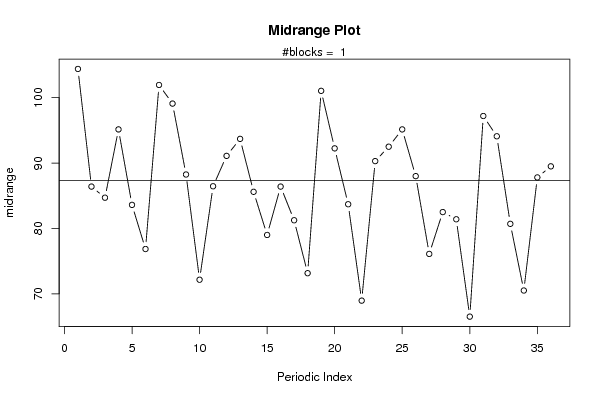
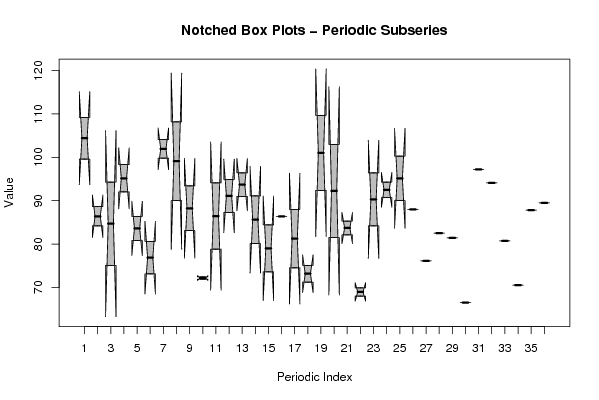
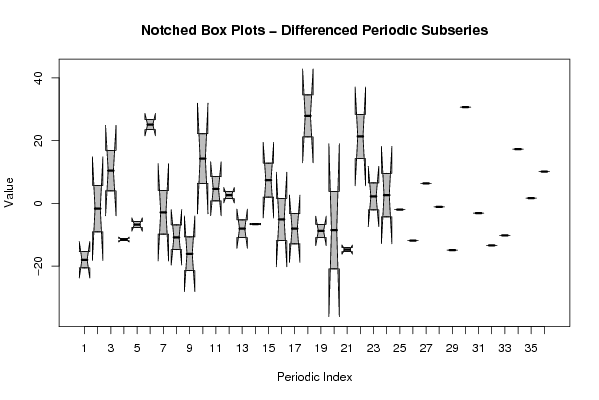
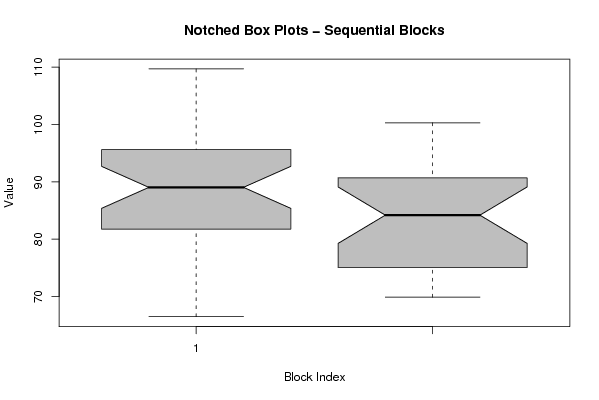
als we bij notched boxplot het aantal jaren nemen merken we dat er geen significant verschil is en dat het bijgevolg toevallig is dat jaar 2 lager ligt dan jaar 1
2008-11-10 10:01:36 [Kevin Neelen] [reply
De studente heeft hier het aantal lags ingesteld op 36. Dit is zeker geen goede beslissing aangezien hierop geen seizoenaliteiten afgelezen kunnen worden. Dit is in het laatste hoorcollege door Dhr. Van Stee gezegd geweest. Om seizoensinvloeden te kunnen aflezen, moet het anatal lags ingesteld worden op 12 (zoals in voorgaanse computation werd gedaan).
2008-11-10 11:11:16 [a7e076854c32462fd499d2de3f6d4e86] [reply
Zie Q2: Het aantal lags moet ingesteld worden op 12 om de seizoensinvloeden te kunnen aflezen. (hier: lags: 36 --> geen seizoensinvloeden af te lezen)

2008-11-11 10:14:17 [Sanne Kerckhofs] [reply
De student heeft de blockwidth hier aangepast van 12 naar 36. Hierdoor kunnen we geen seizoenaliteit aflezen. Het is namelijk heel belangrijk dat de blockwidth op 12 blijft staan omdat dit het aantal maanden voorstelt.
Het juiste antwoord op Q2 wordt voorgesteld aan de hand van volgende berekening http://www.freestatistics.org/blog/date/2008/Oct/28/t1225204277ees9h42lqsk0q9f.htm/
2008-11-11 11:31:01 [Sanne Kerckhofs] [reply
De blockwidth moet ingesteld worden op 12 ipv 36 omdat men alleen bij blockwidth 12 de seizoenaliteit kan aflezen. De aanpassing naar 36 is dus fout. De correcte berekening voor Q3 is: http://www.freestatistics.org/blog/index.php?v=date/2008/Oct/28/t1225204277ees9h42lqsk0q9f.htm/
Bij de sequential blocks kunnen we dan aflezen dat er jaar na jaar een daling is. De notches komen nog deels overeen dus schrijven we deze daling toe aan toevalligheid. Wanneer we jaar 5 vergelijken met jaar 1 krijgen we een twijfelgeval. We zouden hier kunnen beweren dat het een significant verschil is omdat de notches onder elkaar liggen en de betrouwbaarheidintervallen dus niet meer met elkaar overeenstemmen.

Post a new message
Dataseries X:
109.20
88.60
94.30
98.30
86.40
80.60
104.10
108.20
93.40
71.90
94.10
94.90
96.40
91.10
84.40
86.40
88.00
75.10
109.70
103.00
82.10
68.00
96.40
94.30
90.00
88.00
76.10
82.50
81.40
66.50
97.20
94.10
80.70
70.50
87.80
89.50
99.60
84.20
75.10
92.00
80.80
73.10
99.80
90.00
83.10
72.40
78.80
87.30
91.00
80.10
73.60
86.40
74.50
71.20
92.40
81.50
85.30
69.90
84.20
90.70
100.30


Summary of computational transaction
Raw Inputview raw input (R code)
Raw Outputview raw output of R engine
Computing time3 seconds
R Server'Gwilym Jenkins' @ 72.249.127.135

\begin{tabular}{lllllllll}
\hline
Summary of computational transaction \tabularnewline
Raw Input & view raw input (R code)  \tabularnewline
Raw Output & view raw output of R engine  \tabularnewline
Computing time & 3 seconds \tabularnewline
R Server & 'Gwilym Jenkins' @ 72.249.127.135 \tabularnewline
\hline
\end{tabular}
%Source: https://freestatistics.org/blog/index.php?pk=19823&T=0

[TABLE]
[ROW][C]Summary of computational transaction[/C][/ROW]
[ROW][C]Raw Input[/C][C]view raw input (R code) [/C][/ROW]
[ROW][C]Raw Output[/C][C]view raw output of R engine [/C][/ROW]
[ROW][C]Computing time[/C][C]3 seconds[/C][/ROW]
[ROW][C]R Server[/C][C]'Gwilym Jenkins' @ 72.249.127.135[/C][/ROW]
[/TABLE]
Source: https://freestatistics.org/blog/index.php?pk=19823&T=0

Globally Unique Identifier (entire table): ba.freestatistics.org/blog/index.php?pk=19823&T=0

As an alternative you can also use a QR Code:  

The GUIDs for individual cells are displayed in the table below:

Summary of computational transaction
Raw Inputview raw input (R code)
Raw Outputview raw output of R engine
Computing time3 seconds
R Server'Gwilym Jenkins' @ 72.249.127.135


Parameters (Session):
par1 = 36 ;
Parameters (R input):
par1 = 36 ;
R code (references can be found in the software module):
par1 <- as.numeric(par1)
(n <- length(x))
(np <- floor(n / par1))
arr <- array(NA,dim=c(par1,np+1))
darr <- array(NA,dim=c(par1,np+1))
ari <- array(0,dim=par1)
dx <- diff(x)
j <- 0
for (i in 1:n)
{
j = j + 1
ari[j] = ari[j] + 1
arr[j,ari[j]] <- x[i]
darr[j,ari[j]] <- dx[i]
if (j == par1) j = 0
}
ari
arr
darr
arr.mean <- array(NA,dim=par1)
arr.median <- array(NA,dim=par1)
arr.midrange <- array(NA,dim=par1)
for (j in 1:par1)
{
arr.mean[j] <- mean(arr[j,],na.rm=TRUE)
arr.median[j] <- median(arr[j,],na.rm=TRUE)
arr.midrange[j] <- (quantile(arr[j,],0.75,na.rm=TRUE) + quantile(arr[j,],0.25,na.rm=TRUE)) / 2
}
overall.mean <- mean(x)
overall.median <- median(x)
overall.midrange <- (quantile(x,0.75) + quantile(x,0.25)) / 2
bitmap(file='plot1.png')
plot(arr.mean,type='b',ylab='mean',main='Mean Plot',xlab='Periodic Index')
mtext(paste('#blocks = ',np))
abline(overall.mean,0)
dev.off()
bitmap(file='plot2.png')
plot(arr.median,type='b',ylab='median',main='Median Plot',xlab='Periodic Index')
mtext(paste('#blocks = ',np))
abline(overall.median,0)
dev.off()
bitmap(file='plot3.png')
plot(arr.midrange,type='b',ylab='midrange',main='Midrange Plot',xlab='Periodic Index')
mtext(paste('#blocks = ',np))
abline(overall.midrange,0)
dev.off()
bitmap(file='plot4.png')
z <- data.frame(t(arr))
names(z) <- c(1:par1)
(boxplot(z,notch=TRUE,col='grey',xlab='Periodic Index',ylab='Value',main='Notched Box Plots - Periodic Subseries'))
dev.off()
bitmap(file='plot4b.png')
z <- data.frame(t(darr))
names(z) <- c(1:par1)
(boxplot(z,notch=TRUE,col='grey',xlab='Periodic Index',ylab='Value',main='Notched Box Plots - Differenced Periodic Subseries'))
dev.off()
bitmap(file='plot5.png')
z <- data.frame(arr)
names(z) <- c(1:np)
(boxplot(z,notch=TRUE,col='grey',xlab='Block Index',ylab='Value',main='Notched Box Plots - Sequential Blocks'))
dev.off()
bitmap(file='plot6.png')
z <- data.frame(cbind(arr.mean,arr.median,arr.midrange))
names(z) <- list('mean','median','midrange')
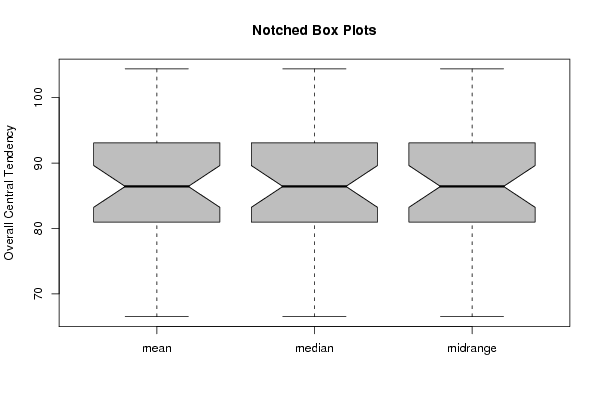
(boxplot(z,notch=TRUE,col='grey',ylab='Overall Central Tendency',main='Notched Box Plots'))
dev.off()