Free Statistics

of Irreproducible Research!

Author's title

Author*The author of this computation has been verified*
R Software Modulerwasp_edauni.wasp
Title produced by softwareUnivariate Explorative Data Analysis
Date of computationMon, 27 Oct 2008 17:45:08 -0600
Cite this page as followsStatistical Computations at FreeStatistics.org, Office for Research Development and Education, URL https://freestatistics.org/blog/index.php?v=date/2008/Oct/28/t1225151165p6sv4hcpcs95moo.htm/, Retrieved Sun, 19 May 2024 20:26:51 +0000
Statistical Computations at FreeStatistics.org, Office for Research Development and Education, URL https://freestatistics.org/blog/index.php?pk=19712, Retrieved Sun, 19 May 2024 20:26:51 +0000
QR Codes:

Original text written by user:
IsPrivate?No (this computation is public)
User-defined keywords
Estimated Impact195
Family? (F = Feedback message, R = changed R code, M = changed R Module, P = changed Parameters, D = changed Data)
F     [Univariate Explorative Data Analysis] [Q7 Distribution] [2008-10-25 18:46:02] [547636b63517c1c2916a747d66b36ebf]
F    D    [Univariate Explorative Data Analysis] [Q7] [2008-10-27 23:45:08] [9d7d6e0b01d5647e3f5dd21d8ef8600e] [Current]
-           [Univariate Explorative Data Analysis] [Q7] [2008-10-28 06:52:03] [b641c14ac36cb6fee377f3b099dcac19]
-   P       [Univariate Explorative Data Analysis] [verbetering task ...] [2008-11-03 21:02:37] [e340b5273efb4d885d02142e6a0fc74b]
Feedback Forum
2008-11-03 09:28:26 [Davy De Nef] [reply
Voor dit model geldt dezelfde standaard uitleg als voor Q2 gegeven werd.
Het komt erop neer dat er 4 assumpties getest moeten worden. De student test er slechts 3.
Om de randomness van de reeks te kennen had de student in principe gebruik moeten maken van de lagplot.
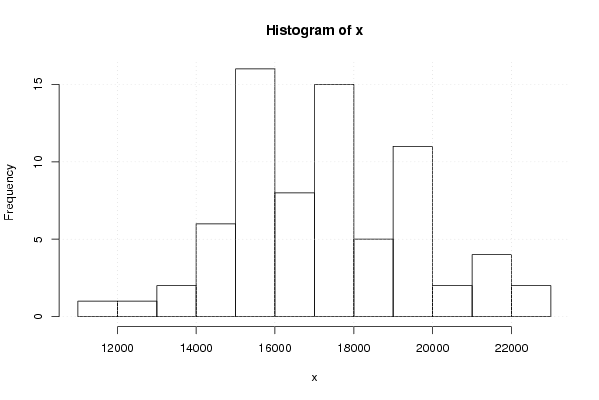
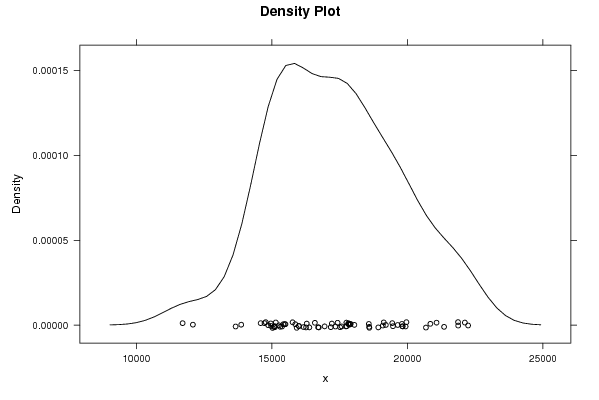
om de fixed distribution te testen wordt er gebruik gemaakt van de density plot en het histogram. Je ziet duidelijk dat er geneigd wordt naar een normaalverdeling, maar dat er enkele dipjes in het histogram te zien zijn. Bijkomend kan je daarom kijken naar de normal QQ plot. Van -2 tot -1 wijken de punten significant af van de rechte. De rest van de punten volgen duidelijk het verloop van de rechte wel.
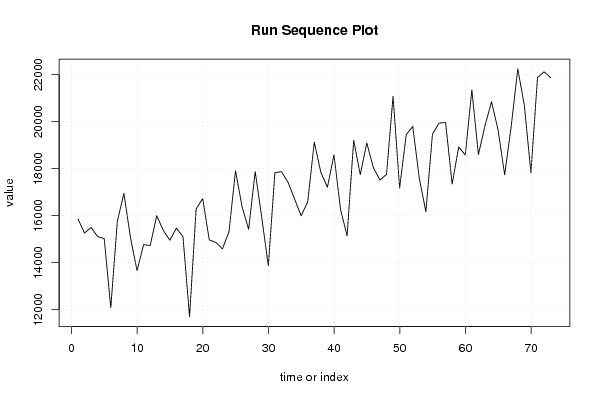
Om fixed location na te gaan, bekijken we de run sequence plot. Je ziet duidelijk een stijgende rechte. Dit wijst erop dat er geen constante factor is.
Een laatste assumptie die de student vergeet te beoordelen is de fixed variation. Daarvoor kijk je naar de Run sequence plot. De spreiding over de gehele grafiek verloopt vrijwel gelijk.

Aan de 4 assumpties moet voldaan zijn, om te spreken van een geldig model.

De uitleg van Q2 vind je hier: http://www.freestatistics.org/blog/date/2008/Oct/25/t1224938220kizlckmiw8dd232.htm
2008-11-03 09:34:05 [Davy De Nef] [reply
Om seizonaliteit na te gaan, ga je op zoek naar een terugkerend patroon in de grafiek. Dit kan beste bekeken worden op een langere termijn, omdat dat meestal een duidelijker beeld geeft. In de run sequence plot zie je hier duidelijk eenzelfde patroon dat om de x aantal maanden terugkeert.
2008-11-03 21:09:22 [Niels Herremans] [reply
Voor assumption 1 heb ik de lags ingesteld op 36 met het volgend resultaat:

http://www.freestatistics.org/blog/index.php?v=date/2008/Nov/03/t12257462550a1x97rd32rnbne.htm

Uit de grafiek van de lagplots blijkt dat er de punten vrij dicht bij de rechte liggen.

Post a new message
Dataseries X:
15859.4
15258.9
15498.6
15106.5
15023.6
12083
15761.3
16942.6
15070.3
13659.6
14768.9
14725.1
15998.1
15370.6
14956.9
15469.7
15101.8
11703.7
16283.6
16726.5
14968.9
14861
14583.3
15305.8
17903.9
16379.4
15420.3
17870.5
15912.8
13866.5
17823.2
17872
17422
16704.5
15991.2
16583.6
19123.5
17838.7
17209.4
18586.5
16258.1
15141.6
19202.1
17746.5
19090.1
18040.3
17515.5
17751.8
21072.4
17170
19439.5
19795.4
17574.9
16165.4
19464.6
19932.1
19961.2
17343.4
18924.2
18574.1
21350.6
18594.6
19823.1
20844.4
19640.2
17735.4
19813.6
22238.5
20682.2
17818.6
21872.1
22117
21865.9


Summary of computational transaction
Raw Inputview raw input (R code)
Raw Outputview raw output of R engine
Computing time3 seconds
R Server'Herman Ole Andreas Wold' @ 193.190.124.10:1001

\begin{tabular}{lllllllll}
\hline
Summary of computational transaction \tabularnewline
Raw Input & view raw input (R code)  \tabularnewline
Raw Output & view raw output of R engine  \tabularnewline
Computing time & 3 seconds \tabularnewline
R Server & 'Herman Ole Andreas Wold' @ 193.190.124.10:1001 \tabularnewline
\hline
\end{tabular}
%Source: https://freestatistics.org/blog/index.php?pk=19712&T=0

[TABLE]
[ROW][C]Summary of computational transaction[/C][/ROW]
[ROW][C]Raw Input[/C][C]view raw input (R code) [/C][/ROW]
[ROW][C]Raw Output[/C][C]view raw output of R engine [/C][/ROW]
[ROW][C]Computing time[/C][C]3 seconds[/C][/ROW]
[ROW][C]R Server[/C][C]'Herman Ole Andreas Wold' @ 193.190.124.10:1001[/C][/ROW]
[/TABLE]
Source: https://freestatistics.org/blog/index.php?pk=19712&T=0

Globally Unique Identifier (entire table): ba.freestatistics.org/blog/index.php?pk=19712&T=0

As an alternative you can also use a QR Code:  

The GUIDs for individual cells are displayed in the table below:

Summary of computational transaction
Raw Inputview raw input (R code)
Raw Outputview raw output of R engine
Computing time3 seconds
R Server'Herman Ole Andreas Wold' @ 193.190.124.10:1001


Descriptive Statistics
# observations73
minimum11703.7
Q115420.3
median17343.4
mean17317.1931506849
Q319090.1
maximum22238.5

\begin{tabular}{lllllllll}
\hline
Descriptive Statistics \tabularnewline
# observations & 73 \tabularnewline
minimum & 11703.7 \tabularnewline
Q1 & 15420.3 \tabularnewline
median & 17343.4 \tabularnewline
mean & 17317.1931506849 \tabularnewline
Q3 & 19090.1 \tabularnewline
maximum & 22238.5 \tabularnewline
\hline
\end{tabular}
%Source: https://freestatistics.org/blog/index.php?pk=19712&T=1

[TABLE]
[ROW][C]Descriptive Statistics[/C][/ROW]
[ROW][C]# observations[/C][C]73[/C][/ROW]
[ROW][C]minimum[/C][C]11703.7[/C][/ROW]
[ROW][C]Q1[/C][C]15420.3[/C][/ROW]
[ROW][C]median[/C][C]17343.4[/C][/ROW]
[ROW][C]mean[/C][C]17317.1931506849[/C][/ROW]
[ROW][C]Q3[/C][C]19090.1[/C][/ROW]
[ROW][C]maximum[/C][C]22238.5[/C][/ROW]
[/TABLE]
Source: https://freestatistics.org/blog/index.php?pk=19712&T=1

Globally Unique Identifier (entire table): ba.freestatistics.org/blog/index.php?pk=19712&T=1

As an alternative you can also use a QR Code:  

The GUIDs for individual cells are displayed in the table below:

Descriptive Statistics
# observations73
minimum11703.7
Q115420.3
median17343.4
mean17317.1931506849
Q319090.1
maximum22238.5


Parameters (Session):
par1 = 0 ; par2 = 0 ;
Parameters (R input):
par1 = 0 ; par2 = 0 ;
R code (references can be found in the software module):
par1 <- as.numeric(par1)
par2 <- as.numeric(par2)
x <- as.ts(x)
library(lattice)
bitmap(file='pic1.png')
plot(x,type='l',main='Run Sequence Plot',xlab='time or index',ylab='value')
grid()
dev.off()
bitmap(file='pic2.png')
hist(x)
grid()
dev.off()
bitmap(file='pic3.png')
if (par1 > 0)
{
densityplot(~x,col='black',main=paste('Density Plot bw = ',par1),bw=par1)
} else {
densityplot(~x,col='black',main='Density Plot')
}
dev.off()
bitmap(file='pic4.png')
qqnorm(x)
qqline(x)
grid()
dev.off()
if (par2 > 0)
{
bitmap(file='lagplot1.png')
dum <- cbind(lag(x,k=1),x)
dum
dum1 <- dum[2:length(x),]
dum1
z <- as.data.frame(dum1)
z
plot(z,main='Lag plot (k=1), lowess, and regression line')
lines(lowess(z))
abline(lm(z))
dev.off()
if (par2 > 1) {
bitmap(file='lagplotpar2.png')
dum <- cbind(lag(x,k=par2),x)
dum
dum1 <- dum[(par2+1):length(x),]
dum1
z <- as.data.frame(dum1)
z
mylagtitle <- 'Lag plot (k='
mylagtitle <- paste(mylagtitle,par2,sep='')
mylagtitle <- paste(mylagtitle,'), and lowess',sep='')
plot(z,main=mylagtitle)
lines(lowess(z))
dev.off()
}
bitmap(file='pic5.png')
acf(x,lag.max=par2,main='Autocorrelation Function')
grid()
dev.off()
}
summary(x)
load(file='createtable')
a<-table.start()
a<-table.row.start(a)
a<-table.element(a,'Descriptive Statistics',2,TRUE)
a<-table.row.end(a)
a<-table.row.start(a)
a<-table.element(a,'# observations',header=TRUE)
a<-table.element(a,length(x))
a<-table.row.end(a)
a<-table.row.start(a)
a<-table.element(a,'minimum',header=TRUE)
a<-table.element(a,min(x))
a<-table.row.end(a)
a<-table.row.start(a)
a<-table.element(a,'Q1',header=TRUE)
a<-table.element(a,quantile(x,0.25))
a<-table.row.end(a)
a<-table.row.start(a)
a<-table.element(a,'median',header=TRUE)
a<-table.element(a,median(x))
a<-table.row.end(a)
a<-table.row.start(a)
a<-table.element(a,'mean',header=TRUE)
a<-table.element(a,mean(x))
a<-table.row.end(a)
a<-table.row.start(a)
a<-table.element(a,'Q3',header=TRUE)
a<-table.element(a,quantile(x,0.75))
a<-table.row.end(a)
a<-table.row.start(a)
a<-table.element(a,'maximum',header=TRUE)
a<-table.element(a,max(x))
a<-table.row.end(a)
a<-table.end(a)
table.save(a,file='mytable.tab')