Free Statistics

of Irreproducible Research!

Author's title

Author*Unverified author*
R Software Modulerwasp_edauni.wasp
Title produced by softwareUnivariate Explorative Data Analysis
Date of computationMon, 27 Oct 2008 16:55:53 -0600
Cite this page as followsStatistical Computations at FreeStatistics.org, Office for Research Development and Education, URL https://freestatistics.org/blog/index.php?v=date/2008/Oct/27/t122514822187ebaj3c9w9su5o.htm/, Retrieved Sun, 19 May 2024 15:58:12 +0000
Statistical Computations at FreeStatistics.org, Office for Research Development and Education, URL https://freestatistics.org/blog/index.php?pk=19705, Retrieved Sun, 19 May 2024 15:58:12 +0000
QR Codes:

Original text written by user:
IsPrivate?No (this computation is public)
User-defined keywords
Estimated Impact140
Family? (F = Feedback message, R = changed R code, M = changed R Module, P = changed Parameters, D = changed Data)
F       [Univariate Explorative Data Analysis] [] [2008-10-27 22:55:53] [e0f4dc76ea1a8276fe566258b977cec4] [Current]
-   PD    [Univariate Explorative Data Analysis] [Q7 Univariate exp...] [2008-10-31 14:15:42] [d134696a922d84037f02d49ded84b0bd]
Feedback Forum
2008-10-31 14:47:28 [Stijn Van de Velde] [reply
Om te beginnen is deze berekening niet volledig juist. Om de opdracht juist te kunnen maken had je bij lags best een lag van 36 genomen.
link: http://www.freestatistics.org/blog/date/2008/Oct/31/t1225462608u6drmton2qvqs42.htm

Vervolgens moeten we de 4 voorwaarden onderzoeken:

1. random drawings;
2. from a fixed distribution;
3. with the distribution having fixed location; and
4. with the distribution having fixed variation.

1)Kijken naar de autocorrelatie grafiek.
Hier zijn duidelijk enkel pieken, die helemaal niets met seizoensgebondenheid te maken hebben. De autocorrelatie ligt in het begin dus zeker niet dicht bij 0, wat er op duid dat er geen randomness is.
De lagplot grafieke vormen ook geen punten wolk, dus ook hier geen randomness.

=> aan deze voorwaarde is niet voldaan. Het heeft dus in princiepe geen zin om de andere 4 nog te onderzoeken.

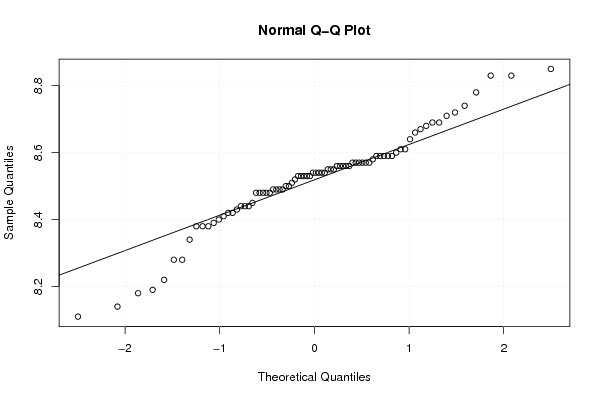
2)Het Q-Q plot ligt zeker niet op 1 rechte.

=>er is dus zeker geen fixed distribution.

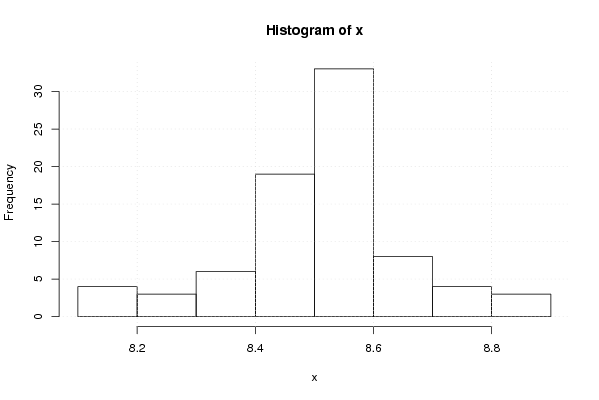
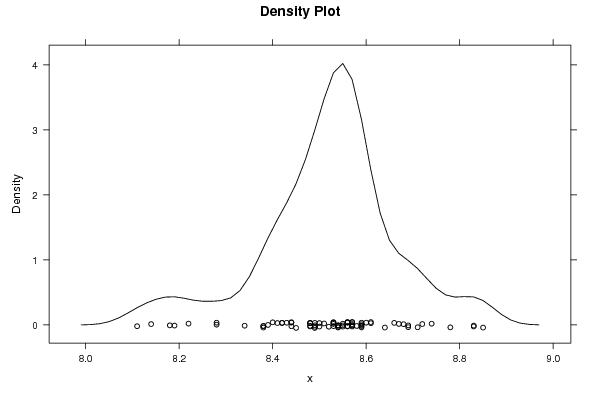
dit word bevestigd door het histogram en het dencity-plot.

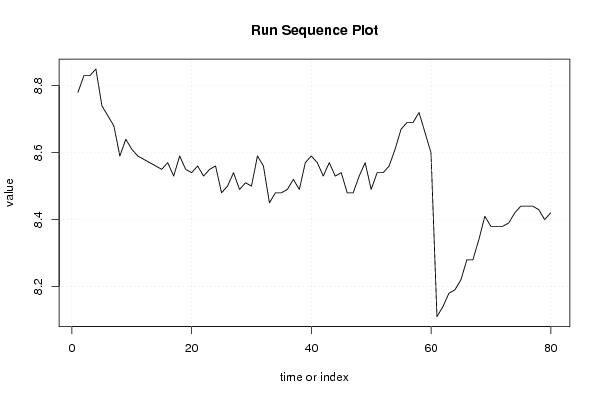
3) De run sequence plot kent een duidelijk dalend verloop.

=> ook aan deze voorwaarde is niet voldaan.

4) Ook de groote van de fluctuatie op de y as is niet gelijk.

=> voorwaarde niet voldaan.

conclusie:

Er is hier zeker geen sprake van Tijdreeks = Constante + random component.
  2008-10-31 14:52:38 [Stijn Van de Velde] [reply
Om het antwoord op Q10 nogmaals te benadrukken: Er is hier inderdaad geen sprake van seizoensgebondenheid. (zie voorwaarde 1)
2008-11-01 11:35:25 [2df1bcd103d52957f4a39bd4617794c8] [reply
Unverified author, niet opgeslagen onder eigen inlog...

We bekijken wederom de 4 assumpties uit Q2.

Assumptie1: Aan deze voorwaarde wordt niet voldaan. We noteren dit wanneer we de lagplot bekijken en de punten plaatsen tov de rechte in de grafiek.

Assumptie2: Het histogram geeft weer dat er geen vaste verdeling is.

Assumptie3: Run sequence op LT kent een dalend verloop, er is dus geen constante locatie van de gegevens.

Assumptie4: De spreiding is niet gelijk door de tijd heen.

Het is dus duidelijk dat het model niet aan de voorwaarden voldoet.
2008-11-03 09:38:31 [Bas van Keken] [reply
M.a.w. het is geen brave tijdsreeks.
2008-11-03 09:39:59 [256f97d8b7c07ed49f142eff724c6520] [reply
Deze voldoet inderdaad niet aan de 4 voorwaarden

Post a new message
Dataseries X:
8,7800
8,8300
8,8300
8,8500
8,7400
8,7100
8,6800
8,5900
8,6400
8,6100
8,5900
8,5800
8,5700
8,5600
8,5500
8,5700
8,5300
8,5900
8,5500
8,5400
8,5600
8,5300
8,5500
8,5600
8,4800
8,5000
8,5400
8,4900
8,5100
8,5000
8,5900
8,5600
8,4500
8,4800
8,4800
8,4900
8,5200
8,4900
8,5700
8,5900
8,5700
8,5300
8,5700
8,5300
8,5400
8,4800
8,4800
8,5300
8,5700
8,4900
8,5400
8,5400
8,5600
8,6100
8,6700
8,6900
8,6900
8,7200
8,6600
8,6000
8,1100
8,1400
8,1800
8,1900
8,2200
8,2800
8,2800
8,3400
8,4100
8,3800
8,3800
8,3800
8,3900
8,4200
8,4400
8,4400
8,4400
8,4300
8,4000
8,4200


Summary of computational transaction
Raw Inputview raw input (R code)
Raw Outputview raw output of R engine
Computing time2 seconds
R Server'George Udny Yule' @ 72.249.76.132

\begin{tabular}{lllllllll}
\hline
Summary of computational transaction \tabularnewline
Raw Input & view raw input (R code)  \tabularnewline
Raw Output & view raw output of R engine  \tabularnewline
Computing time & 2 seconds \tabularnewline
R Server & 'George Udny Yule' @ 72.249.76.132 \tabularnewline
\hline
\end{tabular}
%Source: https://freestatistics.org/blog/index.php?pk=19705&T=0

[TABLE]
[ROW][C]Summary of computational transaction[/C][/ROW]
[ROW][C]Raw Input[/C][C]view raw input (R code) [/C][/ROW]
[ROW][C]Raw Output[/C][C]view raw output of R engine [/C][/ROW]
[ROW][C]Computing time[/C][C]2 seconds[/C][/ROW]
[ROW][C]R Server[/C][C]'George Udny Yule' @ 72.249.76.132[/C][/ROW]
[/TABLE]
Source: https://freestatistics.org/blog/index.php?pk=19705&T=0

Globally Unique Identifier (entire table): ba.freestatistics.org/blog/index.php?pk=19705&T=0

As an alternative you can also use a QR Code:  

The GUIDs for individual cells are displayed in the table below:

Summary of computational transaction
Raw Inputview raw input (R code)
Raw Outputview raw output of R engine
Computing time2 seconds
R Server'George Udny Yule' @ 72.249.76.132


Descriptive Statistics
# observations80
minimum8.11
Q18.4475
median8.54
mean8.519625
Q38.59
maximum8.85

\begin{tabular}{lllllllll}
\hline
Descriptive Statistics \tabularnewline
# observations & 80 \tabularnewline
minimum & 8.11 \tabularnewline
Q1 & 8.4475 \tabularnewline
median & 8.54 \tabularnewline
mean & 8.519625 \tabularnewline
Q3 & 8.59 \tabularnewline
maximum & 8.85 \tabularnewline
\hline
\end{tabular}
%Source: https://freestatistics.org/blog/index.php?pk=19705&T=1

[TABLE]
[ROW][C]Descriptive Statistics[/C][/ROW]
[ROW][C]# observations[/C][C]80[/C][/ROW]
[ROW][C]minimum[/C][C]8.11[/C][/ROW]
[ROW][C]Q1[/C][C]8.4475[/C][/ROW]
[ROW][C]median[/C][C]8.54[/C][/ROW]
[ROW][C]mean[/C][C]8.519625[/C][/ROW]
[ROW][C]Q3[/C][C]8.59[/C][/ROW]
[ROW][C]maximum[/C][C]8.85[/C][/ROW]
[/TABLE]
Source: https://freestatistics.org/blog/index.php?pk=19705&T=1

Globally Unique Identifier (entire table): ba.freestatistics.org/blog/index.php?pk=19705&T=1

As an alternative you can also use a QR Code:  

The GUIDs for individual cells are displayed in the table below:

Descriptive Statistics
# observations80
minimum8.11
Q18.4475
median8.54
mean8.519625
Q38.59
maximum8.85


Parameters (Session):
par1 = 0 ; par2 = 0 ;
Parameters (R input):
par1 = 0 ; par2 = 0 ;
R code (references can be found in the software module):
par1 <- as.numeric(par1)
par2 <- as.numeric(par2)
x <- as.ts(x)
library(lattice)
bitmap(file='pic1.png')
plot(x,type='l',main='Run Sequence Plot',xlab='time or index',ylab='value')
grid()
dev.off()
bitmap(file='pic2.png')
hist(x)
grid()
dev.off()
bitmap(file='pic3.png')
if (par1 > 0)
{
densityplot(~x,col='black',main=paste('Density Plot bw = ',par1),bw=par1)
} else {
densityplot(~x,col='black',main='Density Plot')
}
dev.off()
bitmap(file='pic4.png')
qqnorm(x)
qqline(x)
grid()
dev.off()
if (par2 > 0)
{
bitmap(file='lagplot1.png')
dum <- cbind(lag(x,k=1),x)
dum
dum1 <- dum[2:length(x),]
dum1
z <- as.data.frame(dum1)
z
plot(z,main='Lag plot (k=1), lowess, and regression line')
lines(lowess(z))
abline(lm(z))
dev.off()
if (par2 > 1) {
bitmap(file='lagplotpar2.png')
dum <- cbind(lag(x,k=par2),x)
dum
dum1 <- dum[(par2+1):length(x),]
dum1
z <- as.data.frame(dum1)
z
mylagtitle <- 'Lag plot (k='
mylagtitle <- paste(mylagtitle,par2,sep='')
mylagtitle <- paste(mylagtitle,'), and lowess',sep='')
plot(z,main=mylagtitle)
lines(lowess(z))
dev.off()
}
bitmap(file='pic5.png')
acf(x,lag.max=par2,main='Autocorrelation Function')
grid()
dev.off()
}
summary(x)
load(file='createtable')
a<-table.start()
a<-table.row.start(a)
a<-table.element(a,'Descriptive Statistics',2,TRUE)
a<-table.row.end(a)
a<-table.row.start(a)
a<-table.element(a,'# observations',header=TRUE)
a<-table.element(a,length(x))
a<-table.row.end(a)
a<-table.row.start(a)
a<-table.element(a,'minimum',header=TRUE)
a<-table.element(a,min(x))
a<-table.row.end(a)
a<-table.row.start(a)
a<-table.element(a,'Q1',header=TRUE)
a<-table.element(a,quantile(x,0.25))
a<-table.row.end(a)
a<-table.row.start(a)
a<-table.element(a,'median',header=TRUE)
a<-table.element(a,median(x))
a<-table.row.end(a)
a<-table.row.start(a)
a<-table.element(a,'mean',header=TRUE)
a<-table.element(a,mean(x))
a<-table.row.end(a)
a<-table.row.start(a)
a<-table.element(a,'Q3',header=TRUE)
a<-table.element(a,quantile(x,0.75))
a<-table.row.end(a)
a<-table.row.start(a)
a<-table.element(a,'maximum',header=TRUE)
a<-table.element(a,max(x))
a<-table.row.end(a)
a<-table.end(a)
table.save(a,file='mytable.tab')