Free Statistics

of Irreproducible Research!

Author's title

Author*The author of this computation has been verified*
R Software Modulerwasp_tukeylambda.wasp
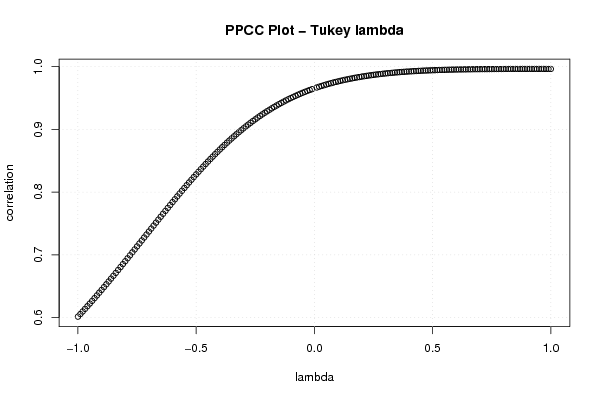
Title produced by softwareTukey lambda PPCC Plot
Date of computationMon, 27 Oct 2008 16:14:03 -0600
Cite this page as followsStatistical Computations at FreeStatistics.org, Office for Research Development and Education, URL https://freestatistics.org/blog/index.php?v=date/2008/Oct/27/t1225145724xjma4gqjnxhcdvx.htm/, Retrieved Sun, 19 May 2024 12:56:28 +0000
Statistical Computations at FreeStatistics.org, Office for Research Development and Education, URL https://freestatistics.org/blog/index.php?pk=19686, Retrieved Sun, 19 May 2024 12:56:28 +0000
QR Codes:

Original text written by user:
IsPrivate?No (this computation is public)
User-defined keywords
Estimated Impact120
Family? (F = Feedback message, R = changed R code, M = changed R Module, P = changed Parameters, D = changed Data)
F     [Tukey lambda PPCC Plot] [Investigating dis...] [2007-10-22 19:59:15] [b9964c45117f7aac638ab9056d451faa]
F    D    [Tukey lambda PPCC Plot] [Investigating Dis...] [2008-10-27 22:14:03] [d6e9f26c3644bfc30f06303d9993b878] [Current]
Feedback Forum
2008-11-03 11:10:24 [Bas van Keken] [reply
Juiste uitvoering. De conclusie bij de bevinding ontbreekt.

Post a new message
Dataseries X:
0.86416882
0.952771272
0.873774029
0.977698836
0.942848623
0.956009115
0.88862218
0.746376143
0.821444965
0.92281085
0.898454333
0.818851513
0.803862774
0.871951822
0.825015341
0.946725626
0.929766599
0.919691038
0.81603076
0.686070686
0.762785024
0.830948692
0.802758621
0.73586736
0.71869504
0.774280749
0.754786151
0.844646973
0.836475323
0.826694473
0.690353854
0.74990392
0.534362511
0.621555231
0.803202285
0.88125089
0.596597813
0.592231348
0.625927844
0.669170939
0.655901508
0.626412744
0.552414605
0.580131209
0.539712753
0.536193474
0.676242709
0.704310769
0.509862922
0.500610927
0.634321426
0.684709066
0.643433077
0.630375992
0.60073162
0.609028961
0.588522163
0.60092375
0.657072716
0.626589026
0.602255212


Summary of computational transaction
Raw Inputview raw input (R code)
Raw Outputview raw output of R engine
Computing time2 seconds
R Server'Sir Ronald Aylmer Fisher' @ 193.190.124.24

\begin{tabular}{lllllllll}
\hline
Summary of computational transaction \tabularnewline
Raw Input & view raw input (R code)  \tabularnewline
Raw Output & view raw output of R engine  \tabularnewline
Computing time & 2 seconds \tabularnewline
R Server & 'Sir Ronald Aylmer Fisher' @ 193.190.124.24 \tabularnewline
\hline
\end{tabular}
%Source: https://freestatistics.org/blog/index.php?pk=19686&T=0

[TABLE]
[ROW][C]Summary of computational transaction[/C][/ROW]
[ROW][C]Raw Input[/C][C]view raw input (R code) [/C][/ROW]
[ROW][C]Raw Output[/C][C]view raw output of R engine [/C][/ROW]
[ROW][C]Computing time[/C][C]2 seconds[/C][/ROW]
[ROW][C]R Server[/C][C]'Sir Ronald Aylmer Fisher' @ 193.190.124.24[/C][/ROW]
[/TABLE]
Source: https://freestatistics.org/blog/index.php?pk=19686&T=0

Globally Unique Identifier (entire table): ba.freestatistics.org/blog/index.php?pk=19686&T=0

As an alternative you can also use a QR Code:  

The GUIDs for individual cells are displayed in the table below:

Summary of computational transaction
Raw Inputview raw input (R code)
Raw Outputview raw output of R engine
Computing time2 seconds
R Server'Sir Ronald Aylmer Fisher' @ 193.190.124.24


Tukey Lambda - Key Values
Distribution (lambda)Correlation
Approx. Cauchy (lambda=-1)0.601603060759509
Exact Logistic (lambda=0)0.96527451264607
Approx. Normal (lambda=0.14)0.979728515980148
U-shaped (lambda=0.5)0.994102189936397
Exactly Uniform (lambda=1)0.99613610049383

\begin{tabular}{lllllllll}
\hline
Tukey Lambda - Key Values \tabularnewline
Distribution (lambda) & Correlation \tabularnewline
Approx. Cauchy (lambda=-1) & 0.601603060759509 \tabularnewline
Exact Logistic (lambda=0) & 0.96527451264607 \tabularnewline
Approx. Normal (lambda=0.14) & 0.979728515980148 \tabularnewline
U-shaped (lambda=0.5) & 0.994102189936397 \tabularnewline
Exactly Uniform (lambda=1) & 0.99613610049383 \tabularnewline
\hline
\end{tabular}
%Source: https://freestatistics.org/blog/index.php?pk=19686&T=1

[TABLE]
[ROW][C]Tukey Lambda - Key Values[/C][/ROW]
[ROW][C]Distribution (lambda)[/C][C]Correlation[/C][/ROW]
[ROW][C]Approx. Cauchy (lambda=-1)[/C][C]0.601603060759509[/C][/ROW]
[ROW][C]Exact Logistic (lambda=0)[/C][C]0.96527451264607[/C][/ROW]
[ROW][C]Approx. Normal (lambda=0.14)[/C][C]0.979728515980148[/C][/ROW]
[ROW][C]U-shaped (lambda=0.5)[/C][C]0.994102189936397[/C][/ROW]
[ROW][C]Exactly Uniform (lambda=1)[/C][C]0.99613610049383[/C][/ROW]
[/TABLE]
Source: https://freestatistics.org/blog/index.php?pk=19686&T=1

Globally Unique Identifier (entire table): ba.freestatistics.org/blog/index.php?pk=19686&T=1

As an alternative you can also use a QR Code:  

The GUIDs for individual cells are displayed in the table below:

Tukey Lambda - Key Values
Distribution (lambda)Correlation
Approx. Cauchy (lambda=-1)0.601603060759509
Exact Logistic (lambda=0)0.96527451264607
Approx. Normal (lambda=0.14)0.979728515980148
U-shaped (lambda=0.5)0.994102189936397
Exactly Uniform (lambda=1)0.99613610049383


Parameters (Session):
Parameters (R input):
R code (references can be found in the software module):
gp <- function(lambda, p)
{
(p^lambda-(1-p)^lambda)/lambda
}
sortx <- sort(x)
c <- array(NA,dim=c(201))
for (i in 1:201)
{
if (i != 101) c[i] <- cor(gp(ppoints(x), lambda=(i-101)/100),sortx)
}
bitmap(file='test1.png')
plot((-100:100)/100,c[1:201],xlab='lambda',ylab='correlation',main='PPCC Plot - Tukey lambda')
grid()
dev.off()
load(file='createtable')
a<-table.start()
a<-table.row.start(a)
a<-table.element(a,'Tukey Lambda - Key Values',2,TRUE)
a<-table.row.end(a)
a<-table.row.start(a)
a<-table.element(a,'Distribution (lambda)',1,TRUE)
a<-table.element(a,'Correlation',1,TRUE)
a<-table.row.end(a)
a<-table.row.start(a)
a<-table.element(a,'Approx. Cauchy (lambda=-1)',header=TRUE)
a<-table.element(a,c[1])
a<-table.row.end(a)
a<-table.row.start(a)
a<-table.element(a,'Exact Logistic (lambda=0)',header=TRUE)
a<-table.element(a,(c[100]+c[102])/2)
a<-table.row.end(a)
a<-table.row.start(a)
a<-table.element(a,'Approx. Normal (lambda=0.14)',header=TRUE)
a<-table.element(a,c[115])
a<-table.row.end(a)
a<-table.row.start(a)
a<-table.element(a,'U-shaped (lambda=0.5)',header=TRUE)
a<-table.element(a,c[151])
a<-table.row.end(a)
a<-table.row.start(a)
a<-table.element(a,'Exactly Uniform (lambda=1)',header=TRUE)
a<-table.element(a,c[201])
a<-table.row.end(a)
a<-table.end(a)
table.save(a,file='mytable.tab')