Free Statistics

of Irreproducible Research!

Author's title

Author*The author of this computation has been verified*
R Software Modulerwasp_centraltendency.wasp
Title produced by softwareCentral Tendency
Date of computationMon, 27 Oct 2008 14:53:27 -0600
Cite this page as followsStatistical Computations at FreeStatistics.org, Office for Research Development and Education, URL https://freestatistics.org/blog/index.php?v=date/2008/Oct/27/t1225141276v58heknrse1wcgr.htm/, Retrieved Sun, 19 May 2024 14:12:54 +0000
Statistical Computations at FreeStatistics.org, Office for Research Development and Education, URL https://freestatistics.org/blog/index.php?pk=19619, Retrieved Sun, 19 May 2024 14:12:54 +0000
QR Codes:

Original text written by user:
IsPrivate?No (this computation is public)
User-defined keywords
Estimated Impact160
Family? (F = Feedback message, R = changed R code, M = changed R Module, P = changed Parameters, D = changed Data)
F     [Harrell-Davis Quantiles] [Investigating dis...] [2007-10-22 20:06:26] [b9964c45117f7aac638ab9056d451faa]
-   PD  [Harrell-Davis Quantiles] [Q9 werkloosheid m...] [2008-10-27 17:27:58] [7d3039e6253bb5fb3b26df1537d500b4]
- RMP     [Central Tendency] [Q9 Central Tenden...] [2008-10-27 17:31:11] [7d3039e6253bb5fb3b26df1537d500b4]
-             [Central Tendency] [Q9 Central Tenden...] [2008-10-27 20:53:27] [70ba55c7ff8e068610dc28fc16e6d1e2] [Current]
Feedback Forum

Post a new message
Dataseries X:
0.939759036
0.926829268
0.9375
0.962025316
0.986842105
0.960526316
0.926829268
0.903614458
0.904761905
0.94047619
0.94047619
0.941860465
0.921348315
0.909090909
0.903614458
0.906666667
0.902777778
0.88
0.863636364
0.860215054
0.860215054
0.885057471
0.914634146
0.915662651
0.905882353
0.918604651
0.906976744
0.914634146
0.925925926
0.8875
0.872093023
0.862068966
0.863636364
0.905882353
0.916666667
0.929411765
0.931034483
0.942528736
0.953488372
0.952941176
0.951807229
0.901234568
0.841463415
0.814814815
0.827160494
0.873417722
0.886075949
0.898734177
0.9
0.8875
0.873417722
0.875
0.883116883
0.888888889
0.893333333
0.917808219
0.914285714
0.9
0.885714286
0.902777778
0.931506849
0.957746479
0.955882353
0.954545455
0.951612903
0.951612903
0.941176471
0.927536232


Summary of computational transaction
Raw Inputview raw input (R code)
Raw Outputview raw output of R engine
Computing time5 seconds
R Server'Herman Ole Andreas Wold' @ 193.190.124.10:1001

\begin{tabular}{lllllllll}
\hline
Summary of computational transaction \tabularnewline
Raw Input & view raw input (R code)  \tabularnewline
Raw Output & view raw output of R engine  \tabularnewline
Computing time & 5 seconds \tabularnewline
R Server & 'Herman Ole Andreas Wold' @ 193.190.124.10:1001 \tabularnewline
\hline
\end{tabular}
%Source: https://freestatistics.org/blog/index.php?pk=19619&T=0

[TABLE]
[ROW][C]Summary of computational transaction[/C][/ROW]
[ROW][C]Raw Input[/C][C]view raw input (R code) [/C][/ROW]
[ROW][C]Raw Output[/C][C]view raw output of R engine [/C][/ROW]
[ROW][C]Computing time[/C][C]5 seconds[/C][/ROW]
[ROW][C]R Server[/C][C]'Herman Ole Andreas Wold' @ 193.190.124.10:1001[/C][/ROW]
[/TABLE]
Source: https://freestatistics.org/blog/index.php?pk=19619&T=0

Globally Unique Identifier (entire table): ba.freestatistics.org/blog/index.php?pk=19619&T=0

As an alternative you can also use a QR Code:  

The GUIDs for individual cells are displayed in the table below:

Summary of computational transaction
Raw Inputview raw input (R code)
Raw Outputview raw output of R engine
Computing time5 seconds
R Server'Herman Ole Andreas Wold' @ 193.190.124.10:1001


Central Tendency - Ungrouped Data
MeasureValueS.E.Value/S.E.
Arithmetic Mean0.909880381573530.00416835701280945218.282737965450
Geometric Mean0.909233807872195
Harmonic Mean0.908580114445338
Quadratic Mean0.910519877424359
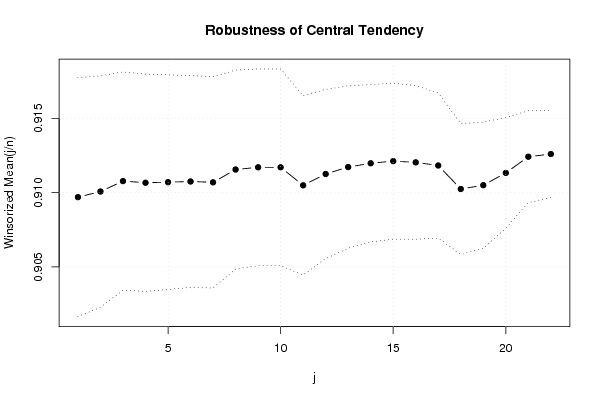
Winsorized Mean ( 1 / 22 )0.9096969828970590.0040236414507774226.087983739530
Winsorized Mean ( 2 / 22 )0.9100735688088240.0038952599278757233.636159244741
Winsorized Mean ( 3 / 22 )0.9107782071323530.00367739599018195247.669331658593
Winsorized Mean ( 4 / 22 )0.9106685526617650.00365682553114599249.032540629953
Winsorized Mean ( 5 / 22 )0.9107065683970590.00361110886395017252.195822033690
Winsorized Mean ( 6 / 22 )0.9107515961911770.00356678185226900255.342668521150
Winsorized Mean ( 7 / 22 )0.9106952671911770.00355675205420353256.046880218956
Winsorized Mean ( 8 / 22 )0.9115567627205880.00334685320034482272.362338039408
Winsorized Mean ( 9 / 22 )0.9117063709117650.00331167496470149275.300680359476
Winsorized Mean ( 10 / 22 )0.9117063709117650.00331167496470149275.300680359476
Winsorized Mean ( 11 / 22 )0.9104928300441180.00301785160084978301.702320216056
Winsorized Mean ( 12 / 22 )0.9112572528088240.00284923011568442319.825783039615
Winsorized Mean ( 13 / 22 )0.9117223639411770.00273285571514721333.615257800782
Winsorized Mean ( 14 / 22 )0.9119777212647060.00264814728349032344.383307888638
Winsorized Mean ( 15 / 22 )0.912122606926470.00262628301273824347.305527432653
Winsorized Mean ( 16 / 22 )0.9120389619852940.00258643027418462352.624608166874
Winsorized Mean ( 17 / 22 )0.9118302157352940.00244383846322438373.113947364685
Winsorized Mean ( 18 / 22 )0.9102437934117650.00220478416803740412.849387530763
Winsorized Mean ( 19 / 22 )0.9104998807205880.00212645880197184428.176590995457
Winsorized Mean ( 20 / 22 )0.9113298001323530.00186386467224888488.946334839197
Winsorized Mean ( 21 / 22 )0.9124184991176470.00154865008442087589.17021236521
Winsorized Mean ( 22 / 22 )0.9125993064411760.00146201033648272624.208518687149
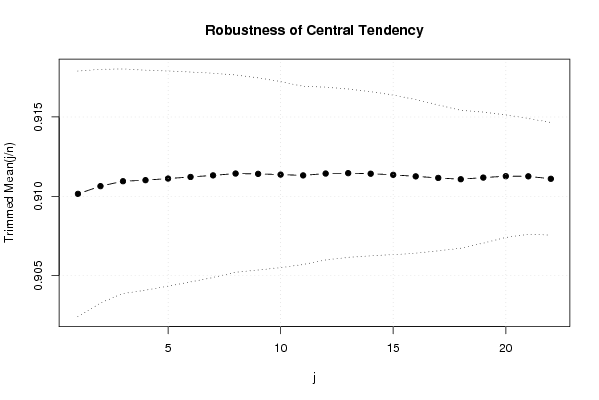
Trimmed Mean ( 1 / 22 )0.9101546822272730.003868342535261235.282856657848
Trimmed Mean ( 2 / 22 )0.9106409877656250.00367997260517595247.458632296553
Trimmed Mean ( 3 / 22 )0.9109521530.00353729312927102257.528036187302
Trimmed Mean ( 4 / 22 )0.9110178658833330.00346727383480199262.747596321696
Trimmed Mean ( 5 / 22 )0.9111202507931030.00338868803785304268.871091294187
Trimmed Mean ( 6 / 22 )0.9112207165178570.00330638593797631275.594178541533
Trimmed Mean ( 7 / 22 )0.911319173870370.00321703787615937283.278969335089
Trimmed Mean ( 8 / 22 )0.9114357278653850.00310773389065948293.279849540776
Trimmed Mean ( 9 / 22 )0.911415151940.00302609836019139301.184906587887
Trimmed Mean ( 10 / 22 )0.9113693119166670.00293060624722741310.983201096666
Trimmed Mean ( 11 / 22 )0.9113194858043480.00280747500429923324.604665903987
Trimmed Mean ( 12 / 22 )0.9114356275227270.00272233830032322334.798811527029
Trimmed Mean ( 13 / 22 )0.9114596939523810.00265166617735004343.730934812939
Trimmed Mean ( 14 / 22 )0.91142534480.00258465731366611352.629085481055
Trimmed Mean ( 15 / 22 )0.9113547402894740.00251342081049818362.595366634542
Trimmed Mean ( 16 / 22 )0.9112580459722220.00241954233210661376.624138325707
Trimmed Mean ( 17 / 22 )0.9111604314705880.00229886138007479396.352924699158
Trimmed Mean ( 18 / 22 )0.91107670843750.00217103634394920419.650601878095
Trimmed Mean ( 19 / 22 )0.9111815940333330.00206283750634492441.712733664527
Trimmed Mean ( 20 / 22 )0.9112687303214290.00192820723955485472.5989570145
Trimmed Mean ( 21 / 22 )0.911260744269230.00182290783147218499.894031138862
Trimmed Mean ( 22 / 22 )0.911104539250.00177418762625889513.533363532235
Median0.9080338265
Midrange0.90082846
Midmean - Weighted Average at Xnp0.910443731971429
Midmean - Weighted Average at X(n+1)p0.911160431470589
Midmean - Empirical Distribution Function0.910443731971429
Midmean - Empirical Distribution Function - Averaging0.911160431470589
Midmean - Empirical Distribution Function - Interpolation0.911160431470589
Midmean - Closest Observation0.910443731971429
Midmean - True Basic - Statistics Graphics Toolkit0.911160431470589
Midmean - MS Excel (old versions)0.911258045972222
Number of observations68

\begin{tabular}{lllllllll}
\hline
Central Tendency - Ungrouped Data \tabularnewline
Measure & Value & S.E. & Value/S.E. \tabularnewline
Arithmetic Mean & 0.90988038157353 & 0.00416835701280945 & 218.282737965450 \tabularnewline
Geometric Mean & 0.909233807872195 &  &  \tabularnewline
Harmonic Mean & 0.908580114445338 &  &  \tabularnewline
Quadratic Mean & 0.910519877424359 &  &  \tabularnewline
Winsorized Mean ( 1 / 22 ) & 0.909696982897059 & 0.0040236414507774 & 226.087983739530 \tabularnewline
Winsorized Mean ( 2 / 22 ) & 0.910073568808824 & 0.0038952599278757 & 233.636159244741 \tabularnewline
Winsorized Mean ( 3 / 22 ) & 0.910778207132353 & 0.00367739599018195 & 247.669331658593 \tabularnewline
Winsorized Mean ( 4 / 22 ) & 0.910668552661765 & 0.00365682553114599 & 249.032540629953 \tabularnewline
Winsorized Mean ( 5 / 22 ) & 0.910706568397059 & 0.00361110886395017 & 252.195822033690 \tabularnewline
Winsorized Mean ( 6 / 22 ) & 0.910751596191177 & 0.00356678185226900 & 255.342668521150 \tabularnewline
Winsorized Mean ( 7 / 22 ) & 0.910695267191177 & 0.00355675205420353 & 256.046880218956 \tabularnewline
Winsorized Mean ( 8 / 22 ) & 0.911556762720588 & 0.00334685320034482 & 272.362338039408 \tabularnewline
Winsorized Mean ( 9 / 22 ) & 0.911706370911765 & 0.00331167496470149 & 275.300680359476 \tabularnewline
Winsorized Mean ( 10 / 22 ) & 0.911706370911765 & 0.00331167496470149 & 275.300680359476 \tabularnewline
Winsorized Mean ( 11 / 22 ) & 0.910492830044118 & 0.00301785160084978 & 301.702320216056 \tabularnewline
Winsorized Mean ( 12 / 22 ) & 0.911257252808824 & 0.00284923011568442 & 319.825783039615 \tabularnewline
Winsorized Mean ( 13 / 22 ) & 0.911722363941177 & 0.00273285571514721 & 333.615257800782 \tabularnewline
Winsorized Mean ( 14 / 22 ) & 0.911977721264706 & 0.00264814728349032 & 344.383307888638 \tabularnewline
Winsorized Mean ( 15 / 22 ) & 0.91212260692647 & 0.00262628301273824 & 347.305527432653 \tabularnewline
Winsorized Mean ( 16 / 22 ) & 0.912038961985294 & 0.00258643027418462 & 352.624608166874 \tabularnewline
Winsorized Mean ( 17 / 22 ) & 0.911830215735294 & 0.00244383846322438 & 373.113947364685 \tabularnewline
Winsorized Mean ( 18 / 22 ) & 0.910243793411765 & 0.00220478416803740 & 412.849387530763 \tabularnewline
Winsorized Mean ( 19 / 22 ) & 0.910499880720588 & 0.00212645880197184 & 428.176590995457 \tabularnewline
Winsorized Mean ( 20 / 22 ) & 0.911329800132353 & 0.00186386467224888 & 488.946334839197 \tabularnewline
Winsorized Mean ( 21 / 22 ) & 0.912418499117647 & 0.00154865008442087 & 589.17021236521 \tabularnewline
Winsorized Mean ( 22 / 22 ) & 0.912599306441176 & 0.00146201033648272 & 624.208518687149 \tabularnewline
Trimmed Mean ( 1 / 22 ) & 0.910154682227273 & 0.003868342535261 & 235.282856657848 \tabularnewline
Trimmed Mean ( 2 / 22 ) & 0.910640987765625 & 0.00367997260517595 & 247.458632296553 \tabularnewline
Trimmed Mean ( 3 / 22 ) & 0.910952153 & 0.00353729312927102 & 257.528036187302 \tabularnewline
Trimmed Mean ( 4 / 22 ) & 0.911017865883333 & 0.00346727383480199 & 262.747596321696 \tabularnewline
Trimmed Mean ( 5 / 22 ) & 0.911120250793103 & 0.00338868803785304 & 268.871091294187 \tabularnewline
Trimmed Mean ( 6 / 22 ) & 0.911220716517857 & 0.00330638593797631 & 275.594178541533 \tabularnewline
Trimmed Mean ( 7 / 22 ) & 0.91131917387037 & 0.00321703787615937 & 283.278969335089 \tabularnewline
Trimmed Mean ( 8 / 22 ) & 0.911435727865385 & 0.00310773389065948 & 293.279849540776 \tabularnewline
Trimmed Mean ( 9 / 22 ) & 0.91141515194 & 0.00302609836019139 & 301.184906587887 \tabularnewline
Trimmed Mean ( 10 / 22 ) & 0.911369311916667 & 0.00293060624722741 & 310.983201096666 \tabularnewline
Trimmed Mean ( 11 / 22 ) & 0.911319485804348 & 0.00280747500429923 & 324.604665903987 \tabularnewline
Trimmed Mean ( 12 / 22 ) & 0.911435627522727 & 0.00272233830032322 & 334.798811527029 \tabularnewline
Trimmed Mean ( 13 / 22 ) & 0.911459693952381 & 0.00265166617735004 & 343.730934812939 \tabularnewline
Trimmed Mean ( 14 / 22 ) & 0.9114253448 & 0.00258465731366611 & 352.629085481055 \tabularnewline
Trimmed Mean ( 15 / 22 ) & 0.911354740289474 & 0.00251342081049818 & 362.595366634542 \tabularnewline
Trimmed Mean ( 16 / 22 ) & 0.911258045972222 & 0.00241954233210661 & 376.624138325707 \tabularnewline
Trimmed Mean ( 17 / 22 ) & 0.911160431470588 & 0.00229886138007479 & 396.352924699158 \tabularnewline
Trimmed Mean ( 18 / 22 ) & 0.9110767084375 & 0.00217103634394920 & 419.650601878095 \tabularnewline
Trimmed Mean ( 19 / 22 ) & 0.911181594033333 & 0.00206283750634492 & 441.712733664527 \tabularnewline
Trimmed Mean ( 20 / 22 ) & 0.911268730321429 & 0.00192820723955485 & 472.5989570145 \tabularnewline
Trimmed Mean ( 21 / 22 ) & 0.91126074426923 & 0.00182290783147218 & 499.894031138862 \tabularnewline
Trimmed Mean ( 22 / 22 ) & 0.91110453925 & 0.00177418762625889 & 513.533363532235 \tabularnewline
Median & 0.9080338265 &  &  \tabularnewline
Midrange & 0.90082846 &  &  \tabularnewline
Midmean - Weighted Average at Xnp & 0.910443731971429 &  &  \tabularnewline
Midmean - Weighted Average at X(n+1)p & 0.911160431470589 &  &  \tabularnewline
Midmean - Empirical Distribution Function & 0.910443731971429 &  &  \tabularnewline
Midmean - Empirical Distribution Function - Averaging & 0.911160431470589 &  &  \tabularnewline
Midmean - Empirical Distribution Function - Interpolation & 0.911160431470589 &  &  \tabularnewline
Midmean - Closest Observation & 0.910443731971429 &  &  \tabularnewline
Midmean - True Basic - Statistics Graphics Toolkit & 0.911160431470589 &  &  \tabularnewline
Midmean - MS Excel (old versions) & 0.911258045972222 &  &  \tabularnewline
Number of observations & 68 &  &  \tabularnewline
\hline
\end{tabular}
%Source: https://freestatistics.org/blog/index.php?pk=19619&T=1

[TABLE]
[ROW][C]Central Tendency - Ungrouped Data[/C][/ROW]
[ROW][C]Measure[/C][C]Value[/C][C]S.E.[/C][C]Value/S.E.[/C][/ROW]
[ROW][C]Arithmetic Mean[/C][C]0.90988038157353[/C][C]0.00416835701280945[/C][C]218.282737965450[/C][/ROW]
[ROW][C]Geometric Mean[/C][C]0.909233807872195[/C][C][/C][C][/C][/ROW]
[ROW][C]Harmonic Mean[/C][C]0.908580114445338[/C][C][/C][C][/C][/ROW]
[ROW][C]Quadratic Mean[/C][C]0.910519877424359[/C][C][/C][C][/C][/ROW]
[ROW][C]Winsorized Mean ( 1 / 22 )[/C][C]0.909696982897059[/C][C]0.0040236414507774[/C][C]226.087983739530[/C][/ROW]
[ROW][C]Winsorized Mean ( 2 / 22 )[/C][C]0.910073568808824[/C][C]0.0038952599278757[/C][C]233.636159244741[/C][/ROW]
[ROW][C]Winsorized Mean ( 3 / 22 )[/C][C]0.910778207132353[/C][C]0.00367739599018195[/C][C]247.669331658593[/C][/ROW]
[ROW][C]Winsorized Mean ( 4 / 22 )[/C][C]0.910668552661765[/C][C]0.00365682553114599[/C][C]249.032540629953[/C][/ROW]
[ROW][C]Winsorized Mean ( 5 / 22 )[/C][C]0.910706568397059[/C][C]0.00361110886395017[/C][C]252.195822033690[/C][/ROW]
[ROW][C]Winsorized Mean ( 6 / 22 )[/C][C]0.910751596191177[/C][C]0.00356678185226900[/C][C]255.342668521150[/C][/ROW]
[ROW][C]Winsorized Mean ( 7 / 22 )[/C][C]0.910695267191177[/C][C]0.00355675205420353[/C][C]256.046880218956[/C][/ROW]
[ROW][C]Winsorized Mean ( 8 / 22 )[/C][C]0.911556762720588[/C][C]0.00334685320034482[/C][C]272.362338039408[/C][/ROW]
[ROW][C]Winsorized Mean ( 9 / 22 )[/C][C]0.911706370911765[/C][C]0.00331167496470149[/C][C]275.300680359476[/C][/ROW]
[ROW][C]Winsorized Mean ( 10 / 22 )[/C][C]0.911706370911765[/C][C]0.00331167496470149[/C][C]275.300680359476[/C][/ROW]
[ROW][C]Winsorized Mean ( 11 / 22 )[/C][C]0.910492830044118[/C][C]0.00301785160084978[/C][C]301.702320216056[/C][/ROW]
[ROW][C]Winsorized Mean ( 12 / 22 )[/C][C]0.911257252808824[/C][C]0.00284923011568442[/C][C]319.825783039615[/C][/ROW]
[ROW][C]Winsorized Mean ( 13 / 22 )[/C][C]0.911722363941177[/C][C]0.00273285571514721[/C][C]333.615257800782[/C][/ROW]
[ROW][C]Winsorized Mean ( 14 / 22 )[/C][C]0.911977721264706[/C][C]0.00264814728349032[/C][C]344.383307888638[/C][/ROW]
[ROW][C]Winsorized Mean ( 15 / 22 )[/C][C]0.91212260692647[/C][C]0.00262628301273824[/C][C]347.305527432653[/C][/ROW]
[ROW][C]Winsorized Mean ( 16 / 22 )[/C][C]0.912038961985294[/C][C]0.00258643027418462[/C][C]352.624608166874[/C][/ROW]
[ROW][C]Winsorized Mean ( 17 / 22 )[/C][C]0.911830215735294[/C][C]0.00244383846322438[/C][C]373.113947364685[/C][/ROW]
[ROW][C]Winsorized Mean ( 18 / 22 )[/C][C]0.910243793411765[/C][C]0.00220478416803740[/C][C]412.849387530763[/C][/ROW]
[ROW][C]Winsorized Mean ( 19 / 22 )[/C][C]0.910499880720588[/C][C]0.00212645880197184[/C][C]428.176590995457[/C][/ROW]
[ROW][C]Winsorized Mean ( 20 / 22 )[/C][C]0.911329800132353[/C][C]0.00186386467224888[/C][C]488.946334839197[/C][/ROW]
[ROW][C]Winsorized Mean ( 21 / 22 )[/C][C]0.912418499117647[/C][C]0.00154865008442087[/C][C]589.17021236521[/C][/ROW]
[ROW][C]Winsorized Mean ( 22 / 22 )[/C][C]0.912599306441176[/C][C]0.00146201033648272[/C][C]624.208518687149[/C][/ROW]
[ROW][C]Trimmed Mean ( 1 / 22 )[/C][C]0.910154682227273[/C][C]0.003868342535261[/C][C]235.282856657848[/C][/ROW]
[ROW][C]Trimmed Mean ( 2 / 22 )[/C][C]0.910640987765625[/C][C]0.00367997260517595[/C][C]247.458632296553[/C][/ROW]
[ROW][C]Trimmed Mean ( 3 / 22 )[/C][C]0.910952153[/C][C]0.00353729312927102[/C][C]257.528036187302[/C][/ROW]
[ROW][C]Trimmed Mean ( 4 / 22 )[/C][C]0.911017865883333[/C][C]0.00346727383480199[/C][C]262.747596321696[/C][/ROW]
[ROW][C]Trimmed Mean ( 5 / 22 )[/C][C]0.911120250793103[/C][C]0.00338868803785304[/C][C]268.871091294187[/C][/ROW]
[ROW][C]Trimmed Mean ( 6 / 22 )[/C][C]0.911220716517857[/C][C]0.00330638593797631[/C][C]275.594178541533[/C][/ROW]
[ROW][C]Trimmed Mean ( 7 / 22 )[/C][C]0.91131917387037[/C][C]0.00321703787615937[/C][C]283.278969335089[/C][/ROW]
[ROW][C]Trimmed Mean ( 8 / 22 )[/C][C]0.911435727865385[/C][C]0.00310773389065948[/C][C]293.279849540776[/C][/ROW]
[ROW][C]Trimmed Mean ( 9 / 22 )[/C][C]0.91141515194[/C][C]0.00302609836019139[/C][C]301.184906587887[/C][/ROW]
[ROW][C]Trimmed Mean ( 10 / 22 )[/C][C]0.911369311916667[/C][C]0.00293060624722741[/C][C]310.983201096666[/C][/ROW]
[ROW][C]Trimmed Mean ( 11 / 22 )[/C][C]0.911319485804348[/C][C]0.00280747500429923[/C][C]324.604665903987[/C][/ROW]
[ROW][C]Trimmed Mean ( 12 / 22 )[/C][C]0.911435627522727[/C][C]0.00272233830032322[/C][C]334.798811527029[/C][/ROW]
[ROW][C]Trimmed Mean ( 13 / 22 )[/C][C]0.911459693952381[/C][C]0.00265166617735004[/C][C]343.730934812939[/C][/ROW]
[ROW][C]Trimmed Mean ( 14 / 22 )[/C][C]0.9114253448[/C][C]0.00258465731366611[/C][C]352.629085481055[/C][/ROW]
[ROW][C]Trimmed Mean ( 15 / 22 )[/C][C]0.911354740289474[/C][C]0.00251342081049818[/C][C]362.595366634542[/C][/ROW]
[ROW][C]Trimmed Mean ( 16 / 22 )[/C][C]0.911258045972222[/C][C]0.00241954233210661[/C][C]376.624138325707[/C][/ROW]
[ROW][C]Trimmed Mean ( 17 / 22 )[/C][C]0.911160431470588[/C][C]0.00229886138007479[/C][C]396.352924699158[/C][/ROW]
[ROW][C]Trimmed Mean ( 18 / 22 )[/C][C]0.9110767084375[/C][C]0.00217103634394920[/C][C]419.650601878095[/C][/ROW]
[ROW][C]Trimmed Mean ( 19 / 22 )[/C][C]0.911181594033333[/C][C]0.00206283750634492[/C][C]441.712733664527[/C][/ROW]
[ROW][C]Trimmed Mean ( 20 / 22 )[/C][C]0.911268730321429[/C][C]0.00192820723955485[/C][C]472.5989570145[/C][/ROW]
[ROW][C]Trimmed Mean ( 21 / 22 )[/C][C]0.91126074426923[/C][C]0.00182290783147218[/C][C]499.894031138862[/C][/ROW]
[ROW][C]Trimmed Mean ( 22 / 22 )[/C][C]0.91110453925[/C][C]0.00177418762625889[/C][C]513.533363532235[/C][/ROW]
[ROW][C]Median[/C][C]0.9080338265[/C][C][/C][C][/C][/ROW]
[ROW][C]Midrange[/C][C]0.90082846[/C][C][/C][C][/C][/ROW]
[ROW][C]Midmean - Weighted Average at Xnp[/C][C]0.910443731971429[/C][C][/C][C][/C][/ROW]
[ROW][C]Midmean - Weighted Average at X(n+1)p[/C][C]0.911160431470589[/C][C][/C][C][/C][/ROW]
[ROW][C]Midmean - Empirical Distribution Function[/C][C]0.910443731971429[/C][C][/C][C][/C][/ROW]
[ROW][C]Midmean - Empirical Distribution Function - Averaging[/C][C]0.911160431470589[/C][C][/C][C][/C][/ROW]
[ROW][C]Midmean - Empirical Distribution Function - Interpolation[/C][C]0.911160431470589[/C][C][/C][C][/C][/ROW]
[ROW][C]Midmean - Closest Observation[/C][C]0.910443731971429[/C][C][/C][C][/C][/ROW]
[ROW][C]Midmean - True Basic - Statistics Graphics Toolkit[/C][C]0.911160431470589[/C][C][/C][C][/C][/ROW]
[ROW][C]Midmean - MS Excel (old versions)[/C][C]0.911258045972222[/C][C][/C][C][/C][/ROW]
[ROW][C]Number of observations[/C][C]68[/C][C][/C][C][/C][/ROW]
[/TABLE]
Source: https://freestatistics.org/blog/index.php?pk=19619&T=1

Globally Unique Identifier (entire table): ba.freestatistics.org/blog/index.php?pk=19619&T=1

As an alternative you can also use a QR Code:  

The GUIDs for individual cells are displayed in the table below:

Central Tendency - Ungrouped Data
MeasureValueS.E.Value/S.E.
Arithmetic Mean0.909880381573530.00416835701280945218.282737965450
Geometric Mean0.909233807872195
Harmonic Mean0.908580114445338
Quadratic Mean0.910519877424359
Winsorized Mean ( 1 / 22 )0.9096969828970590.0040236414507774226.087983739530
Winsorized Mean ( 2 / 22 )0.9100735688088240.0038952599278757233.636159244741
Winsorized Mean ( 3 / 22 )0.9107782071323530.00367739599018195247.669331658593
Winsorized Mean ( 4 / 22 )0.9106685526617650.00365682553114599249.032540629953
Winsorized Mean ( 5 / 22 )0.9107065683970590.00361110886395017252.195822033690
Winsorized Mean ( 6 / 22 )0.9107515961911770.00356678185226900255.342668521150
Winsorized Mean ( 7 / 22 )0.9106952671911770.00355675205420353256.046880218956
Winsorized Mean ( 8 / 22 )0.9115567627205880.00334685320034482272.362338039408
Winsorized Mean ( 9 / 22 )0.9117063709117650.00331167496470149275.300680359476
Winsorized Mean ( 10 / 22 )0.9117063709117650.00331167496470149275.300680359476
Winsorized Mean ( 11 / 22 )0.9104928300441180.00301785160084978301.702320216056
Winsorized Mean ( 12 / 22 )0.9112572528088240.00284923011568442319.825783039615
Winsorized Mean ( 13 / 22 )0.9117223639411770.00273285571514721333.615257800782
Winsorized Mean ( 14 / 22 )0.9119777212647060.00264814728349032344.383307888638
Winsorized Mean ( 15 / 22 )0.912122606926470.00262628301273824347.305527432653
Winsorized Mean ( 16 / 22 )0.9120389619852940.00258643027418462352.624608166874
Winsorized Mean ( 17 / 22 )0.9118302157352940.00244383846322438373.113947364685
Winsorized Mean ( 18 / 22 )0.9102437934117650.00220478416803740412.849387530763
Winsorized Mean ( 19 / 22 )0.9104998807205880.00212645880197184428.176590995457
Winsorized Mean ( 20 / 22 )0.9113298001323530.00186386467224888488.946334839197
Winsorized Mean ( 21 / 22 )0.9124184991176470.00154865008442087589.17021236521
Winsorized Mean ( 22 / 22 )0.9125993064411760.00146201033648272624.208518687149
Trimmed Mean ( 1 / 22 )0.9101546822272730.003868342535261235.282856657848
Trimmed Mean ( 2 / 22 )0.9106409877656250.00367997260517595247.458632296553
Trimmed Mean ( 3 / 22 )0.9109521530.00353729312927102257.528036187302
Trimmed Mean ( 4 / 22 )0.9110178658833330.00346727383480199262.747596321696
Trimmed Mean ( 5 / 22 )0.9111202507931030.00338868803785304268.871091294187
Trimmed Mean ( 6 / 22 )0.9112207165178570.00330638593797631275.594178541533
Trimmed Mean ( 7 / 22 )0.911319173870370.00321703787615937283.278969335089
Trimmed Mean ( 8 / 22 )0.9114357278653850.00310773389065948293.279849540776
Trimmed Mean ( 9 / 22 )0.911415151940.00302609836019139301.184906587887
Trimmed Mean ( 10 / 22 )0.9113693119166670.00293060624722741310.983201096666
Trimmed Mean ( 11 / 22 )0.9113194858043480.00280747500429923324.604665903987
Trimmed Mean ( 12 / 22 )0.9114356275227270.00272233830032322334.798811527029
Trimmed Mean ( 13 / 22 )0.9114596939523810.00265166617735004343.730934812939
Trimmed Mean ( 14 / 22 )0.91142534480.00258465731366611352.629085481055
Trimmed Mean ( 15 / 22 )0.9113547402894740.00251342081049818362.595366634542
Trimmed Mean ( 16 / 22 )0.9112580459722220.00241954233210661376.624138325707
Trimmed Mean ( 17 / 22 )0.9111604314705880.00229886138007479396.352924699158
Trimmed Mean ( 18 / 22 )0.91107670843750.00217103634394920419.650601878095
Trimmed Mean ( 19 / 22 )0.9111815940333330.00206283750634492441.712733664527
Trimmed Mean ( 20 / 22 )0.9112687303214290.00192820723955485472.5989570145
Trimmed Mean ( 21 / 22 )0.911260744269230.00182290783147218499.894031138862
Trimmed Mean ( 22 / 22 )0.911104539250.00177418762625889513.533363532235
Median0.9080338265
Midrange0.90082846
Midmean - Weighted Average at Xnp0.910443731971429
Midmean - Weighted Average at X(n+1)p0.911160431470589
Midmean - Empirical Distribution Function0.910443731971429
Midmean - Empirical Distribution Function - Averaging0.911160431470589
Midmean - Empirical Distribution Function - Interpolation0.911160431470589
Midmean - Closest Observation0.910443731971429
Midmean - True Basic - Statistics Graphics Toolkit0.911160431470589
Midmean - MS Excel (old versions)0.911258045972222
Number of observations68


Parameters (Session):
Parameters (R input):
R code (references can be found in the software module):
geomean <- function(x) {
return(exp(mean(log(x))))
}
harmean <- function(x) {
return(1/mean(1/x))
}
quamean <- function(x) {
return(sqrt(mean(x*x)))
}
winmean <- function(x) {
x <-sort(x[!is.na(x)])
n<-length(x)
denom <- 3
nodenom <- n/denom
if (nodenom>40) denom <- n/40
sqrtn = sqrt(n)
roundnodenom = floor(nodenom)
win <- array(NA,dim=c(roundnodenom,2))
for (j in 1:roundnodenom) {
win[j,1] <- (j*x[j+1]+sum(x[(j+1):(n-j)])+j*x[n-j])/n
win[j,2] <- sd(c(rep(x[j+1],j),x[(j+1):(n-j)],rep(x[n-j],j)))/sqrtn
}
return(win)
}
trimean <- function(x) {
x <-sort(x[!is.na(x)])
n<-length(x)
denom <- 3
nodenom <- n/denom
if (nodenom>40) denom <- n/40
sqrtn = sqrt(n)
roundnodenom = floor(nodenom)
tri <- array(NA,dim=c(roundnodenom,2))
for (j in 1:roundnodenom) {
tri[j,1] <- mean(x,trim=j/n)
tri[j,2] <- sd(x[(j+1):(n-j)]) / sqrt(n-j*2)
}
return(tri)
}
midrange <- function(x) {
return((max(x)+min(x))/2)
}
q1 <- function(data,n,p,i,f) {
np <- n*p;
i <<- floor(np)
f <<- np - i
qvalue <- (1-f)*data[i] + f*data[i+1]
}
q2 <- function(data,n,p,i,f) {
np <- (n+1)*p
i <<- floor(np)
f <<- np - i
qvalue <- (1-f)*data[i] + f*data[i+1]
}
q3 <- function(data,n,p,i,f) {
np <- n*p
i <<- floor(np)
f <<- np - i
if (f==0) {
qvalue <- data[i]
} else {
qvalue <- data[i+1]
}
}
q4 <- function(data,n,p,i,f) {
np <- n*p
i <<- floor(np)
f <<- np - i
if (f==0) {
qvalue <- (data[i]+data[i+1])/2
} else {
qvalue <- data[i+1]
}
}
q5 <- function(data,n,p,i,f) {
np <- (n-1)*p
i <<- floor(np)
f <<- np - i
if (f==0) {
qvalue <- data[i+1]
} else {
qvalue <- data[i+1] + f*(data[i+2]-data[i+1])
}
}
q6 <- function(data,n,p,i,f) {
np <- n*p+0.5
i <<- floor(np)
f <<- np - i
qvalue <- data[i]
}
q7 <- function(data,n,p,i,f) {
np <- (n+1)*p
i <<- floor(np)
f <<- np - i
if (f==0) {
qvalue <- data[i]
} else {
qvalue <- f*data[i] + (1-f)*data[i+1]
}
}
q8 <- function(data,n,p,i,f) {
np <- (n+1)*p
i <<- floor(np)
f <<- np - i
if (f==0) {
qvalue <- data[i]
} else {
if (f == 0.5) {
qvalue <- (data[i]+data[i+1])/2
} else {
if (f < 0.5) {
qvalue <- data[i]
} else {
qvalue <- data[i+1]
}
}
}
}
midmean <- function(x,def) {
x <-sort(x[!is.na(x)])
n<-length(x)
if (def==1) {
qvalue1 <- q1(x,n,0.25,i,f)
qvalue3 <- q1(x,n,0.75,i,f)
}
if (def==2) {
qvalue1 <- q2(x,n,0.25,i,f)
qvalue3 <- q2(x,n,0.75,i,f)
}
if (def==3) {
qvalue1 <- q3(x,n,0.25,i,f)
qvalue3 <- q3(x,n,0.75,i,f)
}
if (def==4) {
qvalue1 <- q4(x,n,0.25,i,f)
qvalue3 <- q4(x,n,0.75,i,f)
}
if (def==5) {
qvalue1 <- q5(x,n,0.25,i,f)
qvalue3 <- q5(x,n,0.75,i,f)
}
if (def==6) {
qvalue1 <- q6(x,n,0.25,i,f)
qvalue3 <- q6(x,n,0.75,i,f)
}
if (def==7) {
qvalue1 <- q7(x,n,0.25,i,f)
qvalue3 <- q7(x,n,0.75,i,f)
}
if (def==8) {
qvalue1 <- q8(x,n,0.25,i,f)
qvalue3 <- q8(x,n,0.75,i,f)
}
midm <- 0
myn <- 0
roundno4 <- round(n/4)
round3no4 <- round(3*n/4)
for (i in 1:n) {
if ((x[i]>=qvalue1) & (x[i]<=qvalue3)){
midm = midm + x[i]
myn = myn + 1
}
}
midm = midm / myn
return(midm)
}
(arm <- mean(x))
sqrtn <- sqrt(length(x))
(armse <- sd(x) / sqrtn)
(armose <- arm / armse)
(geo <- geomean(x))
(har <- harmean(x))
(qua <- quamean(x))
(win <- winmean(x))
(tri <- trimean(x))
(midr <- midrange(x))
midm <- array(NA,dim=8)
for (j in 1:8) midm[j] <- midmean(x,j)
midm
bitmap(file='test1.png')
lb <- win[,1] - 2*win[,2]
ub <- win[,1] + 2*win[,2]
if ((ylimmin == '') | (ylimmax == '')) plot(win[,1],type='b',main=main, xlab='j', pch=19, ylab='Winsorized Mean(j/n)', ylim=c(min(lb),max(ub))) else plot(win[,1],type='l',main=main, xlab='j', pch=19, ylab='Winsorized Mean(j/n)', ylim=c(ylimmin,ylimmax))
lines(ub,lty=3)
lines(lb,lty=3)
grid()
dev.off()
bitmap(file='test2.png')
lb <- tri[,1] - 2*tri[,2]
ub <- tri[,1] + 2*tri[,2]
if ((ylimmin == '') | (ylimmax == '')) plot(tri[,1],type='b',main=main, xlab='j', pch=19, ylab='Trimmed Mean(j/n)', ylim=c(min(lb),max(ub))) else plot(tri[,1],type='l',main=main, xlab='j', pch=19, ylab='Trimmed Mean(j/n)', ylim=c(ylimmin,ylimmax))
lines(ub,lty=3)
lines(lb,lty=3)
grid()
dev.off()
load(file='createtable')
a<-table.start()
a<-table.row.start(a)
a<-table.element(a,'Central Tendency - Ungrouped Data',4,TRUE)
a<-table.row.end(a)
a<-table.row.start(a)
a<-table.element(a,'Measure',header=TRUE)
a<-table.element(a,'Value',header=TRUE)
a<-table.element(a,'S.E.',header=TRUE)
a<-table.element(a,'Value/S.E.',header=TRUE)
a<-table.row.end(a)
a<-table.row.start(a)
a<-table.element(a,hyperlink('arithmetic_mean.htm', 'Arithmetic Mean', 'click to view the definition of the Arithmetic Mean'),header=TRUE)
a<-table.element(a,arm)
a<-table.element(a,hyperlink('arithmetic_mean_standard_error.htm', armse, 'click to view the definition of the Standard Error of the Arithmetic Mean'))
a<-table.element(a,armose)
a<-table.row.end(a)
a<-table.row.start(a)
a<-table.element(a,hyperlink('geometric_mean.htm', 'Geometric Mean', 'click to view the definition of the Geometric Mean'),header=TRUE)
a<-table.element(a,geo)
a<-table.element(a,'')
a<-table.row.end(a)
a<-table.row.start(a)
a<-table.element(a,hyperlink('harmonic_mean.htm', 'Harmonic Mean', 'click to view the definition of the Harmonic Mean'),header=TRUE)
a<-table.element(a,har)
a<-table.element(a,'')
a<-table.row.end(a)
a<-table.row.start(a)
a<-table.element(a,hyperlink('quadratic_mean.htm', 'Quadratic Mean', 'click to view the definition of the Quadratic Mean'),header=TRUE)
a<-table.element(a,qua)
a<-table.element(a,'')
a<-table.row.end(a)
for (j in 1:length(win[,1])) {
a<-table.row.start(a)
mylabel <- paste('Winsorized Mean (',j)
mylabel <- paste(mylabel,'/')
mylabel <- paste(mylabel,length(win[,1]))
mylabel <- paste(mylabel,')')
a<-table.element(a,hyperlink('winsorized_mean.htm', mylabel, 'click to view the definition of the Winsorized Mean'),header=TRUE)
a<-table.element(a,win[j,1])
a<-table.element(a,win[j,2])
a<-table.element(a,win[j,1]/win[j,2])
a<-table.row.end(a)
}
for (j in 1:length(tri[,1])) {
a<-table.row.start(a)
mylabel <- paste('Trimmed Mean (',j)
mylabel <- paste(mylabel,'/')
mylabel <- paste(mylabel,length(tri[,1]))
mylabel <- paste(mylabel,')')
a<-table.element(a,hyperlink('arithmetic_mean.htm', mylabel, 'click to view the definition of the Trimmed Mean'),header=TRUE)
a<-table.element(a,tri[j,1])
a<-table.element(a,tri[j,2])
a<-table.element(a,tri[j,1]/tri[j,2])
a<-table.row.end(a)
}
a<-table.row.start(a)
a<-table.element(a,hyperlink('median_1.htm', 'Median', 'click to view the definition of the Median'),header=TRUE)
a<-table.element(a,median(x))
a<-table.element(a,'')
a<-table.row.end(a)
a<-table.row.start(a)
a<-table.element(a,hyperlink('midrange.htm', 'Midrange', 'click to view the definition of the Midrange'),header=TRUE)
a<-table.element(a,midr)
a<-table.element(a,'')
a<-table.row.end(a)
a<-table.row.start(a)
mymid <- hyperlink('midmean.htm', 'Midmean', 'click to view the definition of the Midmean')
mylabel <- paste(mymid,hyperlink('method_1.htm','Weighted Average at Xnp',''),sep=' - ')
a<-table.element(a,mylabel,header=TRUE)
a<-table.element(a,midm[1])
a<-table.element(a,'')
a<-table.row.end(a)
a<-table.row.start(a)
mymid <- hyperlink('midmean.htm', 'Midmean', 'click to view the definition of the Midmean')
mylabel <- paste(mymid,hyperlink('method_2.htm','Weighted Average at X(n+1)p',''),sep=' - ')
a<-table.element(a,mylabel,header=TRUE)
a<-table.element(a,midm[2])
a<-table.element(a,'')
a<-table.row.end(a)
a<-table.row.start(a)
mymid <- hyperlink('midmean.htm', 'Midmean', 'click to view the definition of the Midmean')
mylabel <- paste(mymid,hyperlink('method_3.htm','Empirical Distribution Function',''),sep=' - ')
a<-table.element(a,mylabel,header=TRUE)
a<-table.element(a,midm[3])
a<-table.element(a,'')
a<-table.row.end(a)
a<-table.row.start(a)
mymid <- hyperlink('midmean.htm', 'Midmean', 'click to view the definition of the Midmean')
mylabel <- paste(mymid,hyperlink('method_4.htm','Empirical Distribution Function - Averaging',''),sep=' - ')
a<-table.element(a,mylabel,header=TRUE)
a<-table.element(a,midm[4])
a<-table.element(a,'')
a<-table.row.end(a)
a<-table.row.start(a)
mymid <- hyperlink('midmean.htm', 'Midmean', 'click to view the definition of the Midmean')
mylabel <- paste(mymid,hyperlink('method_5.htm','Empirical Distribution Function - Interpolation',''),sep=' - ')
a<-table.element(a,mylabel,header=TRUE)
a<-table.element(a,midm[5])
a<-table.element(a,'')
a<-table.row.end(a)
a<-table.row.start(a)
mymid <- hyperlink('midmean.htm', 'Midmean', 'click to view the definition of the Midmean')
mylabel <- paste(mymid,hyperlink('method_6.htm','Closest Observation',''),sep=' - ')
a<-table.element(a,mylabel,header=TRUE)
a<-table.element(a,midm[6])
a<-table.element(a,'')
a<-table.row.end(a)
a<-table.row.start(a)
mymid <- hyperlink('midmean.htm', 'Midmean', 'click to view the definition of the Midmean')
mylabel <- paste(mymid,hyperlink('method_7.htm','True Basic - Statistics Graphics Toolkit',''),sep=' - ')
a<-table.element(a,mylabel,header=TRUE)
a<-table.element(a,midm[7])
a<-table.element(a,'')
a<-table.row.end(a)
a<-table.row.start(a)
mymid <- hyperlink('midmean.htm', 'Midmean', 'click to view the definition of the Midmean')
mylabel <- paste(mymid,hyperlink('method_8.htm','MS Excel (old versions)',''),sep=' - ')
a<-table.element(a,mylabel,header=TRUE)
a<-table.element(a,midm[8])
a<-table.element(a,'')
a<-table.row.end(a)
a<-table.row.start(a)
a<-table.element(a,'Number of observations',header=TRUE)
a<-table.element(a,length(x))
a<-table.element(a,'')
a<-table.row.end(a)
a<-table.end(a)
table.save(a,file='mytable.tab')