Free Statistics

of Irreproducible Research!

Author's title

Author*The author of this computation has been verified*
R Software Modulerwasp_autocorrelation.wasp
Title produced by software(Partial) Autocorrelation Function
Date of computationMon, 27 Oct 2008 14:26:48 -0600
Cite this page as followsStatistical Computations at FreeStatistics.org, Office for Research Development and Education, URL https://freestatistics.org/blog/index.php?v=date/2008/Oct/27/t122513925394f5wcs5b22x8uj.htm/, Retrieved Sun, 19 May 2024 13:08:24 +0000
Statistical Computations at FreeStatistics.org, Office for Research Development and Education, URL https://freestatistics.org/blog/index.php?pk=19581, Retrieved Sun, 19 May 2024 13:08:24 +0000
QR Codes:

Original text written by user:
IsPrivate?No (this computation is public)
User-defined keywords
Estimated Impact216
Family? (F = Feedback message, R = changed R code, M = changed R Module, P = changed Parameters, D = changed Data)
F     [Univariate Explorative Data Analysis] [Investigation Dis...] [2007-10-21 17:06:37] [b9964c45117f7aac638ab9056d451faa]
F RMPD  [(Partial) Autocorrelation Function] [] [2008-10-23 10:32:19] [28075c6928548bea087cb2be962cfe7e]
F           [(Partial) Autocorrelation Function] [investigating dis...] [2008-10-27 20:26:48] [577b699a0819d2125728ba9ae2c57238] [Current]
Feedback Forum
2008-10-29 13:09:21 [Ken Van den Heuvel] [reply
Q2:

Assumptie 1:

Correct antwoord, maar waarom 17 lags? Gezien je met jaar data werkt onderzoek je hier autocorrelatie op 1jaar en 5 maanden...1jaar,2jaar of 3jaar had logischer geweest.
Je kon dit trouwens ook oplossen door gewoon in de R module van de berekening van de student de lags op te geven. Hier heb je een voorbeeld: http://www.freestatistics.org/blog/index.php?v=date/2008/Oct/23/t1224764711fqxt1dpnpzyc2e4.htm/

Assumptie 2:

Correct. Het histogram kan hier trouwens ook voor gebruikt worden.

Assumptie 3:
Fixed location

http://www.freestatistics.org/blog/index.php?v=date/2008/Oct/28/t1225220484jswurbt3ibggf56.htm

Best is om via central tendency dit even te verifieren, louter op het zicht is nogal riskant. Uit mijn berekening blijkt dat de locatie niet altijd vast is over de gehele termijn, kijk maar naar de winzorised mean plot. Je conclusie dat de data goed gecorreleerd zijn doet hier desgevallend weinig ter zake.

Assumptie 4:
Fixed variation

Hiervoor kan je bovenstaande link gebruiken, of deze nieuwe waar ik het gemiddelde van de x waarden heb afgetrokken om de error component over te houden.
http://www.freestatistics.org/blog/index.php?v=date/2008/Oct/28/t1225220321std1trcmlbp0m19.htm

Je ziet dat de mean van de errors binnen het betrouwbaarheidsinterval ligt. De variatie zal dus vast zijn.

Zo had je dus ook deze assumptie kunnen controleren. De student in het voorbeeld had het dus fout.
2008-11-02 12:17:03 [Ciska Tanghe] [reply
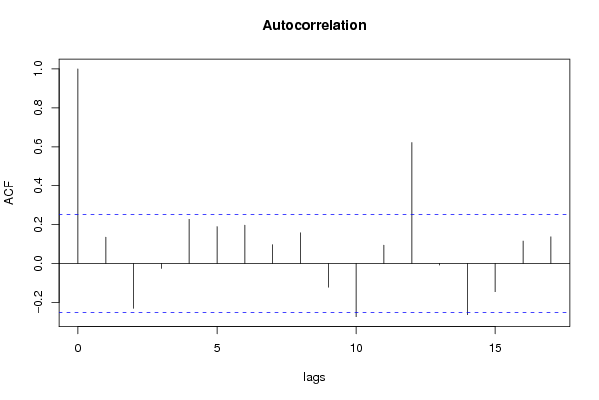
Om assumptie 1 te testen, kan ook gebruik gemaakt worden van de lag-plot. Het aantal lags wordt bij 12 ingesteld. De autocorrelatiefunctie die de student gebruikt heeft is een samenvatting van alle lagplots, maar kan dus evengoed gebruikt worde om deze assumptie te testen. Waarom de student het aantal lags op 17 ingesteld heeft, is mij onduidelijk. Logischer zou 12, 24 of 36 zijn omdat je met jaargegevens werkt. Bij de volgende link heb ik de a lags ingesteld op 36. Dan kan je zien dat bij 12 en 24 grote correlatie is. We kunnen dus besluiten dat deze tijdreeks niet random is, want er is wel degelijk correlatie, namelijk seizoensgebonden correlatie.

http://www.freestatistics.org/blog/date/2008/Nov/02/t1225628110brmgqru7aj876v1.htm
2008-11-02 12:27:46 [Ciska Tanghe] [reply
Het is nogal moeilijk om de volgende drie assumpties te controleren aangezien de student deze niet herberekend heeft en dus niet geverifieerd kunnen worden.

Hieronder vind je de link terug met mijn berekeningen.

http://www.freestatistics.org/blog/index.php?v=date/2008/Oct/26/t1225014161jd0394w6eitv1cf.htm/

Assumptie twee werd correct beantwoord. Je kan dit ook aflezen op het histogram.

Assumptie drie klopt niet. De student heeft een verkeerde grafiek besproken. Hier maken we gebruik van de Run Sequence Plot. Als we naar deze grafiek kijken, zien we duidelijk een dalende trend. Deze wijkt af van de economische groei.

Assumptie vier is niet correct. Deze assumptie kan wel degelijk gecontroleerd worden door gebruik te maken van de Run Sequence Plot.
2008-11-02 12:39:15 [Ciska Tanghe] [reply
Wat ik daarnet zei over assumptie 3 en 4 mag verwijderd worden. Ik was verstrooid en gaf antwoord op Q3 en Q4 in plaats van de assumpties.

Assumptie 3 kan van de Run Sequence Plot afgelezen worden, maar ook van de Central tendency. Op de Run Sequence Plot is er geen constant niveau van de reeks. Op de grafiek van Central Tendency zien we ook dat er een dalende trend is en het gemiddelde niet constant is. We vermoeden een dalende trend.

Assumptie 4 kan getest worden aan de hand van de Run Sequence Plot. We gaan kijken naar de spreiding over de tijd heen. We trekken het gemiddelde van de x af om zo de error component te bekomen. We kunnen concluderen dat deze gelijk is aan 0 en dat er een vaste variatie is.

Post a new message
Dataseries X:
109.20
88.60
94.30
98.30
86.40
80.60
104.10
108.20
93.40
71.90
94.10
94.90
96.40
91.10
84.40
86.40
88.00
75.10
109.70
103.00
82.10
68.00
96.40
94.30
90.00
88.00
76.10
82.50
81.40
66.50
97.20
94.10
80.70
70.50
87.80
89.50
99.60
84.20
75.10
92.00
80.80
73.10
99.80
90.00
83.10
72.40
78.80
87.30
91.00
80.10
73.60
86.40
74.50
71.20
92.40
81.50
85.30
69.90
84.20
90.70
100.30


Summary of computational transaction
Raw Inputview raw input (R code)
Raw Outputview raw output of R engine
Computing time3 seconds
R Server'Herman Ole Andreas Wold' @ 193.190.124.10:1001

\begin{tabular}{lllllllll}
\hline
Summary of computational transaction \tabularnewline
Raw Input & view raw input (R code)  \tabularnewline
Raw Output & view raw output of R engine  \tabularnewline
Computing time & 3 seconds \tabularnewline
R Server & 'Herman Ole Andreas Wold' @ 193.190.124.10:1001 \tabularnewline
\hline
\end{tabular}
%Source: https://freestatistics.org/blog/index.php?pk=19581&T=0

[TABLE]
[ROW][C]Summary of computational transaction[/C][/ROW]
[ROW][C]Raw Input[/C][C]view raw input (R code) [/C][/ROW]
[ROW][C]Raw Output[/C][C]view raw output of R engine [/C][/ROW]
[ROW][C]Computing time[/C][C]3 seconds[/C][/ROW]
[ROW][C]R Server[/C][C]'Herman Ole Andreas Wold' @ 193.190.124.10:1001[/C][/ROW]
[/TABLE]
Source: https://freestatistics.org/blog/index.php?pk=19581&T=0

Globally Unique Identifier (entire table): ba.freestatistics.org/blog/index.php?pk=19581&T=0

As an alternative you can also use a QR Code:  

The GUIDs for individual cells are displayed in the table below:

Summary of computational transaction
Raw Inputview raw input (R code)
Raw Outputview raw output of R engine
Computing time3 seconds
R Server'Herman Ole Andreas Wold' @ 193.190.124.10:1001


Autocorrelation Function
Time lag kACF(k)T-STATP-value
10.1348681.05340.148167
2-0.230388-1.79940.038452
3-0.025856-0.20190.420317
40.2268231.77150.040733
50.1893471.47880.072164
60.1969711.53840.064562
70.0967310.75550.226431
80.1573531.2290.111903
9-0.121757-0.9510.172691
10-0.273532-2.13640.018336
110.0938150.73270.233269
120.6218644.85694e-06
13-0.008279-0.06470.474327
14-0.26372-2.05970.02185
15-0.145361-1.13530.130345
160.1151760.89960.185948
170.1370871.07070.144266

\begin{tabular}{lllllllll}
\hline
Autocorrelation Function \tabularnewline
Time lag k & ACF(k) & T-STAT & P-value \tabularnewline
1 & 0.134868 & 1.0534 & 0.148167 \tabularnewline
2 & -0.230388 & -1.7994 & 0.038452 \tabularnewline
3 & -0.025856 & -0.2019 & 0.420317 \tabularnewline
4 & 0.226823 & 1.7715 & 0.040733 \tabularnewline
5 & 0.189347 & 1.4788 & 0.072164 \tabularnewline
6 & 0.196971 & 1.5384 & 0.064562 \tabularnewline
7 & 0.096731 & 0.7555 & 0.226431 \tabularnewline
8 & 0.157353 & 1.229 & 0.111903 \tabularnewline
9 & -0.121757 & -0.951 & 0.172691 \tabularnewline
10 & -0.273532 & -2.1364 & 0.018336 \tabularnewline
11 & 0.093815 & 0.7327 & 0.233269 \tabularnewline
12 & 0.621864 & 4.8569 & 4e-06 \tabularnewline
13 & -0.008279 & -0.0647 & 0.474327 \tabularnewline
14 & -0.26372 & -2.0597 & 0.02185 \tabularnewline
15 & -0.145361 & -1.1353 & 0.130345 \tabularnewline
16 & 0.115176 & 0.8996 & 0.185948 \tabularnewline
17 & 0.137087 & 1.0707 & 0.144266 \tabularnewline
\hline
\end{tabular}
%Source: https://freestatistics.org/blog/index.php?pk=19581&T=1

[TABLE]
[ROW][C]Autocorrelation Function[/C][/ROW]
[ROW][C]Time lag k[/C][C]ACF(k)[/C][C]T-STAT[/C][C]P-value[/C][/ROW]
[ROW][C]1[/C][C]0.134868[/C][C]1.0534[/C][C]0.148167[/C][/ROW]
[ROW][C]2[/C][C]-0.230388[/C][C]-1.7994[/C][C]0.038452[/C][/ROW]
[ROW][C]3[/C][C]-0.025856[/C][C]-0.2019[/C][C]0.420317[/C][/ROW]
[ROW][C]4[/C][C]0.226823[/C][C]1.7715[/C][C]0.040733[/C][/ROW]
[ROW][C]5[/C][C]0.189347[/C][C]1.4788[/C][C]0.072164[/C][/ROW]
[ROW][C]6[/C][C]0.196971[/C][C]1.5384[/C][C]0.064562[/C][/ROW]
[ROW][C]7[/C][C]0.096731[/C][C]0.7555[/C][C]0.226431[/C][/ROW]
[ROW][C]8[/C][C]0.157353[/C][C]1.229[/C][C]0.111903[/C][/ROW]
[ROW][C]9[/C][C]-0.121757[/C][C]-0.951[/C][C]0.172691[/C][/ROW]
[ROW][C]10[/C][C]-0.273532[/C][C]-2.1364[/C][C]0.018336[/C][/ROW]
[ROW][C]11[/C][C]0.093815[/C][C]0.7327[/C][C]0.233269[/C][/ROW]
[ROW][C]12[/C][C]0.621864[/C][C]4.8569[/C][C]4e-06[/C][/ROW]
[ROW][C]13[/C][C]-0.008279[/C][C]-0.0647[/C][C]0.474327[/C][/ROW]
[ROW][C]14[/C][C]-0.26372[/C][C]-2.0597[/C][C]0.02185[/C][/ROW]
[ROW][C]15[/C][C]-0.145361[/C][C]-1.1353[/C][C]0.130345[/C][/ROW]
[ROW][C]16[/C][C]0.115176[/C][C]0.8996[/C][C]0.185948[/C][/ROW]
[ROW][C]17[/C][C]0.137087[/C][C]1.0707[/C][C]0.144266[/C][/ROW]
[/TABLE]
Source: https://freestatistics.org/blog/index.php?pk=19581&T=1

Globally Unique Identifier (entire table): ba.freestatistics.org/blog/index.php?pk=19581&T=1

As an alternative you can also use a QR Code:  

The GUIDs for individual cells are displayed in the table below:

Autocorrelation Function
Time lag kACF(k)T-STATP-value
10.1348681.05340.148167
2-0.230388-1.79940.038452
3-0.025856-0.20190.420317
40.2268231.77150.040733
50.1893471.47880.072164
60.1969711.53840.064562
70.0967310.75550.226431
80.1573531.2290.111903
9-0.121757-0.9510.172691
10-0.273532-2.13640.018336
110.0938150.73270.233269
120.6218644.85694e-06
13-0.008279-0.06470.474327
14-0.26372-2.05970.02185
15-0.145361-1.13530.130345
160.1151760.89960.185948
170.1370871.07070.144266


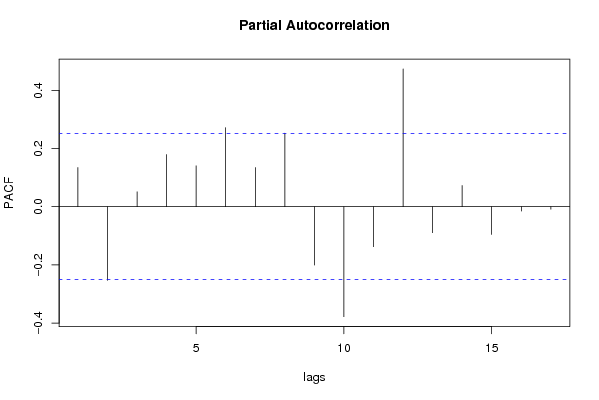
Partial Autocorrelation Function
Time lag kPACF(k)T-STATP-value
10.1348681.05340.148167
2-0.253183-1.97740.026259
30.0513990.40140.344751
40.1792421.39990.083301
50.1406331.09840.138178
60.2718562.12330.018899
70.1344911.05040.148838
80.2529031.97520.026385
9-0.200811-1.56840.060983
10-0.378002-2.95230.002236
11-0.137616-1.07480.143345
120.4737473.70010.000232
13-0.089353-0.69790.243955
140.0727080.56790.286104
15-0.09552-0.7460.229255
16-0.014972-0.11690.453649
17-0.008653-0.06760.473169

\begin{tabular}{lllllllll}
\hline
Partial Autocorrelation Function \tabularnewline
Time lag k & PACF(k) & T-STAT & P-value \tabularnewline
1 & 0.134868 & 1.0534 & 0.148167 \tabularnewline
2 & -0.253183 & -1.9774 & 0.026259 \tabularnewline
3 & 0.051399 & 0.4014 & 0.344751 \tabularnewline
4 & 0.179242 & 1.3999 & 0.083301 \tabularnewline
5 & 0.140633 & 1.0984 & 0.138178 \tabularnewline
6 & 0.271856 & 2.1233 & 0.018899 \tabularnewline
7 & 0.134491 & 1.0504 & 0.148838 \tabularnewline
8 & 0.252903 & 1.9752 & 0.026385 \tabularnewline
9 & -0.200811 & -1.5684 & 0.060983 \tabularnewline
10 & -0.378002 & -2.9523 & 0.002236 \tabularnewline
11 & -0.137616 & -1.0748 & 0.143345 \tabularnewline
12 & 0.473747 & 3.7001 & 0.000232 \tabularnewline
13 & -0.089353 & -0.6979 & 0.243955 \tabularnewline
14 & 0.072708 & 0.5679 & 0.286104 \tabularnewline
15 & -0.09552 & -0.746 & 0.229255 \tabularnewline
16 & -0.014972 & -0.1169 & 0.453649 \tabularnewline
17 & -0.008653 & -0.0676 & 0.473169 \tabularnewline
\hline
\end{tabular}
%Source: https://freestatistics.org/blog/index.php?pk=19581&T=2

[TABLE]
[ROW][C]Partial Autocorrelation Function[/C][/ROW]
[ROW][C]Time lag k[/C][C]PACF(k)[/C][C]T-STAT[/C][C]P-value[/C][/ROW]
[ROW][C]1[/C][C]0.134868[/C][C]1.0534[/C][C]0.148167[/C][/ROW]
[ROW][C]2[/C][C]-0.253183[/C][C]-1.9774[/C][C]0.026259[/C][/ROW]
[ROW][C]3[/C][C]0.051399[/C][C]0.4014[/C][C]0.344751[/C][/ROW]
[ROW][C]4[/C][C]0.179242[/C][C]1.3999[/C][C]0.083301[/C][/ROW]
[ROW][C]5[/C][C]0.140633[/C][C]1.0984[/C][C]0.138178[/C][/ROW]
[ROW][C]6[/C][C]0.271856[/C][C]2.1233[/C][C]0.018899[/C][/ROW]
[ROW][C]7[/C][C]0.134491[/C][C]1.0504[/C][C]0.148838[/C][/ROW]
[ROW][C]8[/C][C]0.252903[/C][C]1.9752[/C][C]0.026385[/C][/ROW]
[ROW][C]9[/C][C]-0.200811[/C][C]-1.5684[/C][C]0.060983[/C][/ROW]
[ROW][C]10[/C][C]-0.378002[/C][C]-2.9523[/C][C]0.002236[/C][/ROW]
[ROW][C]11[/C][C]-0.137616[/C][C]-1.0748[/C][C]0.143345[/C][/ROW]
[ROW][C]12[/C][C]0.473747[/C][C]3.7001[/C][C]0.000232[/C][/ROW]
[ROW][C]13[/C][C]-0.089353[/C][C]-0.6979[/C][C]0.243955[/C][/ROW]
[ROW][C]14[/C][C]0.072708[/C][C]0.5679[/C][C]0.286104[/C][/ROW]
[ROW][C]15[/C][C]-0.09552[/C][C]-0.746[/C][C]0.229255[/C][/ROW]
[ROW][C]16[/C][C]-0.014972[/C][C]-0.1169[/C][C]0.453649[/C][/ROW]
[ROW][C]17[/C][C]-0.008653[/C][C]-0.0676[/C][C]0.473169[/C][/ROW]
[/TABLE]
Source: https://freestatistics.org/blog/index.php?pk=19581&T=2

Globally Unique Identifier (entire table): ba.freestatistics.org/blog/index.php?pk=19581&T=2

As an alternative you can also use a QR Code:  

The GUIDs for individual cells are displayed in the table below:

Partial Autocorrelation Function
Time lag kPACF(k)T-STATP-value
10.1348681.05340.148167
2-0.253183-1.97740.026259
30.0513990.40140.344751
40.1792421.39990.083301
50.1406331.09840.138178
60.2718562.12330.018899
70.1344911.05040.148838
80.2529031.97520.026385
9-0.200811-1.56840.060983
10-0.378002-2.95230.002236
11-0.137616-1.07480.143345
120.4737473.70010.000232
13-0.089353-0.69790.243955
140.0727080.56790.286104
15-0.09552-0.7460.229255
16-0.014972-0.11690.453649
17-0.008653-0.06760.473169


Parameters (Session):
par1 = Default ; par2 = 1 ; par3 = 0 ; par4 = 0 ; par5 = 12 ;
Parameters (R input):
par1 = Default ; par2 = 1 ; par3 = 0 ; par4 = 0 ; par5 = 12 ;
R code (references can be found in the software module):
if (par1 == 'Default') {
par1 = 10*log10(length(x))
} else {
par1 <- as.numeric(par1)
}
par2 <- as.numeric(par2)
par3 <- as.numeric(par3)
par4 <- as.numeric(par4)
par5 <- as.numeric(par5)
if (par2 == 0) {
x <- log(x)
} else {
x <- (x ^ par2 - 1) / par2
}
if (par3 > 0) x <- diff(x,lag=1,difference=par3)
if (par4 > 0) x <- diff(x,lag=par5,difference=par4)
bitmap(file='pic1.png')
racf <- acf(x,par1,main='Autocorrelation',xlab='lags',ylab='ACF')
dev.off()
bitmap(file='pic2.png')
rpacf <- pacf(x,par1,main='Partial Autocorrelation',xlab='lags',ylab='PACF')
dev.off()
(myacf <- c(racf$acf))
(mypacf <- c(rpacf$acf))
lengthx <- length(x)
sqrtn <- sqrt(lengthx)
load(file='createtable')
a<-table.start()
a<-table.row.start(a)
a<-table.element(a,'Autocorrelation Function',4,TRUE)
a<-table.row.end(a)
a<-table.row.start(a)
a<-table.element(a,'Time lag k',header=TRUE)
a<-table.element(a,hyperlink('basics.htm','ACF(k)','click here for more information about the Autocorrelation Function'),header=TRUE)
a<-table.element(a,'T-STAT',header=TRUE)
a<-table.element(a,'P-value',header=TRUE)
a<-table.row.end(a)
for (i in 2:(par1+1)) {
a<-table.row.start(a)
a<-table.element(a,i-1,header=TRUE)
a<-table.element(a,round(myacf[i],6))
mytstat <- myacf[i]*sqrtn
a<-table.element(a,round(mytstat,4))
a<-table.element(a,round(1-pt(abs(mytstat),lengthx),6))
a<-table.row.end(a)
}
a<-table.end(a)
table.save(a,file='mytable.tab')
a<-table.start()
a<-table.row.start(a)
a<-table.element(a,'Partial Autocorrelation Function',4,TRUE)
a<-table.row.end(a)
a<-table.row.start(a)
a<-table.element(a,'Time lag k',header=TRUE)
a<-table.element(a,hyperlink('basics.htm','PACF(k)','click here for more information about the Partial Autocorrelation Function'),header=TRUE)
a<-table.element(a,'T-STAT',header=TRUE)
a<-table.element(a,'P-value',header=TRUE)
a<-table.row.end(a)
for (i in 1:par1) {
a<-table.row.start(a)
a<-table.element(a,i,header=TRUE)
a<-table.element(a,round(mypacf[i],6))
mytstat <- mypacf[i]*sqrtn
a<-table.element(a,round(mytstat,4))
a<-table.element(a,round(1-pt(abs(mytstat),lengthx),6))
a<-table.row.end(a)
}
a<-table.end(a)
table.save(a,file='mytable1.tab')