Free Statistics

of Irreproducible Research!

Author's title

Author*The author of this computation has been verified*
R Software Modulerwasp_edauni.wasp
Title produced by softwareUnivariate Explorative Data Analysis
Date of computationMon, 27 Oct 2008 14:01:06 -0600
Cite this page as followsStatistical Computations at FreeStatistics.org, Office for Research Development and Education, URL https://freestatistics.org/blog/index.php?v=date/2008/Oct/27/t1225137707w7h2yjv106e926c.htm/, Retrieved Sun, 19 May 2024 16:30:33 +0000
Statistical Computations at FreeStatistics.org, Office for Research Development and Education, URL https://freestatistics.org/blog/index.php?pk=19539, Retrieved Sun, 19 May 2024 16:30:33 +0000
QR Codes:

Original text written by user:
IsPrivate?No (this computation is public)
User-defined keywords
Estimated Impact149
Family? (F = Feedback message, R = changed R code, M = changed R Module, P = changed Parameters, D = changed Data)
F     [Univariate Data Series] [invoer vanuit vs] [2008-10-13 19:11:39] [57ce5bd741080980f0f51979adb31ad8]
-   PD  [Univariate Data Series] [Productie tabak] [2008-10-19 14:02:13] [ed2ba3b6182103c15c0ab511ae4e6284]
F RMPD      [Univariate Explorative Data Analysis] [blog tabak EDA uni] [2008-10-27 20:01:06] [a8228479d4547a92e2d3f176a5299609] [Current]
F RM          [Tukey lambda PPCC Plot] [blog symmetrisch] [2008-10-27 20:11:50] [ed2ba3b6182103c15c0ab511ae4e6284]
- RM D          [Harrell-Davis Quantiles] [betrouwbaarheidin...] [2008-10-27 20:22:12] [ed2ba3b6182103c15c0ab511ae4e6284]
Feedback Forum
2008-10-29 14:37:11 [Tom Ardies] [reply
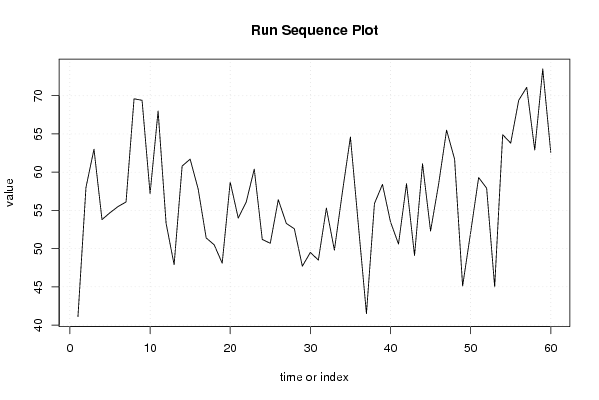
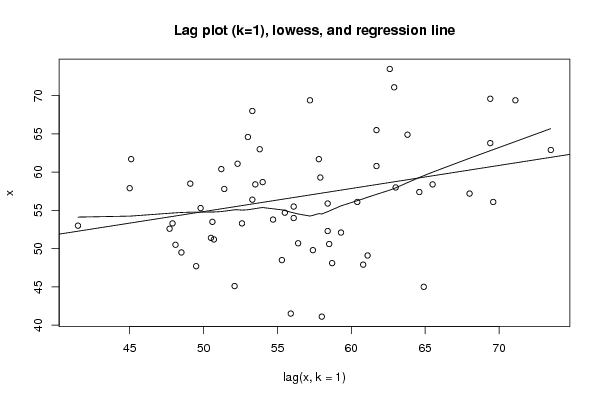
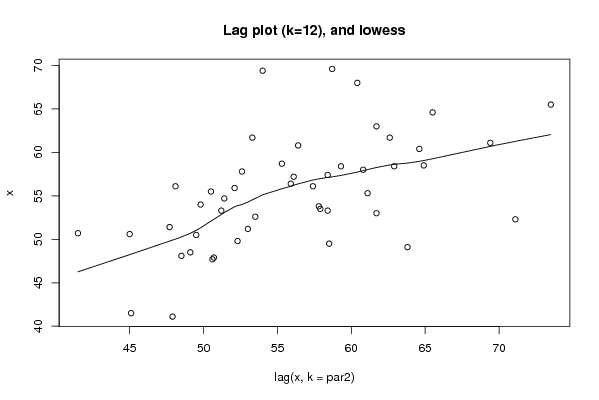
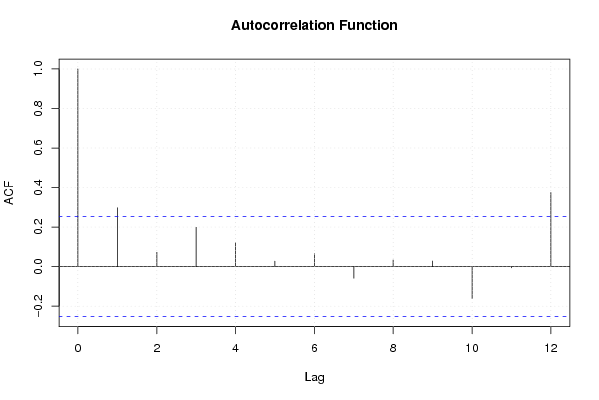
De data vertoont een stijgende lijn, dus de assumptie van een constante locatie gaat niet op voor deze tijdreeks.

Het model is niet geschikt
2008-10-29 14:40:11 [Tom Ardies] [reply
Er staat een voetnoot achter 0,99… , zie hier http://www.freestatistics.org/blog/index.php?v=date/2008/Oct/27/t1225138432q2t2l5yracfe02c.htm/

De analyse klopt volgens mij.
2008-11-01 12:46:30 [Matthieu Blondeau] [reply
Er is inderdaad een stijgende lijn terug te vinden.
2008-11-03 09:11:40 [Jeroen Michel] [reply
Er is inderdaad een stijgend patroon waar te nemen. Voor je tweede stelling geef je, in functie van je feedback, wel een foutieve link weer.
2008-11-03 09:14:20 [Jeroen Michel] [reply
Voor Q8, Q9 & Q10 verwijs je inderdaad naar deze link. Je vaststellingen zijn hier inderdaad op waar te nemen. Wel was het aan te raden dat je voor elke vraag specifiek naar een bepaalde grafiek verwees onder de bijgevoede link en niet alleen naar de link.
2008-11-03 19:34:57 [Joris Deboel] [reply
De analyse klopt inderdaad maar ik moet mijn collega's bijstaan en zeggen dat de overzichtelijkheid een beetje verloren gaat.
2008-11-03 22:01:41 [Bart Haemels] [reply
Voor een stijgend patroon is het model niet geschikt

Post a new message
Dataseries X:
41.1
58
63
53.8
54.7
55.5
56.1
69.6
69.4
57.2
68
53.3
47.9
60.8
61.7
57.8
51.4
50.5
48.1
58.7
54
56.1
60.4
51.2
50.7
56.4
53.3
52.6
47.7
49.5
48.5
55.3
49.8
57.4
64.6
53
41.5
55.9
58.4
53.5
50.6
58.5
49.1
61.1
52.3
58.4
65.5
61.7
45.1
52.1
59.3
57.9
45
64.9
63.8
69.4
71.1
62.9
73.5
62.6


Summary of computational transaction
Raw Inputview raw input (R code)
Raw Outputview raw output of R engine
Computing time4 seconds
R Server'Herman Ole Andreas Wold' @ 193.190.124.10:1001

\begin{tabular}{lllllllll}
\hline
Summary of computational transaction \tabularnewline
Raw Input & view raw input (R code)  \tabularnewline
Raw Output & view raw output of R engine  \tabularnewline
Computing time & 4 seconds \tabularnewline
R Server & 'Herman Ole Andreas Wold' @ 193.190.124.10:1001 \tabularnewline
\hline
\end{tabular}
%Source: https://freestatistics.org/blog/index.php?pk=19539&T=0

[TABLE]
[ROW][C]Summary of computational transaction[/C][/ROW]
[ROW][C]Raw Input[/C][C]view raw input (R code) [/C][/ROW]
[ROW][C]Raw Output[/C][C]view raw output of R engine [/C][/ROW]
[ROW][C]Computing time[/C][C]4 seconds[/C][/ROW]
[ROW][C]R Server[/C][C]'Herman Ole Andreas Wold' @ 193.190.124.10:1001[/C][/ROW]
[/TABLE]
Source: https://freestatistics.org/blog/index.php?pk=19539&T=0

Globally Unique Identifier (entire table): ba.freestatistics.org/blog/index.php?pk=19539&T=0

As an alternative you can also use a QR Code:  

The GUIDs for individual cells are displayed in the table below:

Summary of computational transaction
Raw Inputview raw input (R code)
Raw Outputview raw output of R engine
Computing time4 seconds
R Server'Herman Ole Andreas Wold' @ 193.190.124.10:1001


Descriptive Statistics
# observations60
minimum41.1
Q151.35
median56.1
mean56.52
Q361.25
maximum73.5

\begin{tabular}{lllllllll}
\hline
Descriptive Statistics \tabularnewline
# observations & 60 \tabularnewline
minimum & 41.1 \tabularnewline
Q1 & 51.35 \tabularnewline
median & 56.1 \tabularnewline
mean & 56.52 \tabularnewline
Q3 & 61.25 \tabularnewline
maximum & 73.5 \tabularnewline
\hline
\end{tabular}
%Source: https://freestatistics.org/blog/index.php?pk=19539&T=1

[TABLE]
[ROW][C]Descriptive Statistics[/C][/ROW]
[ROW][C]# observations[/C][C]60[/C][/ROW]
[ROW][C]minimum[/C][C]41.1[/C][/ROW]
[ROW][C]Q1[/C][C]51.35[/C][/ROW]
[ROW][C]median[/C][C]56.1[/C][/ROW]
[ROW][C]mean[/C][C]56.52[/C][/ROW]
[ROW][C]Q3[/C][C]61.25[/C][/ROW]
[ROW][C]maximum[/C][C]73.5[/C][/ROW]
[/TABLE]
Source: https://freestatistics.org/blog/index.php?pk=19539&T=1

Globally Unique Identifier (entire table): ba.freestatistics.org/blog/index.php?pk=19539&T=1

As an alternative you can also use a QR Code:  

The GUIDs for individual cells are displayed in the table below:

Descriptive Statistics
# observations60
minimum41.1
Q151.35
median56.1
mean56.52
Q361.25
maximum73.5


Parameters (Session):
par1 = 0 ; par2 = 12 ;
Parameters (R input):
par1 = 0 ; par2 = 12 ;
R code (references can be found in the software module):
par1 <- as.numeric(par1)
par2 <- as.numeric(par2)
x <- as.ts(x)
library(lattice)
bitmap(file='pic1.png')
plot(x,type='l',main='Run Sequence Plot',xlab='time or index',ylab='value')
grid()
dev.off()
bitmap(file='pic2.png')
hist(x)
grid()
dev.off()
bitmap(file='pic3.png')
if (par1 > 0)
{
densityplot(~x,col='black',main=paste('Density Plot bw = ',par1),bw=par1)
} else {
densityplot(~x,col='black',main='Density Plot')
}
dev.off()
bitmap(file='pic4.png')
qqnorm(x)
qqline(x)
grid()
dev.off()
if (par2 > 0)
{
bitmap(file='lagplot1.png')
dum <- cbind(lag(x,k=1),x)
dum
dum1 <- dum[2:length(x),]
dum1
z <- as.data.frame(dum1)
z
plot(z,main='Lag plot (k=1), lowess, and regression line')
lines(lowess(z))
abline(lm(z))
dev.off()
if (par2 > 1) {
bitmap(file='lagplotpar2.png')
dum <- cbind(lag(x,k=par2),x)
dum
dum1 <- dum[(par2+1):length(x),]
dum1
z <- as.data.frame(dum1)
z
mylagtitle <- 'Lag plot (k='
mylagtitle <- paste(mylagtitle,par2,sep='')
mylagtitle <- paste(mylagtitle,'), and lowess',sep='')
plot(z,main=mylagtitle)
lines(lowess(z))
dev.off()
}
bitmap(file='pic5.png')
acf(x,lag.max=par2,main='Autocorrelation Function')
grid()
dev.off()
}
summary(x)
load(file='createtable')
a<-table.start()
a<-table.row.start(a)
a<-table.element(a,'Descriptive Statistics',2,TRUE)
a<-table.row.end(a)
a<-table.row.start(a)
a<-table.element(a,'# observations',header=TRUE)
a<-table.element(a,length(x))
a<-table.row.end(a)
a<-table.row.start(a)
a<-table.element(a,'minimum',header=TRUE)
a<-table.element(a,min(x))
a<-table.row.end(a)
a<-table.row.start(a)
a<-table.element(a,'Q1',header=TRUE)
a<-table.element(a,quantile(x,0.25))
a<-table.row.end(a)
a<-table.row.start(a)
a<-table.element(a,'median',header=TRUE)
a<-table.element(a,median(x))
a<-table.row.end(a)
a<-table.row.start(a)
a<-table.element(a,'mean',header=TRUE)
a<-table.element(a,mean(x))
a<-table.row.end(a)
a<-table.row.start(a)
a<-table.element(a,'Q3',header=TRUE)
a<-table.element(a,quantile(x,0.75))
a<-table.row.end(a)
a<-table.row.start(a)
a<-table.element(a,'maximum',header=TRUE)
a<-table.element(a,max(x))
a<-table.row.end(a)
a<-table.end(a)
table.save(a,file='mytable.tab')