Free Statistics

of Irreproducible Research!

Author's title

Author*The author of this computation has been verified*
R Software Modulerwasp_edauni.wasp
Title produced by softwareUnivariate Explorative Data Analysis
Date of computationMon, 27 Oct 2008 13:42:47 -0600
Cite this page as followsStatistical Computations at FreeStatistics.org, Office for Research Development and Education, URL https://freestatistics.org/blog/index.php?v=date/2008/Oct/27/t1225136605tq8vjtecvq4nr4s.htm/, Retrieved Sun, 19 May 2024 12:57:30 +0000
Statistical Computations at FreeStatistics.org, Office for Research Development and Education, URL https://freestatistics.org/blog/index.php?pk=19493, Retrieved Sun, 19 May 2024 12:57:30 +0000
QR Codes:

Original text written by user:
IsPrivate?No (this computation is public)
User-defined keywords
Estimated Impact159
Family? (F = Feedback message, R = changed R code, M = changed R Module, P = changed Parameters, D = changed Data)
F     [Univariate Explorative Data Analysis] [Q2] [2008-10-25 12:32:44] [4300be8b33fd3dcdacd2aa9800ceba23]
F    D    [Univariate Explorative Data Analysis] [Q2] [2008-10-27 19:42:47] [541f63fa3157af9df10fc4d202b2a90b] [Current]
-   P       [Univariate Explorative Data Analysis] [Blog autocorrelat...] [2008-11-01 20:33:10] [ed2ba3b6182103c15c0ab511ae4e6284]
- R P       [Univariate Explorative Data Analysis] [Blog random compo...] [2008-11-01 20:36:48] [ed2ba3b6182103c15c0ab511ae4e6284]
Feedback Forum
2008-11-01 20:44:44 [Tom Ardies] [reply
Voor de autocorrelation had je de lags moeten instellen. zie link: http://www.freestatistics.org/blog/index.php?v=date/2008/Nov/01/t1225571660rq7d4cs8e7bh0iv.htm De waardes moeten binnen de stippelijnen (betrouwbaarheids interval) vallen zodat ze willekeurig zijn.

In de volgende link heb ik de random component berekend voor u door het rekenkundig gemiddelde af te trekken van de data: http://www.freestatistics.org/blog/index.php?v=date/2008/Nov/01/t1225571842qh8599ejk12jeh9.htm

De derde assumptie gaat van een stabiele trend over de tijd. Dit is niet het geval want de run sequence plot vertoon een licht dalende trend.
De vierde assumptie gaat uit van gelijke spreiding. Dit is niet het geval want in het begin is de spreiding iets groter dan nadien.
  2008-11-04 07:18:01 [Nilay Erdogdu] [reply
lags instellen op 12 of op 36

zie links

link lag:12
http://www.freestatistics.org/blog/index.php?v=date/2008/Nov/04/t1225778184i2135t1qazndkpu.htm

link lag 36
http://www.freestatistics.org/blog/index.php?v=date/2008/Nov/04/t1225777919n8ct8dnmm6wev8r.htm

  2008-11-04 07:12:15 [Nilay Erdogdu] [reply
ass 1:de berekingen door de student (Jens Peeters) op het forum zijn goed gedaan. De R code is goed aangepast en de lag is ook aangepast. Om de autocorrelatie na te gaan, moeten we naar de autocorrelation function kijken. Deze kunnen we enkel verkrijgen door de de lag op 12 of op 36 te zetten. De student had beter naar de autocorrelation function gekeken om autocorrelatie na te gaan.

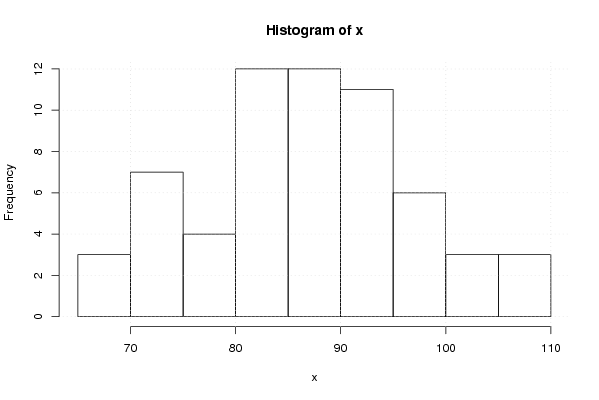
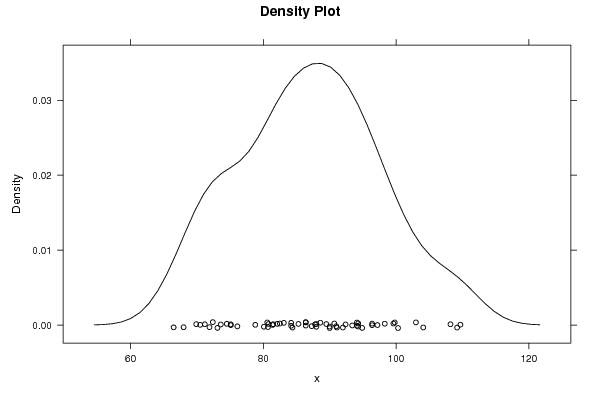
ass 2: Is the random component generated by a fixed distribution? (The model assumes a fixed distribution. De student heeft hier een juiste conclusie getrokken:buiten die enkele extreme waarden kunnen we toch vaststellen dat er sprake is van een normaalverdeling. Maar de student zegt enkel de tweede grafiek en derde grafiek te gebruiken. Om de vaste verdeling na te gaan, kunnen we de histogram, density plot en qq plot gebruiken.

ass 3:Is the deterministic component constant? (The model assumes that the distribution has a fixed location) De student keek naar de derde grafiek nl de density plot. We moeten kijken naar de run sequence plot. We zien op lange termijn een achteruitgang, op lange termijn is niveau niet constant. We kunnen ook naar de central tendency kijken. De winsorized mean geeft aan dat het gemiddelde schommelt rond de 87. Het is echter wel moeilijk te zien of het constant is.

ass 4:The random component have a fixed variation? (The model assumes a distribution with fixed variation)
De student is deze assumptie niet nagegaan. We kijken weer naar de run sequence plot. Over de tijd is er een verandering van de spreiding. We moeten de random component berekenen. Hiervoor gaan we eerst de voorspelling van de reeks aftrekken. (zie berekening Jens Peeters)
    2008-11-04 07:14:57 [Nilay Erdogdu] [reply
Voor de juiste berekeningen zie student Tom Ardies. Heb me daarnet van student vergist...

Post a new message
Dataseries X:
109.20
88.60
94.30
98.30
86.40
80.60
104.10
108.20
93.40
71.90
94.10
94.90
96.40
91.10
84.40
86.40
88.00
75.10
109.70
103.00
82.10
68.00
96.40
94.30
90.00
88.00
76.10
82.50
81.40
66.50
97.20
94.10
80.70
70.50
87.80
89.50
99.60
84.20
75.10
92.00
80.80
73.10
99.80
90.00
83.10
72.40
78.80
87.30
91.00
80.10
73.60
86.40
74.50
71.20
92.40
81.50
85.30
69.90
84.20
90.70
100.30


Summary of computational transaction
Raw Inputview raw input (R code)
Raw Outputview raw output of R engine
Computing time3 seconds
R Server'Gwilym Jenkins' @ 72.249.127.135

\begin{tabular}{lllllllll}
\hline
Summary of computational transaction \tabularnewline
Raw Input & view raw input (R code)  \tabularnewline
Raw Output & view raw output of R engine  \tabularnewline
Computing time & 3 seconds \tabularnewline
R Server & 'Gwilym Jenkins' @ 72.249.127.135 \tabularnewline
\hline
\end{tabular}
%Source: https://freestatistics.org/blog/index.php?pk=19493&T=0

[TABLE]
[ROW][C]Summary of computational transaction[/C][/ROW]
[ROW][C]Raw Input[/C][C]view raw input (R code) [/C][/ROW]
[ROW][C]Raw Output[/C][C]view raw output of R engine [/C][/ROW]
[ROW][C]Computing time[/C][C]3 seconds[/C][/ROW]
[ROW][C]R Server[/C][C]'Gwilym Jenkins' @ 72.249.127.135[/C][/ROW]
[/TABLE]
Source: https://freestatistics.org/blog/index.php?pk=19493&T=0

Globally Unique Identifier (entire table): ba.freestatistics.org/blog/index.php?pk=19493&T=0

As an alternative you can also use a QR Code:  

The GUIDs for individual cells are displayed in the table below:

Summary of computational transaction
Raw Inputview raw input (R code)
Raw Outputview raw output of R engine
Computing time3 seconds
R Server'Gwilym Jenkins' @ 72.249.127.135


Descriptive Statistics
# observations61
minimum66.5
Q180.6
median87.3
mean86.8934426229508
Q394.1
maximum109.7

\begin{tabular}{lllllllll}
\hline
Descriptive Statistics \tabularnewline
# observations & 61 \tabularnewline
minimum & 66.5 \tabularnewline
Q1 & 80.6 \tabularnewline
median & 87.3 \tabularnewline
mean & 86.8934426229508 \tabularnewline
Q3 & 94.1 \tabularnewline
maximum & 109.7 \tabularnewline
\hline
\end{tabular}
%Source: https://freestatistics.org/blog/index.php?pk=19493&T=1

[TABLE]
[ROW][C]Descriptive Statistics[/C][/ROW]
[ROW][C]# observations[/C][C]61[/C][/ROW]
[ROW][C]minimum[/C][C]66.5[/C][/ROW]
[ROW][C]Q1[/C][C]80.6[/C][/ROW]
[ROW][C]median[/C][C]87.3[/C][/ROW]
[ROW][C]mean[/C][C]86.8934426229508[/C][/ROW]
[ROW][C]Q3[/C][C]94.1[/C][/ROW]
[ROW][C]maximum[/C][C]109.7[/C][/ROW]
[/TABLE]
Source: https://freestatistics.org/blog/index.php?pk=19493&T=1

Globally Unique Identifier (entire table): ba.freestatistics.org/blog/index.php?pk=19493&T=1

As an alternative you can also use a QR Code:  

The GUIDs for individual cells are displayed in the table below:

Descriptive Statistics
# observations61
minimum66.5
Q180.6
median87.3
mean86.8934426229508
Q394.1
maximum109.7


Parameters (Session):
par1 = 0 ; par2 = 0 ;
Parameters (R input):
par1 = 0 ; par2 = 0 ;
R code (references can be found in the software module):
par1 <- as.numeric(par1)
par2 <- as.numeric(par2)
x <- as.ts(x)
library(lattice)
bitmap(file='pic1.png')
plot(x,type='l',main='Run Sequence Plot',xlab='time or index',ylab='value')
grid()
dev.off()
bitmap(file='pic2.png')
hist(x)
grid()
dev.off()
bitmap(file='pic3.png')
if (par1 > 0)
{
densityplot(~x,col='black',main=paste('Density Plot bw = ',par1),bw=par1)
} else {
densityplot(~x,col='black',main='Density Plot')
}
dev.off()
bitmap(file='pic4.png')
qqnorm(x)
qqline(x)
grid()
dev.off()
if (par2 > 0)
{
bitmap(file='lagplot1.png')
dum <- cbind(lag(x,k=1),x)
dum
dum1 <- dum[2:length(x),]
dum1
z <- as.data.frame(dum1)
z
plot(z,main='Lag plot (k=1), lowess, and regression line')
lines(lowess(z))
abline(lm(z))
dev.off()
if (par2 > 1) {
bitmap(file='lagplotpar2.png')
dum <- cbind(lag(x,k=par2),x)
dum
dum1 <- dum[(par2+1):length(x),]
dum1
z <- as.data.frame(dum1)
z
mylagtitle <- 'Lag plot (k='
mylagtitle <- paste(mylagtitle,par2,sep='')
mylagtitle <- paste(mylagtitle,'), and lowess',sep='')
plot(z,main=mylagtitle)
lines(lowess(z))
dev.off()
}
bitmap(file='pic5.png')
acf(x,lag.max=par2,main='Autocorrelation Function')
grid()
dev.off()
}
summary(x)
load(file='createtable')
a<-table.start()
a<-table.row.start(a)
a<-table.element(a,'Descriptive Statistics',2,TRUE)
a<-table.row.end(a)
a<-table.row.start(a)
a<-table.element(a,'# observations',header=TRUE)
a<-table.element(a,length(x))
a<-table.row.end(a)
a<-table.row.start(a)
a<-table.element(a,'minimum',header=TRUE)
a<-table.element(a,min(x))
a<-table.row.end(a)
a<-table.row.start(a)
a<-table.element(a,'Q1',header=TRUE)
a<-table.element(a,quantile(x,0.25))
a<-table.row.end(a)
a<-table.row.start(a)
a<-table.element(a,'median',header=TRUE)
a<-table.element(a,median(x))
a<-table.row.end(a)
a<-table.row.start(a)
a<-table.element(a,'mean',header=TRUE)
a<-table.element(a,mean(x))
a<-table.row.end(a)
a<-table.row.start(a)
a<-table.element(a,'Q3',header=TRUE)
a<-table.element(a,quantile(x,0.75))
a<-table.row.end(a)
a<-table.row.start(a)
a<-table.element(a,'maximum',header=TRUE)
a<-table.element(a,max(x))
a<-table.row.end(a)
a<-table.end(a)
table.save(a,file='mytable.tab')