Free Statistics

of Irreproducible Research!

Author's title

Author*The author of this computation has been verified*
R Software Modulerwasp_autocorrelation.wasp
Title produced by software(Partial) Autocorrelation Function
Date of computationMon, 27 Oct 2008 13:03:35 -0600
Cite this page as followsStatistical Computations at FreeStatistics.org, Office for Research Development and Education, URL https://freestatistics.org/blog/index.php?v=date/2008/Oct/27/t1225134283coggnmu9vqcpeyb.htm/, Retrieved Sun, 19 May 2024 13:18:29 +0000
Statistical Computations at FreeStatistics.org, Office for Research Development and Education, URL https://freestatistics.org/blog/index.php?pk=19417, Retrieved Sun, 19 May 2024 13:18:29 +0000
QR Codes:

Original text written by user:
IsPrivate?No (this computation is public)
User-defined keywords
Estimated Impact148
Family? (F = Feedback message, R = changed R code, M = changed R Module, P = changed Parameters, D = changed Data)
F     [Univariate Explorative Data Analysis] [Investigation Dis...] [2007-10-21 17:06:37] [b9964c45117f7aac638ab9056d451faa]
F RMPD  [(Partial) Autocorrelation Function] [Q4] [2008-10-23 10:50:20] [28075c6928548bea087cb2be962cfe7e]
F           [(Partial) Autocorrelation Function] [Investigation Dis...] [2008-10-27 19:03:35] [3bb0537fcae9c337e49b9ce75ff3d4da] [Current]
Feedback Forum
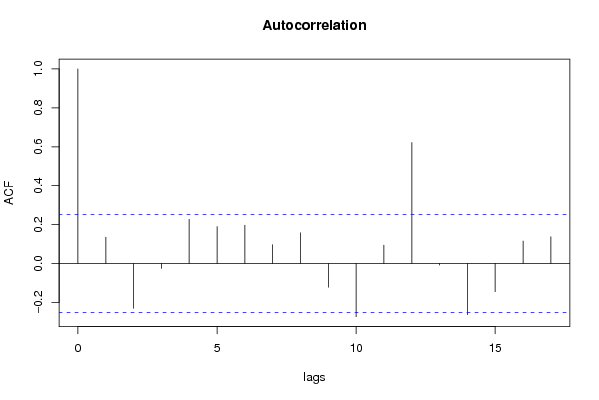
2008-10-31 15:55:13 [Bob Leysen] [reply
Geen correcte grafiek.

Met onderstaande link kan je de grafiek van de autocorrelatie bekijken. http://www.freestatistics.org/blog/index.php?v=date/2008/Oct/30/t12253728791frueq4z3rg1624.htm
Dit is beter voor de seasoniliteit af te lezen. De pieken boven de 95% betrouwbaarheidsinterval wijzen op seasonaliteit.
2008-11-03 17:37:32 [Dries Van Gheluwe] [reply
Er is hier inderdaad een conclusie getrokken aan de hand van de verkeerde grafiek. Je moest kijken naar het lag plot dat we ook berekend hebben in oefening Q2. Er is hier sprake van een kleine seizonaliteit maar die is moeilijk op te sporen.

Post a new message
Dataseries X:
109.20
88.60
94.30
98.30
86.40
80.60
104.10
108.20
93.40
71.90
94.10
94.90
96.40
91.10
84.40
86.40
88.00
75.10
109.70
103.00
82.10
68.00
96.40
94.30
90.00
88.00
76.10
82.50
81.40
66.50
97.20
94.10
80.70
70.50
87.80
89.50
99.60
84.20
75.10
92.00
80.80
73.10
99.80
90.00
83.10
72.40
78.80
87.30
91.00
80.10
73.60
86.40
74.50
71.20
92.40
81.50
85.30
69.90
84.20
90.70
100.30


Summary of computational transaction
Raw Inputview raw input (R code)
Raw Outputview raw output of R engine
Computing time2 seconds
R Server'Herman Ole Andreas Wold' @ 193.190.124.10:1001

\begin{tabular}{lllllllll}
\hline
Summary of computational transaction \tabularnewline
Raw Input & view raw input (R code)  \tabularnewline
Raw Output & view raw output of R engine  \tabularnewline
Computing time & 2 seconds \tabularnewline
R Server & 'Herman Ole Andreas Wold' @ 193.190.124.10:1001 \tabularnewline
\hline
\end{tabular}
%Source: https://freestatistics.org/blog/index.php?pk=19417&T=0

[TABLE]
[ROW][C]Summary of computational transaction[/C][/ROW]
[ROW][C]Raw Input[/C][C]view raw input (R code) [/C][/ROW]
[ROW][C]Raw Output[/C][C]view raw output of R engine [/C][/ROW]
[ROW][C]Computing time[/C][C]2 seconds[/C][/ROW]
[ROW][C]R Server[/C][C]'Herman Ole Andreas Wold' @ 193.190.124.10:1001[/C][/ROW]
[/TABLE]
Source: https://freestatistics.org/blog/index.php?pk=19417&T=0

Globally Unique Identifier (entire table): ba.freestatistics.org/blog/index.php?pk=19417&T=0

As an alternative you can also use a QR Code:  

The GUIDs for individual cells are displayed in the table below:

Summary of computational transaction
Raw Inputview raw input (R code)
Raw Outputview raw output of R engine
Computing time2 seconds
R Server'Herman Ole Andreas Wold' @ 193.190.124.10:1001


Autocorrelation Function
Time lag kACF(k)T-STATP-value
10.1348681.05340.148167
2-0.230388-1.79940.038452
3-0.025856-0.20190.420317
40.2268231.77150.040733
50.1893471.47880.072164
60.1969711.53840.064562
70.0967310.75550.226431
80.1573531.2290.111903
9-0.121757-0.9510.172691
10-0.273532-2.13640.018336
110.0938150.73270.233269
120.6218644.85694e-06
13-0.008279-0.06470.474327
14-0.26372-2.05970.02185
15-0.145361-1.13530.130345
160.1151760.89960.185948
170.1370871.07070.144266

\begin{tabular}{lllllllll}
\hline
Autocorrelation Function \tabularnewline
Time lag k & ACF(k) & T-STAT & P-value \tabularnewline
1 & 0.134868 & 1.0534 & 0.148167 \tabularnewline
2 & -0.230388 & -1.7994 & 0.038452 \tabularnewline
3 & -0.025856 & -0.2019 & 0.420317 \tabularnewline
4 & 0.226823 & 1.7715 & 0.040733 \tabularnewline
5 & 0.189347 & 1.4788 & 0.072164 \tabularnewline
6 & 0.196971 & 1.5384 & 0.064562 \tabularnewline
7 & 0.096731 & 0.7555 & 0.226431 \tabularnewline
8 & 0.157353 & 1.229 & 0.111903 \tabularnewline
9 & -0.121757 & -0.951 & 0.172691 \tabularnewline
10 & -0.273532 & -2.1364 & 0.018336 \tabularnewline
11 & 0.093815 & 0.7327 & 0.233269 \tabularnewline
12 & 0.621864 & 4.8569 & 4e-06 \tabularnewline
13 & -0.008279 & -0.0647 & 0.474327 \tabularnewline
14 & -0.26372 & -2.0597 & 0.02185 \tabularnewline
15 & -0.145361 & -1.1353 & 0.130345 \tabularnewline
16 & 0.115176 & 0.8996 & 0.185948 \tabularnewline
17 & 0.137087 & 1.0707 & 0.144266 \tabularnewline
\hline
\end{tabular}
%Source: https://freestatistics.org/blog/index.php?pk=19417&T=1

[TABLE]
[ROW][C]Autocorrelation Function[/C][/ROW]
[ROW][C]Time lag k[/C][C]ACF(k)[/C][C]T-STAT[/C][C]P-value[/C][/ROW]
[ROW][C]1[/C][C]0.134868[/C][C]1.0534[/C][C]0.148167[/C][/ROW]
[ROW][C]2[/C][C]-0.230388[/C][C]-1.7994[/C][C]0.038452[/C][/ROW]
[ROW][C]3[/C][C]-0.025856[/C][C]-0.2019[/C][C]0.420317[/C][/ROW]
[ROW][C]4[/C][C]0.226823[/C][C]1.7715[/C][C]0.040733[/C][/ROW]
[ROW][C]5[/C][C]0.189347[/C][C]1.4788[/C][C]0.072164[/C][/ROW]
[ROW][C]6[/C][C]0.196971[/C][C]1.5384[/C][C]0.064562[/C][/ROW]
[ROW][C]7[/C][C]0.096731[/C][C]0.7555[/C][C]0.226431[/C][/ROW]
[ROW][C]8[/C][C]0.157353[/C][C]1.229[/C][C]0.111903[/C][/ROW]
[ROW][C]9[/C][C]-0.121757[/C][C]-0.951[/C][C]0.172691[/C][/ROW]
[ROW][C]10[/C][C]-0.273532[/C][C]-2.1364[/C][C]0.018336[/C][/ROW]
[ROW][C]11[/C][C]0.093815[/C][C]0.7327[/C][C]0.233269[/C][/ROW]
[ROW][C]12[/C][C]0.621864[/C][C]4.8569[/C][C]4e-06[/C][/ROW]
[ROW][C]13[/C][C]-0.008279[/C][C]-0.0647[/C][C]0.474327[/C][/ROW]
[ROW][C]14[/C][C]-0.26372[/C][C]-2.0597[/C][C]0.02185[/C][/ROW]
[ROW][C]15[/C][C]-0.145361[/C][C]-1.1353[/C][C]0.130345[/C][/ROW]
[ROW][C]16[/C][C]0.115176[/C][C]0.8996[/C][C]0.185948[/C][/ROW]
[ROW][C]17[/C][C]0.137087[/C][C]1.0707[/C][C]0.144266[/C][/ROW]
[/TABLE]
Source: https://freestatistics.org/blog/index.php?pk=19417&T=1

Globally Unique Identifier (entire table): ba.freestatistics.org/blog/index.php?pk=19417&T=1

As an alternative you can also use a QR Code:  

The GUIDs for individual cells are displayed in the table below:

Autocorrelation Function
Time lag kACF(k)T-STATP-value
10.1348681.05340.148167
2-0.230388-1.79940.038452
3-0.025856-0.20190.420317
40.2268231.77150.040733
50.1893471.47880.072164
60.1969711.53840.064562
70.0967310.75550.226431
80.1573531.2290.111903
9-0.121757-0.9510.172691
10-0.273532-2.13640.018336
110.0938150.73270.233269
120.6218644.85694e-06
13-0.008279-0.06470.474327
14-0.26372-2.05970.02185
15-0.145361-1.13530.130345
160.1151760.89960.185948
170.1370871.07070.144266


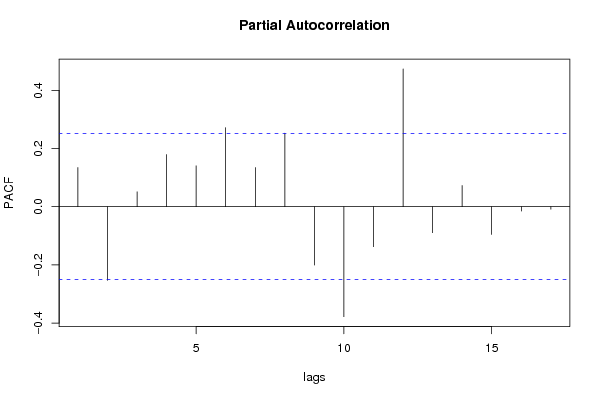
Partial Autocorrelation Function
Time lag kPACF(k)T-STATP-value
10.1348681.05340.148167
2-0.253183-1.97740.026259
30.0513990.40140.344751
40.1792421.39990.083301
50.1406331.09840.138178
60.2718562.12330.018899
70.1344911.05040.148838
80.2529031.97520.026385
9-0.200811-1.56840.060983
10-0.378002-2.95230.002236
11-0.137616-1.07480.143345
120.4737473.70010.000232
13-0.089353-0.69790.243955
140.0727080.56790.286104
15-0.09552-0.7460.229255
16-0.014972-0.11690.453649
17-0.008653-0.06760.473169

\begin{tabular}{lllllllll}
\hline
Partial Autocorrelation Function \tabularnewline
Time lag k & PACF(k) & T-STAT & P-value \tabularnewline
1 & 0.134868 & 1.0534 & 0.148167 \tabularnewline
2 & -0.253183 & -1.9774 & 0.026259 \tabularnewline
3 & 0.051399 & 0.4014 & 0.344751 \tabularnewline
4 & 0.179242 & 1.3999 & 0.083301 \tabularnewline
5 & 0.140633 & 1.0984 & 0.138178 \tabularnewline
6 & 0.271856 & 2.1233 & 0.018899 \tabularnewline
7 & 0.134491 & 1.0504 & 0.148838 \tabularnewline
8 & 0.252903 & 1.9752 & 0.026385 \tabularnewline
9 & -0.200811 & -1.5684 & 0.060983 \tabularnewline
10 & -0.378002 & -2.9523 & 0.002236 \tabularnewline
11 & -0.137616 & -1.0748 & 0.143345 \tabularnewline
12 & 0.473747 & 3.7001 & 0.000232 \tabularnewline
13 & -0.089353 & -0.6979 & 0.243955 \tabularnewline
14 & 0.072708 & 0.5679 & 0.286104 \tabularnewline
15 & -0.09552 & -0.746 & 0.229255 \tabularnewline
16 & -0.014972 & -0.1169 & 0.453649 \tabularnewline
17 & -0.008653 & -0.0676 & 0.473169 \tabularnewline
\hline
\end{tabular}
%Source: https://freestatistics.org/blog/index.php?pk=19417&T=2

[TABLE]
[ROW][C]Partial Autocorrelation Function[/C][/ROW]
[ROW][C]Time lag k[/C][C]PACF(k)[/C][C]T-STAT[/C][C]P-value[/C][/ROW]
[ROW][C]1[/C][C]0.134868[/C][C]1.0534[/C][C]0.148167[/C][/ROW]
[ROW][C]2[/C][C]-0.253183[/C][C]-1.9774[/C][C]0.026259[/C][/ROW]
[ROW][C]3[/C][C]0.051399[/C][C]0.4014[/C][C]0.344751[/C][/ROW]
[ROW][C]4[/C][C]0.179242[/C][C]1.3999[/C][C]0.083301[/C][/ROW]
[ROW][C]5[/C][C]0.140633[/C][C]1.0984[/C][C]0.138178[/C][/ROW]
[ROW][C]6[/C][C]0.271856[/C][C]2.1233[/C][C]0.018899[/C][/ROW]
[ROW][C]7[/C][C]0.134491[/C][C]1.0504[/C][C]0.148838[/C][/ROW]
[ROW][C]8[/C][C]0.252903[/C][C]1.9752[/C][C]0.026385[/C][/ROW]
[ROW][C]9[/C][C]-0.200811[/C][C]-1.5684[/C][C]0.060983[/C][/ROW]
[ROW][C]10[/C][C]-0.378002[/C][C]-2.9523[/C][C]0.002236[/C][/ROW]
[ROW][C]11[/C][C]-0.137616[/C][C]-1.0748[/C][C]0.143345[/C][/ROW]
[ROW][C]12[/C][C]0.473747[/C][C]3.7001[/C][C]0.000232[/C][/ROW]
[ROW][C]13[/C][C]-0.089353[/C][C]-0.6979[/C][C]0.243955[/C][/ROW]
[ROW][C]14[/C][C]0.072708[/C][C]0.5679[/C][C]0.286104[/C][/ROW]
[ROW][C]15[/C][C]-0.09552[/C][C]-0.746[/C][C]0.229255[/C][/ROW]
[ROW][C]16[/C][C]-0.014972[/C][C]-0.1169[/C][C]0.453649[/C][/ROW]
[ROW][C]17[/C][C]-0.008653[/C][C]-0.0676[/C][C]0.473169[/C][/ROW]
[/TABLE]
Source: https://freestatistics.org/blog/index.php?pk=19417&T=2

Globally Unique Identifier (entire table): ba.freestatistics.org/blog/index.php?pk=19417&T=2

As an alternative you can also use a QR Code:  

The GUIDs for individual cells are displayed in the table below:

Partial Autocorrelation Function
Time lag kPACF(k)T-STATP-value
10.1348681.05340.148167
2-0.253183-1.97740.026259
30.0513990.40140.344751
40.1792421.39990.083301
50.1406331.09840.138178
60.2718562.12330.018899
70.1344911.05040.148838
80.2529031.97520.026385
9-0.200811-1.56840.060983
10-0.378002-2.95230.002236
11-0.137616-1.07480.143345
120.4737473.70010.000232
13-0.089353-0.69790.243955
140.0727080.56790.286104
15-0.09552-0.7460.229255
16-0.014972-0.11690.453649
17-0.008653-0.06760.473169


Parameters (Session):
par1 = Default ; par2 = 1 ; par3 = 0 ; par4 = 0 ; par5 = 12 ;
Parameters (R input):
par1 = Default ; par2 = 1 ; par3 = 0 ; par4 = 0 ; par5 = 12 ; par6 = ; par7 = ; par8 = ; par9 = ; par10 = ; par11 = ; par12 = ; par13 = ; par14 = ; par15 = ; par16 = ; par17 = ; par18 = ; par19 = ; par20 = ;
R code (references can be found in the software module):
if (par1 == 'Default') {
par1 = 10*log10(length(x))
} else {
par1 <- as.numeric(par1)
}
par2 <- as.numeric(par2)
par3 <- as.numeric(par3)
par4 <- as.numeric(par4)
par5 <- as.numeric(par5)
if (par2 == 0) {
x <- log(x)
} else {
x <- (x ^ par2 - 1) / par2
}
if (par3 > 0) x <- diff(x,lag=1,difference=par3)
if (par4 > 0) x <- diff(x,lag=par5,difference=par4)
bitmap(file='pic1.png')
racf <- acf(x,par1,main='Autocorrelation',xlab='lags',ylab='ACF')
dev.off()
bitmap(file='pic2.png')
rpacf <- pacf(x,par1,main='Partial Autocorrelation',xlab='lags',ylab='PACF')
dev.off()
(myacf <- c(racf$acf))
(mypacf <- c(rpacf$acf))
lengthx <- length(x)
sqrtn <- sqrt(lengthx)
load(file='createtable')
a<-table.start()
a<-table.row.start(a)
a<-table.element(a,'Autocorrelation Function',4,TRUE)
a<-table.row.end(a)
a<-table.row.start(a)
a<-table.element(a,'Time lag k',header=TRUE)
a<-table.element(a,hyperlink('basics.htm','ACF(k)','click here for more information about the Autocorrelation Function'),header=TRUE)
a<-table.element(a,'T-STAT',header=TRUE)
a<-table.element(a,'P-value',header=TRUE)
a<-table.row.end(a)
for (i in 2:(par1+1)) {
a<-table.row.start(a)
a<-table.element(a,i-1,header=TRUE)
a<-table.element(a,round(myacf[i],6))
mytstat <- myacf[i]*sqrtn
a<-table.element(a,round(mytstat,4))
a<-table.element(a,round(1-pt(abs(mytstat),lengthx),6))
a<-table.row.end(a)
}
a<-table.end(a)
table.save(a,file='mytable.tab')
a<-table.start()
a<-table.row.start(a)
a<-table.element(a,'Partial Autocorrelation Function',4,TRUE)
a<-table.row.end(a)
a<-table.row.start(a)
a<-table.element(a,'Time lag k',header=TRUE)
a<-table.element(a,hyperlink('basics.htm','PACF(k)','click here for more information about the Partial Autocorrelation Function'),header=TRUE)
a<-table.element(a,'T-STAT',header=TRUE)
a<-table.element(a,'P-value',header=TRUE)
a<-table.row.end(a)
for (i in 1:par1) {
a<-table.row.start(a)
a<-table.element(a,i,header=TRUE)
a<-table.element(a,round(mypacf[i],6))
mytstat <- mypacf[i]*sqrtn
a<-table.element(a,round(mytstat,4))
a<-table.element(a,round(1-pt(abs(mytstat),lengthx),6))
a<-table.row.end(a)
}
a<-table.end(a)
table.save(a,file='mytable1.tab')