Free Statistics
of Irreproducible Research!
Description of Statistical Computation | |||||||||||||||||||||||||||||||||||||||||
|---|---|---|---|---|---|---|---|---|---|---|---|---|---|---|---|---|---|---|---|---|---|---|---|---|---|---|---|---|---|---|---|---|---|---|---|---|---|---|---|---|---|
| Author's title | |||||||||||||||||||||||||||||||||||||||||
| Author | *The author of this computation has been verified* | ||||||||||||||||||||||||||||||||||||||||
| R Software Module | rwasp_univariatedataseries.wasp | ||||||||||||||||||||||||||||||||||||||||
| Title produced by software | Univariate Data Series | ||||||||||||||||||||||||||||||||||||||||
| Date of computation | Mon, 27 Oct 2008 11:19:11 -0600 | ||||||||||||||||||||||||||||||||||||||||
| Cite this page as follows | Statistical Computations at FreeStatistics.org, Office for Research Development and Education, URL https://freestatistics.org/blog/index.php?v=date/2008/Oct/27/t1225127973l7tdyutypcgeaji.htm/, Retrieved Sun, 19 May 2024 14:43:50 +0000 | ||||||||||||||||||||||||||||||||||||||||
| Statistical Computations at FreeStatistics.org, Office for Research Development and Education, URL https://freestatistics.org/blog/index.php?pk=19285, Retrieved Sun, 19 May 2024 14:43:50 +0000 | |||||||||||||||||||||||||||||||||||||||||
| QR Codes: | |||||||||||||||||||||||||||||||||||||||||
|
| |||||||||||||||||||||||||||||||||||||||||
| Original text written by user: | |||||||||||||||||||||||||||||||||||||||||
| IsPrivate? | No (this computation is public) | ||||||||||||||||||||||||||||||||||||||||
| User-defined keywords | |||||||||||||||||||||||||||||||||||||||||
| Estimated Impact | 155 | ||||||||||||||||||||||||||||||||||||||||
Tree of Dependent Computations | |||||||||||||||||||||||||||||||||||||||||
| Family? (F = Feedback message, R = changed R code, M = changed R Module, P = changed Parameters, D = changed Data) | |||||||||||||||||||||||||||||||||||||||||
| - [Univariate Data Series] [Wisselkoers Dolla...] [2008-10-13 22:35:46] [bd51eba1292ec8d03a55225bfbdeaf98] - PD [Univariate Data Series] [Tijdreeks Bouwpro...] [2008-10-27 17:14:08] [b85eb1eb4b13b870c6e7ebbba3e34fcc] - PD [Univariate Data Series] [Tijdreeks aantal ...] [2008-10-27 17:16:45] [b85eb1eb4b13b870c6e7ebbba3e34fcc] - PD [Univariate Data Series] [Tijdreeks werkloo...] [2008-10-27 17:19:11] [b5110a3ab194da7214bdf478e0a05dbd] [Current] - PD [Univariate Data Series] [Tijdreeks LT rent...] [2008-10-27 17:20:56] [b85eb1eb4b13b870c6e7ebbba3e34fcc] | |||||||||||||||||||||||||||||||||||||||||
| Feedback Forum | |||||||||||||||||||||||||||||||||||||||||
Post a new message | |||||||||||||||||||||||||||||||||||||||||
Dataset | |||||||||||||||||||||||||||||||||||||||||
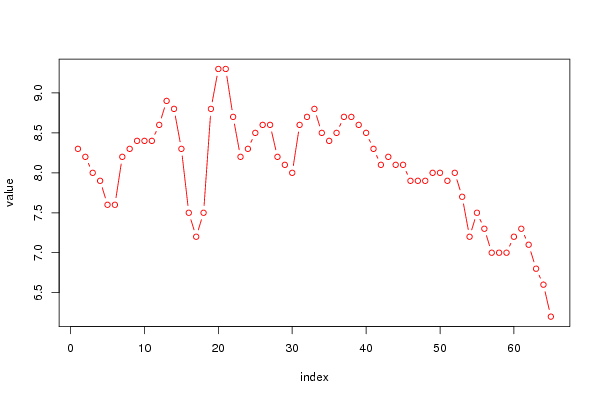
| Dataseries X: | |||||||||||||||||||||||||||||||||||||||||
8.3 8.2 8 7.9 7.6 7.6 8.2 8.3 8.4 8.4 8.4 8.6 8.9 8.8 8.3 7.5 7.2 7.5 8.8 9.3 9.3 8.7 8.2 8.3 8.5 8.6 8.6 8.2 8.1 8 8.6 8.7 8.8 8.5 8.4 8.5 8.7 8.7 8.6 8.5 8.3 8.1 8.2 8.1 8.1 7.9 7.9 7.9 8 8 7.9 8 7.7 7.2 7.5 7.3 7 7 7 7.2 7.3 7.1 6.8 6.6 6.2 | |||||||||||||||||||||||||||||||||||||||||
Tables (Output of Computation) | |||||||||||||||||||||||||||||||||||||||||
| |||||||||||||||||||||||||||||||||||||||||
Figures (Output of Computation) | |||||||||||||||||||||||||||||||||||||||||
Input Parameters & R Code | |||||||||||||||||||||||||||||||||||||||||
| Parameters (Session): | |||||||||||||||||||||||||||||||||||||||||
| par1 = Werkloosheid in % ; par2 = http://www.nbb.be/belgostat/PresentationLinker?Order=true&TableId=410000092&Lang=N&prop=null ; par3 = Werkloosheid in % ; | |||||||||||||||||||||||||||||||||||||||||
| Parameters (R input): | |||||||||||||||||||||||||||||||||||||||||
| par1 = Werkloosheid in % ; par2 = http://www.nbb.be/belgostat/PresentationLinker?Order=true&TableId=410000092&Lang=N&prop=null ; par3 = Werkloosheid in % ; | |||||||||||||||||||||||||||||||||||||||||
| R code (references can be found in the software module): | |||||||||||||||||||||||||||||||||||||||||
bitmap(file='test1.png') | |||||||||||||||||||||||||||||||||||||||||