Free Statistics

of Irreproducible Research!

Author's title

Author*The author of this computation has been verified*
R Software Modulerwasp_edauni.wasp
Title produced by softwareUnivariate Explorative Data Analysis
Date of computationMon, 27 Oct 2008 03:47:47 -0600
Cite this page as followsStatistical Computations at FreeStatistics.org, Office for Research Development and Education, URL https://freestatistics.org/blog/index.php?v=date/2008/Oct/27/t122510109796z6abyl5r37kuj.htm/, Retrieved Sun, 19 May 2024 14:56:57 +0000
Statistical Computations at FreeStatistics.org, Office for Research Development and Education, URL https://freestatistics.org/blog/index.php?pk=19150, Retrieved Sun, 19 May 2024 14:56:57 +0000
QR Codes:

Original text written by user:
IsPrivate?No (this computation is public)
User-defined keywords
Estimated Impact193
Family? (F = Feedback message, R = changed R code, M = changed R Module, P = changed Parameters, D = changed Data)
F     [Univariate Explorative Data Analysis] [Investigation Dis...] [2007-10-21 17:06:37] [b9964c45117f7aac638ab9056d451faa]
-   PD  [Univariate Explorative Data Analysis] [Q2 Assumptions] [2008-10-26 14:39:48] [cf9c64468d04c2c4dd548cc66b4e3677]
F   PD      [Univariate Explorative Data Analysis] [Q2 Assumptions] [2008-10-27 09:47:47] [e4cb5a8878d0401c2e8d19a1768b515b] [Current]
-    D        [Univariate Explorative Data Analysis] [Q7 UEDA] [2008-10-27 10:09:12] [cf9c64468d04c2c4dd548cc66b4e3677]
-   PD          [Univariate Explorative Data Analysis] [Q7 UEDA bis] [2008-10-27 10:29:45] [cf9c64468d04c2c4dd548cc66b4e3677]
F    D        [Univariate Explorative Data Analysis] [Task 2] [2008-10-27 19:09:31] [cf9c64468d04c2c4dd548cc66b4e3677]
-    D          [Univariate Explorative Data Analysis] [Task 2 Model 2] [2008-10-27 19:12:54] [cf9c64468d04c2c4dd548cc66b4e3677]
-   PD          [Univariate Explorative Data Analysis] [verbetering distr...] [2008-11-03 08:35:35] [077ffec662d24c06be4c491541a44245]
-   P         [Univariate Explorative Data Analysis] [verbetering distr...] [2008-11-03 07:45:47] [077ffec662d24c06be4c491541a44245]
Feedback Forum
2008-10-31 19:51:12 [Jan Van Riet] [reply
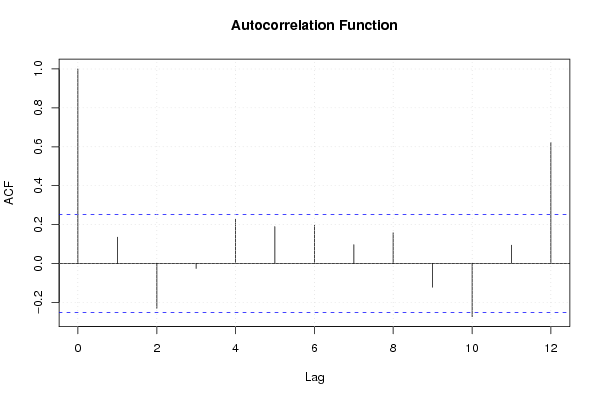
De conclusies ivm de assumpties kloppen, alleen ontbreken enkele details hier en daar.

Ivm de correlatie kunnen we besluiten dat er een zekere autocorrelatie is met seizonale betekenis. Dit valt te zien op lag 12 en lag 24. Hierdoor kunnen we een voorspelling doen over volgend jaar.
2008-10-31 19:54:22 [Jan Van Riet] [reply
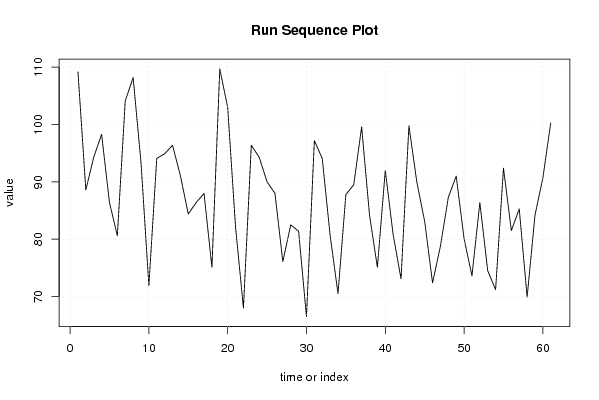
De variatie blijft niet constant, maar daalt op lange termijn. Een andere manier om dit te testen is door de central tendency plot te gebruiken.
Er is wel geen uitgesproken trend waar te nemen.

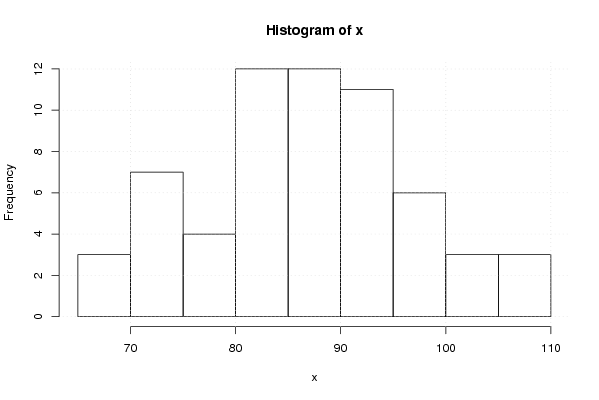
Op het histogram zien we inderdaad een normaalverdeling.

Kijken we naar de Run sequence plot, en verdelen we deze in 2 gelijke delen, dan valt onmiddellijk op dat het 1e deel verschilt van het 2e. De spreiding is dus niet constant te noemen.
2008-11-03 08:06:59 [Glenn De Maeyer] [reply
De antwoorden van de student zijn vrij correct. Er ontbreken inderdaad gewoon enkele details.

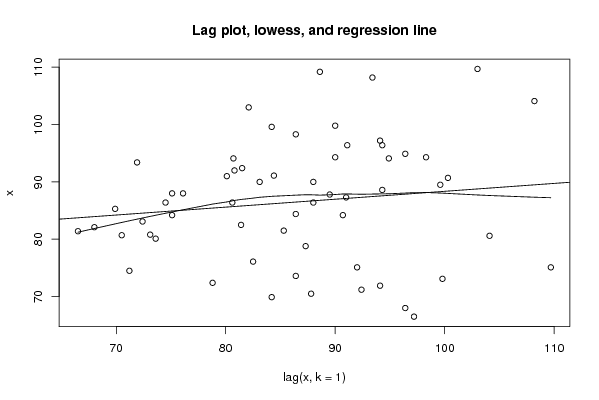
Bij de bespreking van de eerste assumptie concludeert de student terecht dat er op de autocorrelation plot sprake is van een hoge positieve correlatie bij lag 12. Indien we nu de lag instellen op 36 (zie link: http://www.freestatistics.org/blog/index.php?v=date/2008/Nov/03/t1225698449iuz70hvc7ppmuiy.htm) dan merken we dat ook op lag 24 een hoge autocorrelatie aanwezig is. Dit duidt op seizoensgebonden correlatie. De conclusie bij deze eerste assumptie zou dus moeten zijn dat de tijdreeks niet random is, maar dat ze wel degelijk autocorrelatie bevat. Het is echter wel een speciale correlatie, nl. een seizoensgebonden correlatie.

Bij de assumptie, is er sprake van een constant niveau, maakt de student gebruik van het run sequence plot. Dit is correct. Op LT termijn zien we dat deze geen constant verloop kent, eerder een dalend verloop. De student had best ook eens gekeken naar de trimmed en winsorised mean (berekening bij central tendency). Hier stellen we vast dat er een vrij constant verloop is en dat er niet veel invloed is van extremen.
Op lange termijn vermoeden we dus een daling, maar we zijn niet zeker.

Er is sprake van eenzelfde spreiding? Bij deze assumptie concludeert de student hier dat er inderdaad geen vaste spreiding is op basis van het run sequence plot.
Maar de vraag is 'Does the random component have a fixed variation?' Er wordt dus eigenlijk gevraagd om iets te berekenen van de random component. We dienen van de run sequence plot dus eigenlijk de voorspelling af te trekken.
Yt = C + Et en Ft = Yt - Et = c (de constante is dus de voorspelling)
Welke voorspelling moet je er nu aftrekken? Als er outliers zijn neem je best de mediaan, indien er geen outliers zijn neem je best het gemiddelde.
Je voert de simulatie dus opnieuw uit en typt in de R-code x <- x - 86.69 (= gemiddelde). Dan krijg een run sequence plot waar de voorspelling is afgetrokken.

De assumptie 'Does the random component have a fixed distribution?' werd correct opgelost.

Post a new message
Dataseries X:
109.20
88.60
94.30
98.30
86.40
80.60
104.10
108.20
93.40
71.90
94.10
94.90
96.40
91.10
84.40
86.40
88.00
75.10
109.70
103.00
82.10
68.00
96.40
94.30
90.00
88.00
76.10
82.50
81.40
66.50
97.20
94.10
80.70
70.50
87.80
89.50
99.60
84.20
75.10
92.00
80.80
73.10
99.80
90.00
83.10
72.40
78.80
87.30
91.00
80.10
73.60
86.40
74.50
71.20
92.40
81.50
85.30
69.90
84.20
90.70
100.30


Summary of computational transaction
Raw Inputview raw input (R code)
Raw Outputview raw output of R engine
Computing time2 seconds
R Server'George Udny Yule' @ 72.249.76.132

\begin{tabular}{lllllllll}
\hline
Summary of computational transaction \tabularnewline
Raw Input & view raw input (R code)  \tabularnewline
Raw Output & view raw output of R engine  \tabularnewline
Computing time & 2 seconds \tabularnewline
R Server & 'George Udny Yule' @ 72.249.76.132 \tabularnewline
\hline
\end{tabular}
%Source: https://freestatistics.org/blog/index.php?pk=19150&T=0

[TABLE]
[ROW][C]Summary of computational transaction[/C][/ROW]
[ROW][C]Raw Input[/C][C]view raw input (R code) [/C][/ROW]
[ROW][C]Raw Output[/C][C]view raw output of R engine [/C][/ROW]
[ROW][C]Computing time[/C][C]2 seconds[/C][/ROW]
[ROW][C]R Server[/C][C]'George Udny Yule' @ 72.249.76.132[/C][/ROW]
[/TABLE]
Source: https://freestatistics.org/blog/index.php?pk=19150&T=0

Globally Unique Identifier (entire table): ba.freestatistics.org/blog/index.php?pk=19150&T=0

As an alternative you can also use a QR Code:  

The GUIDs for individual cells are displayed in the table below:

Summary of computational transaction
Raw Inputview raw input (R code)
Raw Outputview raw output of R engine
Computing time2 seconds
R Server'George Udny Yule' @ 72.249.76.132


Descriptive Statistics
# observations61
minimum66.5
Q180.6
median87.3
mean86.8934426229508
Q394.1
maximum109.7

\begin{tabular}{lllllllll}
\hline
Descriptive Statistics \tabularnewline
# observations & 61 \tabularnewline
minimum & 66.5 \tabularnewline
Q1 & 80.6 \tabularnewline
median & 87.3 \tabularnewline
mean & 86.8934426229508 \tabularnewline
Q3 & 94.1 \tabularnewline
maximum & 109.7 \tabularnewline
\hline
\end{tabular}
%Source: https://freestatistics.org/blog/index.php?pk=19150&T=1

[TABLE]
[ROW][C]Descriptive Statistics[/C][/ROW]
[ROW][C]# observations[/C][C]61[/C][/ROW]
[ROW][C]minimum[/C][C]66.5[/C][/ROW]
[ROW][C]Q1[/C][C]80.6[/C][/ROW]
[ROW][C]median[/C][C]87.3[/C][/ROW]
[ROW][C]mean[/C][C]86.8934426229508[/C][/ROW]
[ROW][C]Q3[/C][C]94.1[/C][/ROW]
[ROW][C]maximum[/C][C]109.7[/C][/ROW]
[/TABLE]
Source: https://freestatistics.org/blog/index.php?pk=19150&T=1

Globally Unique Identifier (entire table): ba.freestatistics.org/blog/index.php?pk=19150&T=1

As an alternative you can also use a QR Code:  

The GUIDs for individual cells are displayed in the table below:

Descriptive Statistics
# observations61
minimum66.5
Q180.6
median87.3
mean86.8934426229508
Q394.1
maximum109.7


Parameters (Session):
par1 = 0 ; par2 = 12 ;
Parameters (R input):
par1 = 0 ; par2 = 12 ;
R code (references can be found in the software module):
par1 <- as.numeric(par1)
par2 <- as.numeric(par2)
x <- as.ts(x)
library(lattice)
bitmap(file='pic1.png')
plot(x,type='l',main='Run Sequence Plot',xlab='time or index',ylab='value')
grid()
dev.off()
bitmap(file='pic2.png')
hist(x)
grid()
dev.off()
bitmap(file='pic3.png')
if (par1 > 0)
{
densityplot(~x,col='black',main=paste('Density Plot bw = ',par1),bw=par1)
} else {
densityplot(~x,col='black',main='Density Plot')
}
dev.off()
bitmap(file='pic4.png')
qqnorm(x)
grid()
dev.off()
if (par2 > 0)
{
bitmap(file='lagplot.png')
dum <- cbind(lag(x,k=1),x)
dum
dum1 <- dum[2:length(x),]
dum1
z <- as.data.frame(dum1)
z
plot(z,main=paste('Lag plot, lowess, and regression line'))
lines(lowess(z))
abline(lm(z))
dev.off()
bitmap(file='pic5.png')
acf(x,lag.max=par2,main='Autocorrelation Function')
grid()
dev.off()
}
summary(x)
load(file='createtable')
a<-table.start()
a<-table.row.start(a)
a<-table.element(a,'Descriptive Statistics',2,TRUE)
a<-table.row.end(a)
a<-table.row.start(a)
a<-table.element(a,'# observations',header=TRUE)
a<-table.element(a,length(x))
a<-table.row.end(a)
a<-table.row.start(a)
a<-table.element(a,'minimum',header=TRUE)
a<-table.element(a,min(x))
a<-table.row.end(a)
a<-table.row.start(a)
a<-table.element(a,'Q1',header=TRUE)
a<-table.element(a,quantile(x,0.25))
a<-table.row.end(a)
a<-table.row.start(a)
a<-table.element(a,'median',header=TRUE)
a<-table.element(a,median(x))
a<-table.row.end(a)
a<-table.row.start(a)
a<-table.element(a,'mean',header=TRUE)
a<-table.element(a,mean(x))
a<-table.row.end(a)
a<-table.row.start(a)
a<-table.element(a,'Q3',header=TRUE)
a<-table.element(a,quantile(x,0.75))
a<-table.row.end(a)
a<-table.row.start(a)
a<-table.element(a,'maximum',header=TRUE)
a<-table.element(a,max(x))
a<-table.row.end(a)
a<-table.end(a)
table.save(a,file='mytable.tab')