Free Statistics
of Irreproducible Research!
Description of Statistical Computation | |||||||||||||||||||||
|---|---|---|---|---|---|---|---|---|---|---|---|---|---|---|---|---|---|---|---|---|---|
| Author's title | |||||||||||||||||||||
| Author | *The author of this computation has been verified* | ||||||||||||||||||||
| R Software Module | rwasp_backtobackhist.wasp | ||||||||||||||||||||
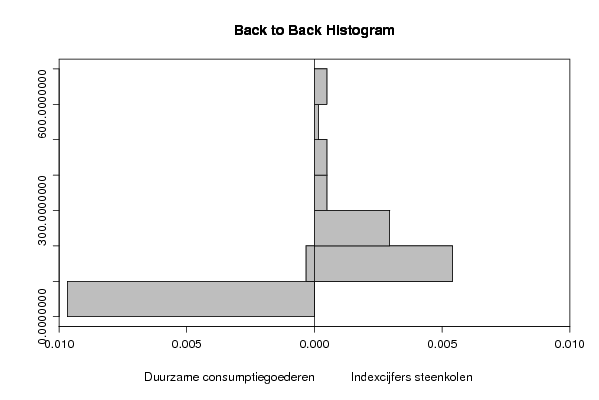
| Title produced by software | Back to Back Histogram | ||||||||||||||||||||
| Date of computation | Mon, 27 Oct 2008 03:40:24 -0600 | ||||||||||||||||||||
| Cite this page as follows | Statistical Computations at FreeStatistics.org, Office for Research Development and Education, URL https://freestatistics.org/blog/index.php?v=date/2008/Oct/27/t12251005262u42vb0q9bo4gx5.htm/, Retrieved Sun, 19 May 2024 13:36:33 +0000 | ||||||||||||||||||||
| Statistical Computations at FreeStatistics.org, Office for Research Development and Education, URL https://freestatistics.org/blog/index.php?pk=19143, Retrieved Sun, 19 May 2024 13:36:33 +0000 | |||||||||||||||||||||
| QR Codes: | |||||||||||||||||||||
|
| |||||||||||||||||||||
| Original text written by user: | |||||||||||||||||||||
| IsPrivate? | No (this computation is public) | ||||||||||||||||||||
| User-defined keywords | |||||||||||||||||||||
| Estimated Impact | 115 | ||||||||||||||||||||
Tree of Dependent Computations | |||||||||||||||||||||
| Family? (F = Feedback message, R = changed R code, M = changed R Module, P = changed Parameters, D = changed Data) | |||||||||||||||||||||
| - [Back to Back Histogram] [Combinatie: duurz...] [2008-10-27 09:40:24] [b5110a3ab194da7214bdf478e0a05dbd] [Current] | |||||||||||||||||||||
| Feedback Forum | |||||||||||||||||||||
Post a new message | |||||||||||||||||||||
Dataset | |||||||||||||||||||||
| Dataseries X: | |||||||||||||||||||||
57.1 100.8 100.7 86.2 83.2 71.7 77.5 89.8 80.3 78.7 93.8 57.6 60.6 91 85.3 77.4 77.3 68.3 69.9 81.7 75.1 69.9 84 54.3 60 89.9 77 85.3 77.6 69.2 75.5 85.7 72.2 79.9 85.3 52.2 61.2 82.4 85.4 78.2 70.2 70.2 69.3 77.5 66.1 69 79.2 56.2 63.3 77.8 92 78.1 65.1 71.1 70.9 72 81.9 70.6 72.5 65.1 61.1 | |||||||||||||||||||||
| Dataseries Y: | |||||||||||||||||||||
105.3 111.1 114.9 124.5 142.2 159.7 165.2 198.6 207.8 219.6 239.6 235.3 218.5 213.8 205.5 198.4 198.5 190.2 180.7 193.6 192.8 195.5 197.2 196.9 178.9 172.4 156.4 143.7 153.6 168.8 185.8 199.9 205.4 197.5 199.6 200.5 193.7 179.6 169.1 169.8 195.5 194.8 204.5 203.8 204.8 204.9 240 248.3 258.4 254.9 288.3 333.6 346.3 357.5 490.7 468.2 471.2 517.1 609.2 682 614 | |||||||||||||||||||||
Tables (Output of Computation) | |||||||||||||||||||||
| |||||||||||||||||||||
Figures (Output of Computation) | |||||||||||||||||||||
Input Parameters & R Code | |||||||||||||||||||||
| Parameters (Session): | |||||||||||||||||||||
| par1 = grey ; par2 = grey ; par3 = TRUE ; par4 = Duurzame consumptiegoederen ; par5 = Indexcijfers steenkolen ; | |||||||||||||||||||||
| Parameters (R input): | |||||||||||||||||||||
| par1 = grey ; par2 = grey ; par3 = TRUE ; par4 = Duurzame consumptiegoederen ; par5 = Indexcijfers steenkolen ; | |||||||||||||||||||||
| R code (references can be found in the software module): | |||||||||||||||||||||
if (par3 == 'TRUE') par3 <- TRUE | |||||||||||||||||||||