Free Statistics
of Irreproducible Research!
Description of Statistical Computation | |||||||||||||||||||||||||||||||||||||||||
|---|---|---|---|---|---|---|---|---|---|---|---|---|---|---|---|---|---|---|---|---|---|---|---|---|---|---|---|---|---|---|---|---|---|---|---|---|---|---|---|---|---|
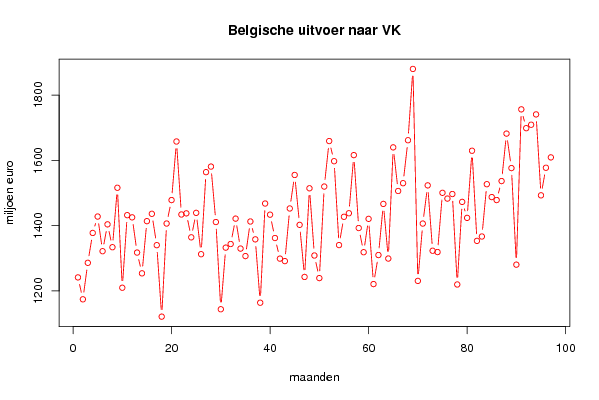
| Author's title | Belgische uitvoer naar het Verenigd Koninkrijk, voor de periode van 07/2000... | ||||||||||||||||||||||||||||||||||||||||
| Author | *The author of this computation has been verified* | ||||||||||||||||||||||||||||||||||||||||
| R Software Module | rwasp_univariatedataseries.wasp | ||||||||||||||||||||||||||||||||||||||||
| Title produced by software | Univariate Data Series | ||||||||||||||||||||||||||||||||||||||||
| Date of computation | Sun, 26 Oct 2008 16:36:57 -0600 | ||||||||||||||||||||||||||||||||||||||||
| Cite this page as follows | Statistical Computations at FreeStatistics.org, Office for Research Development and Education, URL https://freestatistics.org/blog/index.php?v=date/2008/Oct/26/t12250606797gd5zx0nykb339n.htm/, Retrieved Sun, 19 May 2024 15:20:45 +0000 | ||||||||||||||||||||||||||||||||||||||||
| Statistical Computations at FreeStatistics.org, Office for Research Development and Education, URL https://freestatistics.org/blog/index.php?pk=19083, Retrieved Sun, 19 May 2024 15:20:45 +0000 | |||||||||||||||||||||||||||||||||||||||||
| QR Codes: | |||||||||||||||||||||||||||||||||||||||||
|
| |||||||||||||||||||||||||||||||||||||||||
| Original text written by user: | |||||||||||||||||||||||||||||||||||||||||
| IsPrivate? | No (this computation is public) | ||||||||||||||||||||||||||||||||||||||||
| User-defined keywords | |||||||||||||||||||||||||||||||||||||||||
| Estimated Impact | 131 | ||||||||||||||||||||||||||||||||||||||||
Tree of Dependent Computations | |||||||||||||||||||||||||||||||||||||||||
| Family? (F = Feedback message, R = changed R code, M = changed R Module, P = changed Parameters, D = changed Data) | |||||||||||||||||||||||||||||||||||||||||
| - [Univariate Data Series] [Belgische uitvoer...] [2008-10-26 22:36:57] [1ec5ee4d60319b01c3149f541ee67727] [Current] | |||||||||||||||||||||||||||||||||||||||||
| Feedback Forum | |||||||||||||||||||||||||||||||||||||||||
Post a new message | |||||||||||||||||||||||||||||||||||||||||
Dataset | |||||||||||||||||||||||||||||||||||||||||
| Dataseries X: | |||||||||||||||||||||||||||||||||||||||||
1241,5 1174,4 1286,2 1377,7 1428 1321,8 1404,1 1334 1516,2 1209,8 1432,2 1425,5 1317,6 1254 1413,9 1436,4 1340,3 1121,2 1406,6 1478,5 1658 1434,3 1437,8 1364,3 1439,3 1312,6 1564,1 1581,1 1411,2 1143,9 1332,7 1343,8 1421,6 1329,8 1306,8 1412,8 1358,1 1163,9 1467,9 1433,7 1362,2 1299 1291,5 1452,7 1555,4 1402,5 1242,9 1514,6 1308,6 1239,3 1519,9 1659,4 1597,6 1340,6 1427,2 1438,1 1616,2 1392,8 1318,7 1420,9 1221 1310 1466,7 1299,3 1640 1506,3 1530,2 1661,9 1880,3 1230,8 1406,5 1523,5 1323,2 1319,2 1500,7 1483 1497 1219,8 1472,9 1423,9 1629,6 1353,4 1366,8 1527,1 1487,6 1478,6 1536,7 1682,1 1576,5 1280,5 1756,5 1698,8 1709,3 1741 1493 1577,5 1609,3 | |||||||||||||||||||||||||||||||||||||||||
Tables (Output of Computation) | |||||||||||||||||||||||||||||||||||||||||
| |||||||||||||||||||||||||||||||||||||||||
Figures (Output of Computation) | |||||||||||||||||||||||||||||||||||||||||
Input Parameters & R Code | |||||||||||||||||||||||||||||||||||||||||
| Parameters (Session): | |||||||||||||||||||||||||||||||||||||||||
| par1 = Belgische uitvoer naar het Verenigd Koninkrijk, voor de periode van 07/2000 tot en met 07/2008. ; par2 = http://www.nbb.be/belgostat/PresentationLinker?TableId=365000038&Lang=N ; | |||||||||||||||||||||||||||||||||||||||||
| Parameters (R input): | |||||||||||||||||||||||||||||||||||||||||
| par1 = Belgische uitvoer naar het Verenigd Koninkrijk, voor de periode van 07/2000 tot en met 07/2008. ; par2 = http://www.nbb.be/belgostat/PresentationLinker?TableId=365000038&Lang=N ; par3 = ; | |||||||||||||||||||||||||||||||||||||||||
| R code (references can be found in the software module): | |||||||||||||||||||||||||||||||||||||||||
bitmap(file='test1.png') | |||||||||||||||||||||||||||||||||||||||||